My next class neighbour, Mr D, has been evangelising about venn diagrams since he did the TAM (Teach A-level Mathematics) course. His lesson on equations and graphs using venn diagrams was brilliant! Then, at MathsConf5, Craig Barton (@mrbartonmaths) shared his love of venn diagrams.
And they are on the new english GCSE Maths syllabus.
In light of all this, I introduced venn diagrams as a vehicle for probability (Y10) and rounding (Y9).
Introduction
First of all I used the films of Tim Burton, Johnny Depp and Helena Bonham-Carter to introduce a triple venn diagram, with the box to represent everything – I like dropping in the proper forms or technical bits early on in all topics.
We had quite a lengthy conversation about films, including why the Bond film could be on the diagram. The discreet use of IMDB (with my permission) settled some arguments too!
Rounding
I wanted my Year 9s to consider the differences and similarities between different forms of rounding. I created a simple diagram for them to complete where they compare ‘nearest ten, ‘one decimal place’ and ‘two significant figures’. You can download it here:
There are three different menus – if you hand them out correctly no two pupils should have the same menu. Pupils write their names on the front and fold the menu in half so that they can see the price list.
If you go through the activity in post 231, pupils can use their menus to work out totals without copying from each other. You can then get the pupils to gather into the three different shop groups and argue out the misconceptions.
I used this on my first lesson this year with a shared Year 7 class, in front of five PGCE students and it worked a treat!
Proportion … it comes in so many forms and different students grasp different elements at different speeds. Differentiation hell!
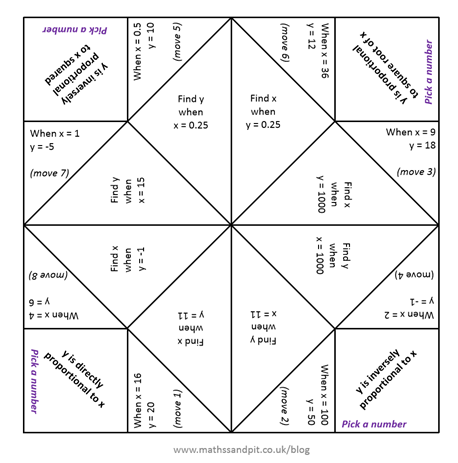
What about a little resource that offers up 4x8x8 variations of question ranging from simple direct to proportion to inversely proportional to the square? It’s not a new app, it’s an old app – a fortune-teller snapdragon:
Joey? Why yes! Joey Tribbianni from ‘Friends’ (random 90s TV reference). When the friends came to London, from New York, Joey demonstrated his unique technique for navigation:
He jumps into the map! And that is what my students did for vectors.
In the first lesson we started looking at the basics of vectors. I found this PowerPoint from TES resources to be really good for starting discussions: Introduction to Vectors by rhemsley
In the second lesson, we started to solve problems and moved outside.
Objective
To develop problem solving skills with vectors.
To understand how vectors relate to more complex diagrams
Resources
Chalk (coloured is good)
Vector questions from a textbook, worksheet or exam database
Mini whiteboards – optional for working out/calculations on the move
Activity
I drew one side of a regular (ish) hexagon on the wall (I really would like an outside chalk board). We labelled the ends A & B and the vector joining them was a. I decided to use a different colour chalk for each vector to make them stand out.This was followed by vector b (joining B & C) and vector c (joining C & D). To be honest, I had to get a student to draw in D and the line – I’d accidentally* drawn the diagram higher than my arm reach.
(*I’m over 5ft 6in, but my lively lads are nearly 6ft – gallantry meant they felt they had to help and hence engaged with the task very quickly!)
Back to the problem:
This hexagon wasn’t going to draw itself, but which of the existing vectors to use to create point E? I explained that vectors a, b & c are our building blocks, which helped us move on.
The students were quick to identify vector a. They were very picky about the direction too. My gallant helpers added it to the diagram. We used the same logic to finish off the hexagon.
The students then went away with their worksheets and drew out their own versions of this diagram. As I walked around there were some heated debates as to which vector went where and in which direction. They addressed many misconceptions before they even looked at the question – it comes back to the old rule of ‘ Write down what you know’. They’d already answered questions on the diagram that they hadn’t yet been asked.
The questions were based on this diagram:
They started easy and quickly moved on to trickier concepts:
Why can’t you just invent a letter for BE?
Does it matter which route you take around the diagram?
Can vectors be simplified like algebra?
All of these questions can be solved by ‘doing a Joey’.
When I teach vectors I always use the analogy that vectors are like a one-way system of roads. For example, the vector from E to B is drawn in, but has no specific vector – this is like a closed road, you must detour down the other roads to get there.
As you walk down the other roads (vectors), are you going the correct way?
If the answer is ‘yes’, just make a note of the vector and carry on.
If the answer if ‘no’, then a minus sign gives you the permission to go the wrong way – write the the vector with a negative. (This then leads to the follow up discussion of why this works through use of column vector examples)
There is more than one route. What do you chose?
Clockwise or anticlockwise?
EDBC or EFAB?
Walk them both and see what happens – you can see that the vectors are the same, just arranged differently.
Finally, when you start to compare different routes, you can see that vectors cancel out, just like algebra. In fact, it quickly becomes clear that basic rules for simplification still apply.
Student Reaction
The sight of pupils walking around diagrams looked like something from a Monty Python funny walk sketch. As we walked back to class, after half an hour in the sun, I overheard two different groups of students. One group said: ‘That was a really good lesson’ and ‘Yeah, I enjoyed that!’ – that may have been the sunshine though. Another group however said: ‘I get it now. I didn’t get it last lesson the board, but now I get it!’ – and that wasn’t just about the sunshine!
*HEALTH WARNING*
You may require nerves of steel to complete this dramatic construction of a distance-time graph. A mental swear box may also be handy for everytime you resist the urge to say what you are thinking. Strong coffee is not advisable as you want to be the image of serenity, not a jittery wreck.
Ready? We shall begin …
Aim
To construct distance-time graphs from collected data and interpret the speed from a graph.
Equipment
Metre sticks or tape measure
Open area outside
Pencils
Paper (squared/graph etc)
Ruler
Calculator
Stopwatch (or mobile phone app)
Chalk (optional)
Spreadsheet (optional)
Activity – in theory
Group your students in threes. They will rotate roles between runner, timer and recorder.
Pick four points in your school yard that are a reasonable distance apart. Chalk X’s and A to D next to them. Your graph will start at A and end at D. If you have the space you can create more than just four points.
Students are responsible for measuring the distance between A & B, B & C and C & D. These are the three activity stations.
Students take it in turns in their groups to run (walk, hop, dance etc) between two points. The time for each student at each station is recorded.
Once the data is collected, students gather the information in a table – cumulative time & distance columns will be helpful for plotting a distance time graph.
Each student draws three graphs, on the same axes, to represent the speeds of their group.
Each student then calculates their speed for each station. They can compare their calculations with their group and what is going on in the graph. Hopefully they will deduce that the gradient of the graph represents the speed.
Activity – in practice
Where to start?
Please … don’t be disheartened if your activity starts like mine did! We got organised and went outside. I designated groups to stations and they started measuring, moving onto the next station when they were done.
One group came up to me and complained that the distances were all the same. Rather than hold onto the end of the tape measure at the start, then measure, this group put the end on the ground, spooled out the tape measure and walked to the next station – trailing the end of the tape along the floor.
A second group complained that the other groups were spending too long on measuring when they were waiting for a tape measure. I’d counted them out one per group – where was it?
‘Oh, we left that in the classroom’.
Mental gnashing of teeth.
‘Would that be the locked classroom?’ I ask
‘Yeah … we’ll get it’ off run two students
They come back complaining the classroom is locked!
Okay … we get the measuring done. Then they start running and timing. I check on one group and notice they are merrily taking all of their times away from ten minutes. They explain the mobile phone is counting down from ten minutes. Although I was impressed by their ingenuity, maybe changing the phone mode would have been more appropriate.
And let’s not mention the student who, on the final station, accidentally wiped all the results off the mini-whiteboard …
Then a miracle happened!
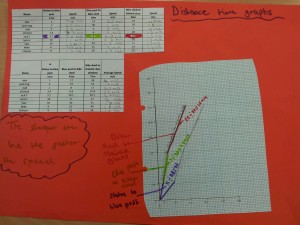
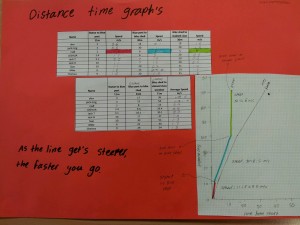
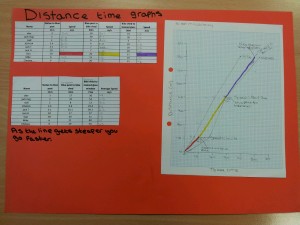
I collected their data together on a spreadsheet and projected it on the board. We discussed any anomalies and how we would progress. We decided neat printouts would help. They drew their graphs, colour coded their data and observed the gradient link to speed. I was very impressed by the speed at which they grasped this concept and proud of their (eventual) independent work.
Here is a quick fun starter to get your class thinking about dimensions and volume.
Question: How many students can you fit into a metre cube?
The discussion will probably include:
‘How big is a metre?’ (find a metre stick)
‘Did you mean standing in a square?’ (no)
‘How big is the student?’ (average – that answer annoys students)
And finally ‘Huh?’ (ask the person next to you to explain)
Whilst this is going on make a metre square on the wall and the floor, using duct tape. The inner measurements of the cube are 1m, the rest is just tape border.
The Predictions
Draw up a quick tally chart of how many students they think will fit. A bright child will usually ask how are you going to find out. Easy …
Put students in the cube
Let them put themselves into the confines of the cube. Cue bouncy boys squashing up. Then remind them it can’t be higher than a metre. You might find it useful to have two spare students hold metre sticks vertically at the non-wall end to define the end of the cube.
We managed nine boys, plus gaps at the top for bits of a tenth boy – it wasn’t ethical to chop one up and sprinkle the bits. So we imagined the tenth person balanced on the gaps around their shoulders.
Ten? That is a new record for this activity!
The Point
Volume is the space inside a 3D shape.
One metre cube is bigger than you think.
It’s a memorable activity to refer back to.
Even better if …
I’d love to get sturdy board covered in birthday (or Christmas) paper to put under and around the cube to start a discussion about surface area. You could make a big show of unfolding the cube and laying the wrapping out on the floor to form a huge net.
Note
I used to do this by taping metre sticks into a cube, but they fell apart easily. In some schools three metre sticks is a challenge, twelve would be a miracle find. Duct tape works much better!
Just a quick picture to share today. My colleague, D, went to the same TeachMeet as me and was equally impressed by the use of gaffer tape in the ‘Big Maths’ presentation.
Today his class were doing box plots and took the idea of averages even further. They made a vertical box-plot on a wall of the class heights. Brilliant!