Tag Archives: proportion

223. Let them eat custard!

This post isn’t a resource, more of a source of ideas. We tell students that maths is about problem solving, but how many problems are fictitious?
image

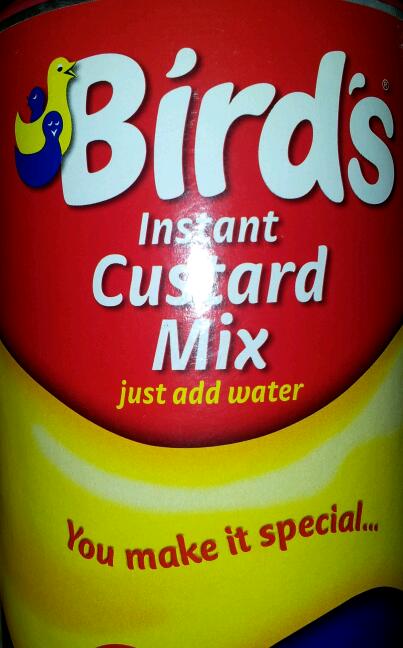
Here is a problem, taken directly from ‘real life’ when a friend was making custard on sunday evening.

The question
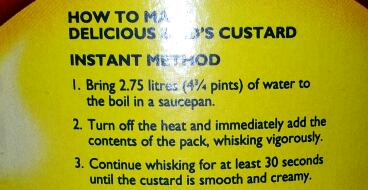
Do you think the instructions are wrong?
image

Does 2.75 litres of water seem right? Use the whole packet? How much is in the packet?

The problem
image

The custard powder had been bought from the wholesalers. It was such good value because it was a catering pack.

  • If the pack weighs 605g, how much would you need for one portion?
  • How much water would you need?
  • How could you decide if 55ml was a decent size portion?
  • How many pint jugs would the fifty-five 55ml portions fill?

If you have access to a wholesaler or talk nicely to the canteen, you will be surprised how much proportion work you can find in catering size value packs

By the way, my friend did a couple of calculations and a bit of estimating resulting in a large, but tasty, bowl of custard.


206. Seek a number pattern

So I’m all ready to teach a lesson recapping number patterns from the basics for a lower ability group … then a visitor to the Department arrives and asks if it’s okay if they observe my lesson. They’ve been told that there is usually something ‘off the wall’ happening in my room. Thanks … I think!

Well, I’m not one to disappoint. A little fun with the starter perhaps? The sun is shining and I’ve got whiteboards and chalk …

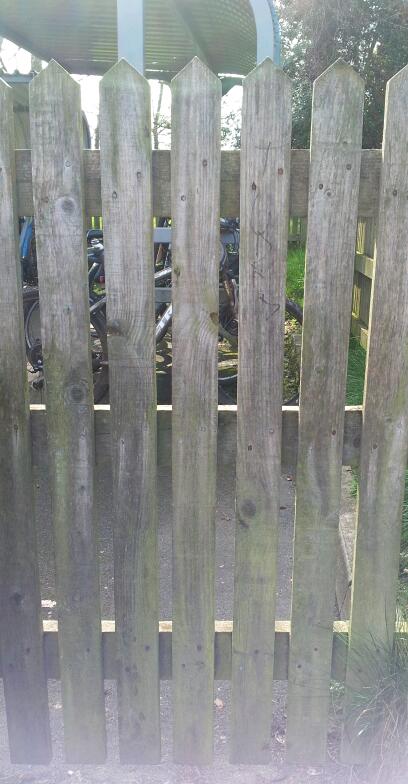
We’ve all seen fence panel number patterns. Here is a fence:
image

What can you see?

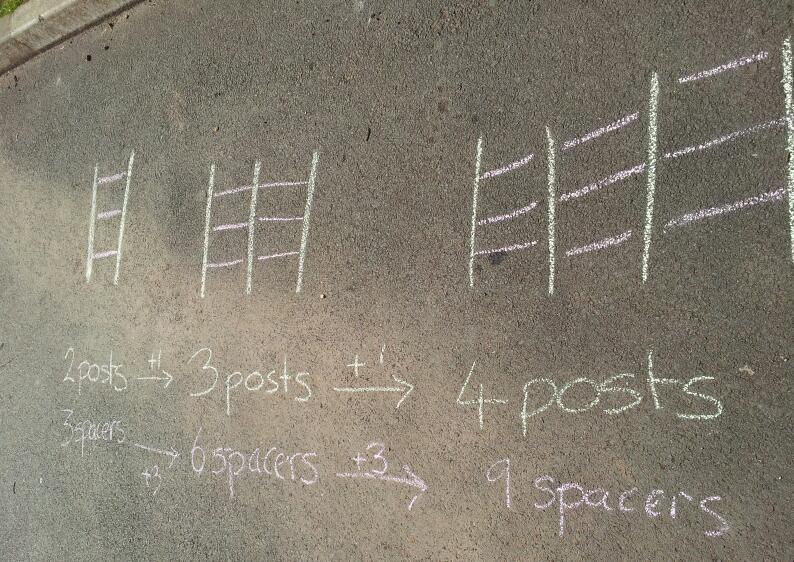
We discussed the pattern linking number of posts and spacers. We then represented the fence in colour coded symbols (yes, we have chalk in more than one colour!) and annotated it.

image

The class were then sent off to find their own patterns. They found repeating patterns and made notes on their whiteboards. Once they were happy with their work they could chalk it out.

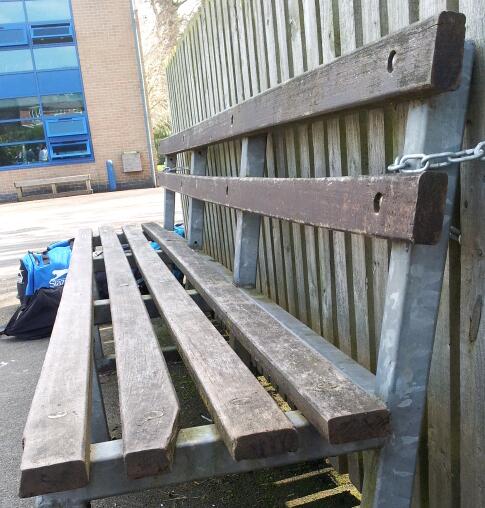
This group looked at number of slats on a bench with number of benches.
image

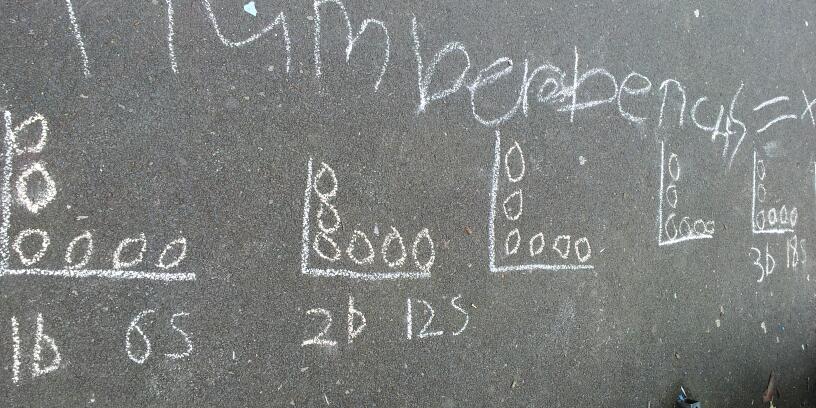
They represented each bench as an ‘L’ and each slat with an ‘o’.
image

They worked out:
No of benches x 6 = No of slats

Other groups looked at number of windows & number of classrooms and number of benches & number of picnic tables.

We then went back to our quiet number pattern work in the classroom.

This task is easily adaptable for many aspects of number, including ratio and proportion.

201. BBC Crispies

There was an interesting discussion on the BBC Breakfast programme this morning about the exchange of maths teaching ideas between British and Chinese teachers.

The guests on the sofa were from the NCETM and a serving Head of Maths. There was mention of the innovative ideas used to teach Maths in Britain – including some of mine. I’m not being presumptive, I happen to know that Head of Maths – in fact some of his ideas are on this site (JDs Tree Diagrams). So just in case you missed Breakfast, here is some Cake.


43. Visualising percentages

Percentages are all to do with proportion, but this seems to escape the understanding of some. If you calculate 20% of £15, this is different to 20% of £25. The 20% is not a fixed quantity. How can you explain this to visual learners?

Visual Percentages/Proportion

Equipment
Pencil
Ruler
Paper – squared makes the task easier
Coloured pencils (optional)

Calculations
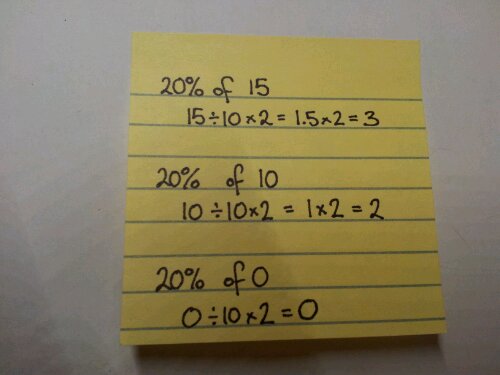
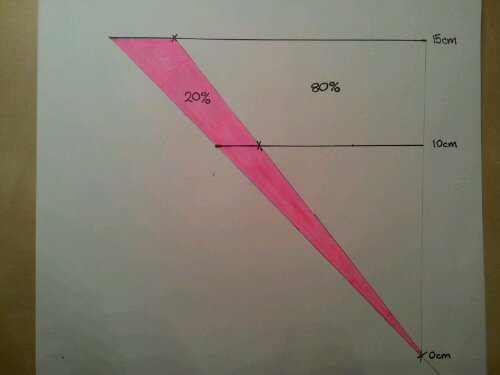
Find 20% of 15, 10 and 0.

image

Construction
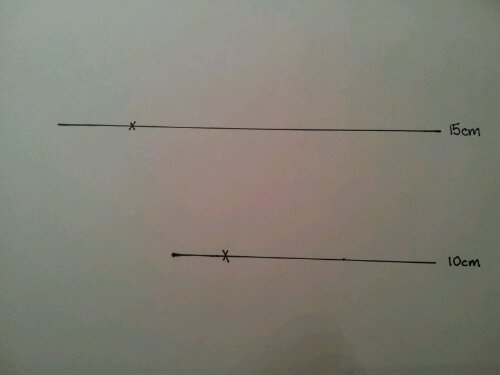
Draw a 15cm line, mark 3cm along it.
Move down 5cm.
Draw a line, mark 2cm along it.

image

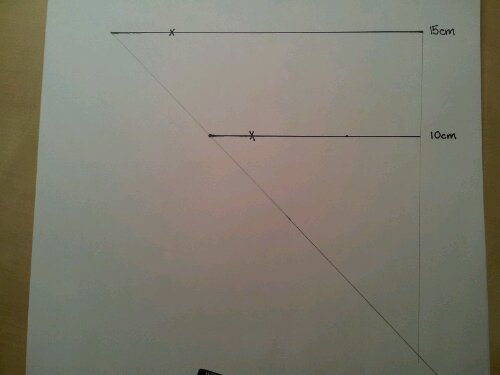
Join the ends of the lines with a ruler and indicate this with a cross.
image

This should be 10cm lower than the bottom line.
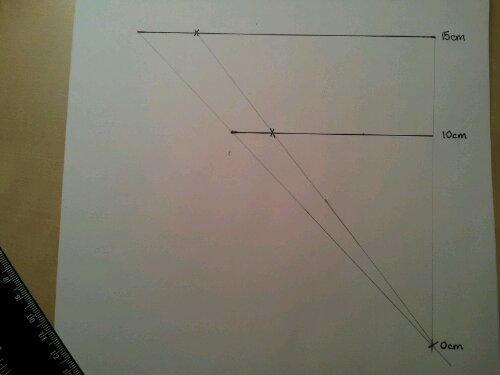
Repeat, joining the 3cm and 2cm points.
image

Shade in the smaller triangle.
Label the lines.
image

The Maths bit
The width of the triangle indicates the whole amount (100%).
The shaded width represents 20%.
The unshaded width represents 80% (Ask students if they know why).

The whole diagram represents 20% of any number from 0 to 15.
This can be adapted for any number and percent. It visually shows that as a number gets bigger the percent increases proportionally.

You can also use this to investigate fractions.

Note: This is for comparing widths. You can challenge your students to prove whether it is also true for the areas of the triangles.