How on earth can you create a maths lesson using these items?
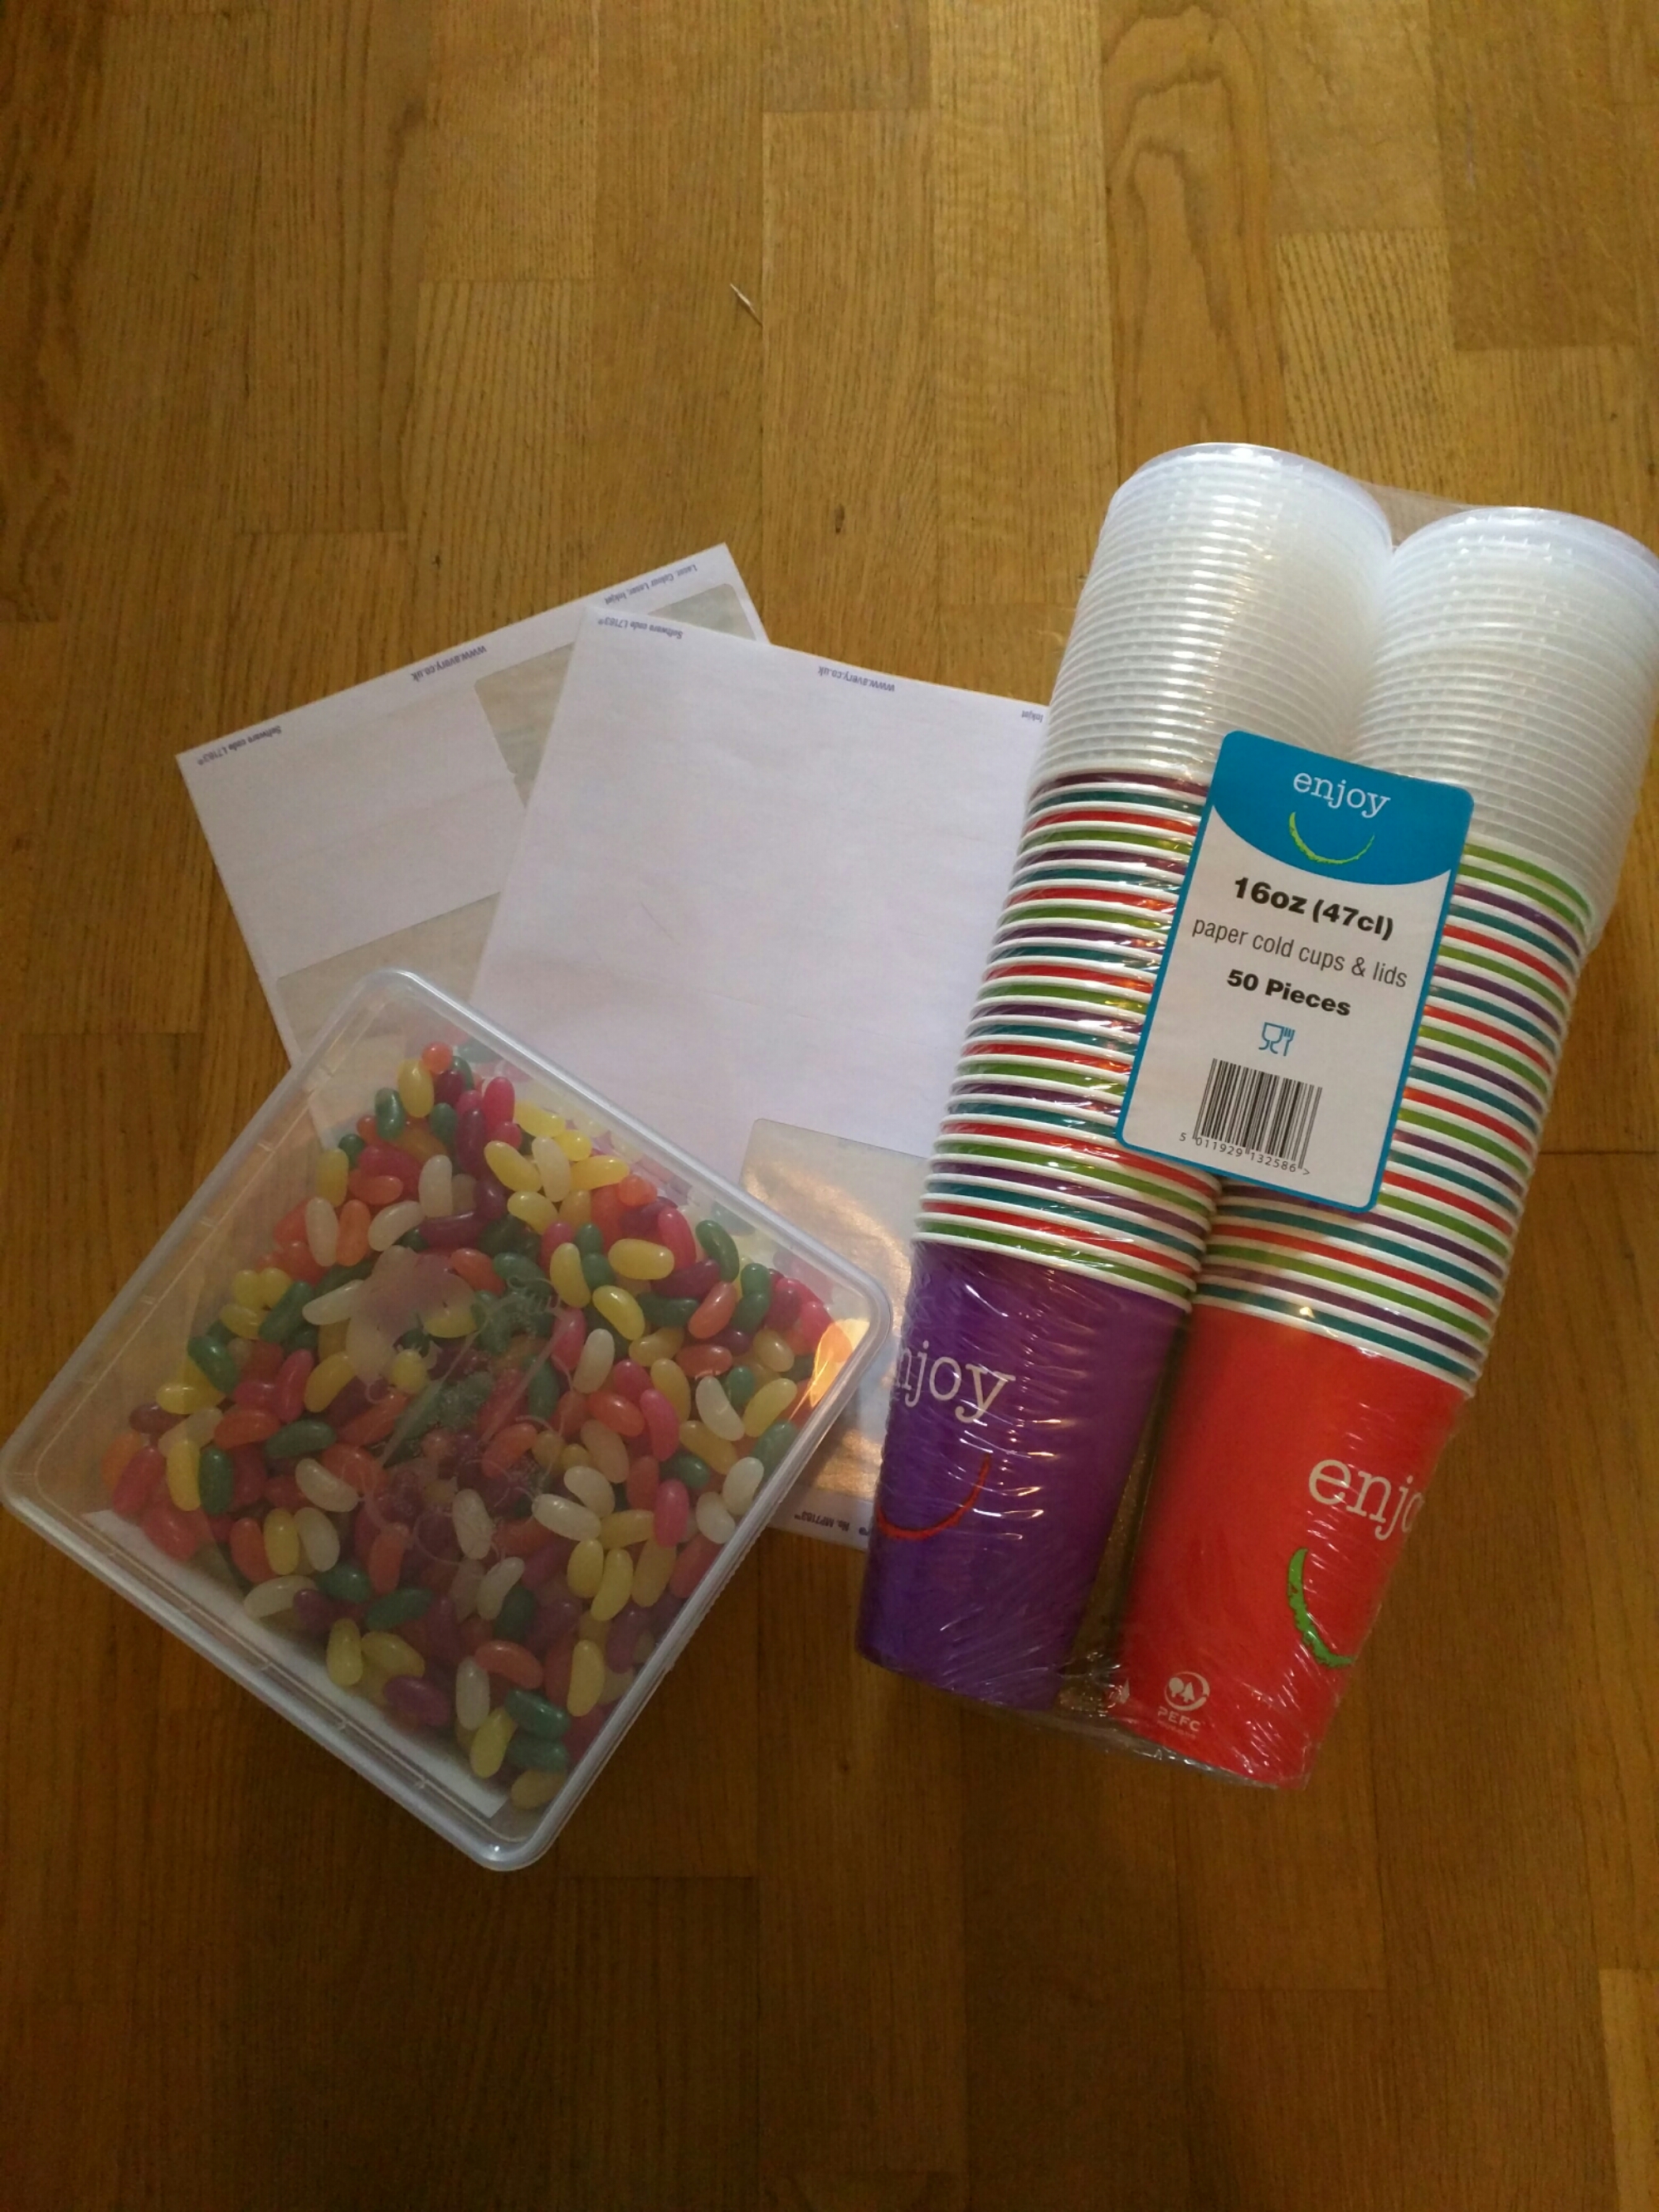
Well, first sort them into colours, then put twenty jelly beans into each cup. Make sure there are only two colours in each cup, write the contents on a sticky label and use that to seal the cup. Each cup should have slightly different numbers or colours – it prevents copying.
Note: Eat all the orange jelly beans – you’ll be doing your dignity a favour!
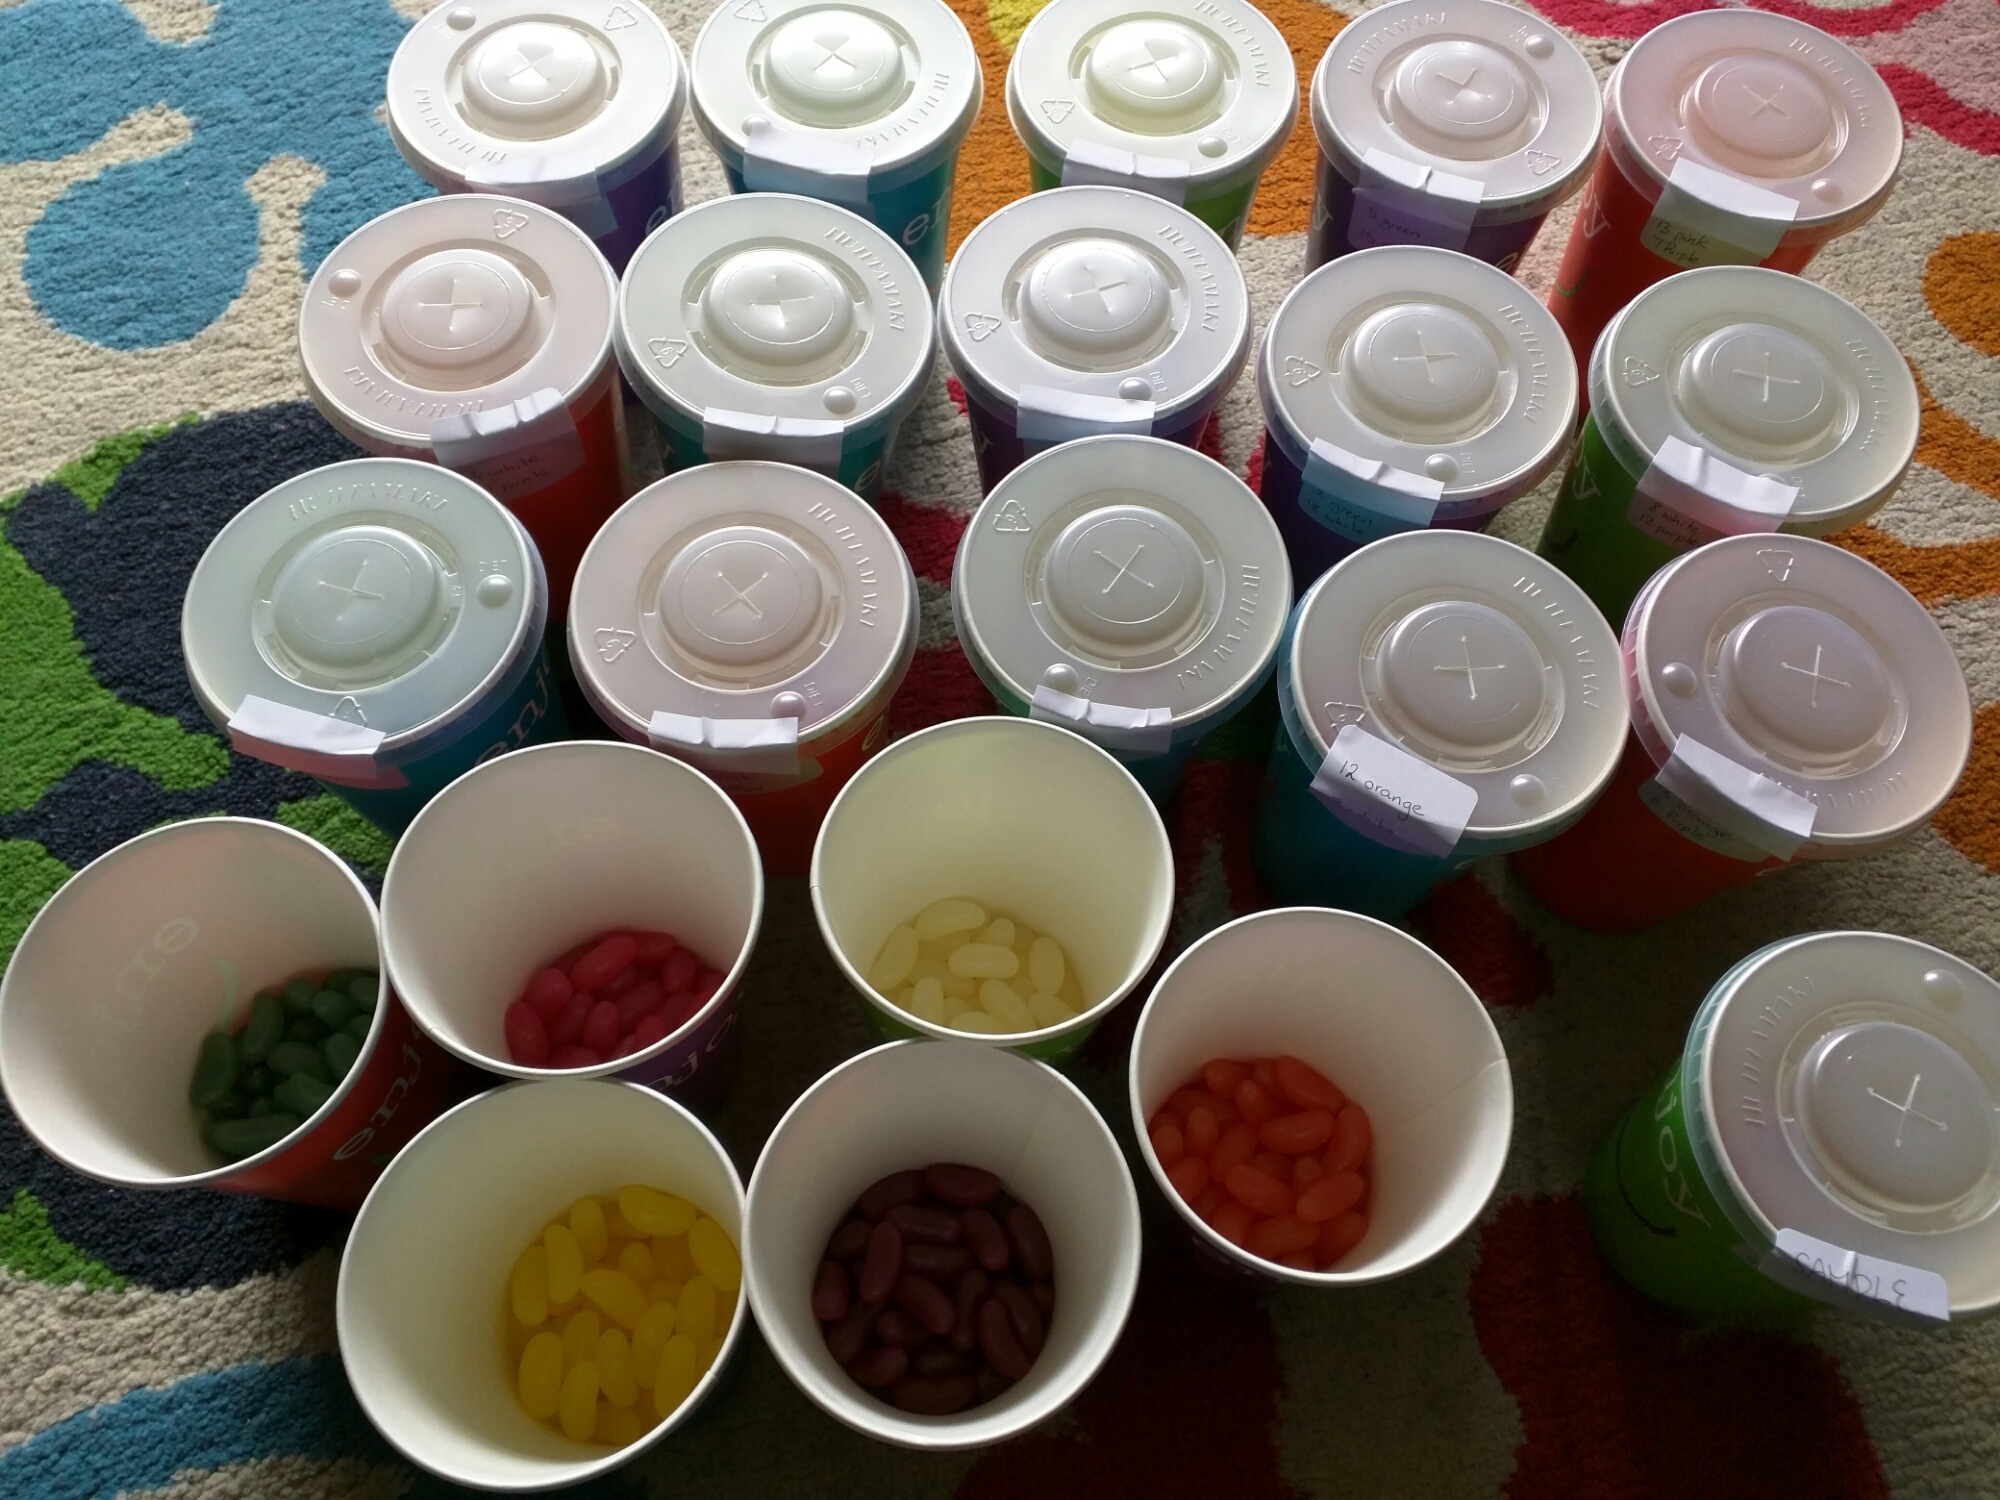
Have you figured it out yet? No? We’re doing probability tree diagrams without replacement. Now I know you could do this with one experiment at the front of the class, but getting everyone involved means it’s more hands-on and memorable.
The Experiment
I did a demonstration of this on the board first, before handing out the cups and worksheets. I told the class what was in my cup and picked out a jellybean. It was orange. I drew the first stage of the worksheet (see below) on the board: What was the experiment? How many of each colour do we have? What is the probability of each colour? Then we filled in the first stage of the tree diagram.
I ate the jellybean.
But you can’t do that – it messes up the experiment! I asked what would be the probabilities for a second jellybean now. They figured out the slight change to the probabilities. Then we went back and thought about what would have happened if my first jellybean had been lemon.
I always encourage students to work out all the possible outcomes before they even look at the rest of the questions. And this is why you need to eat all the orange – the list on the board was:
Do I really need to put the last one?
After much giggling, the class were let loose with their own cups. They did the experiment once with their standard cups and then had their work checked. They could then alter (eat) the contents of their cup so that a minimum of five beans of two colours remained. You can see an example of a student’s work here:
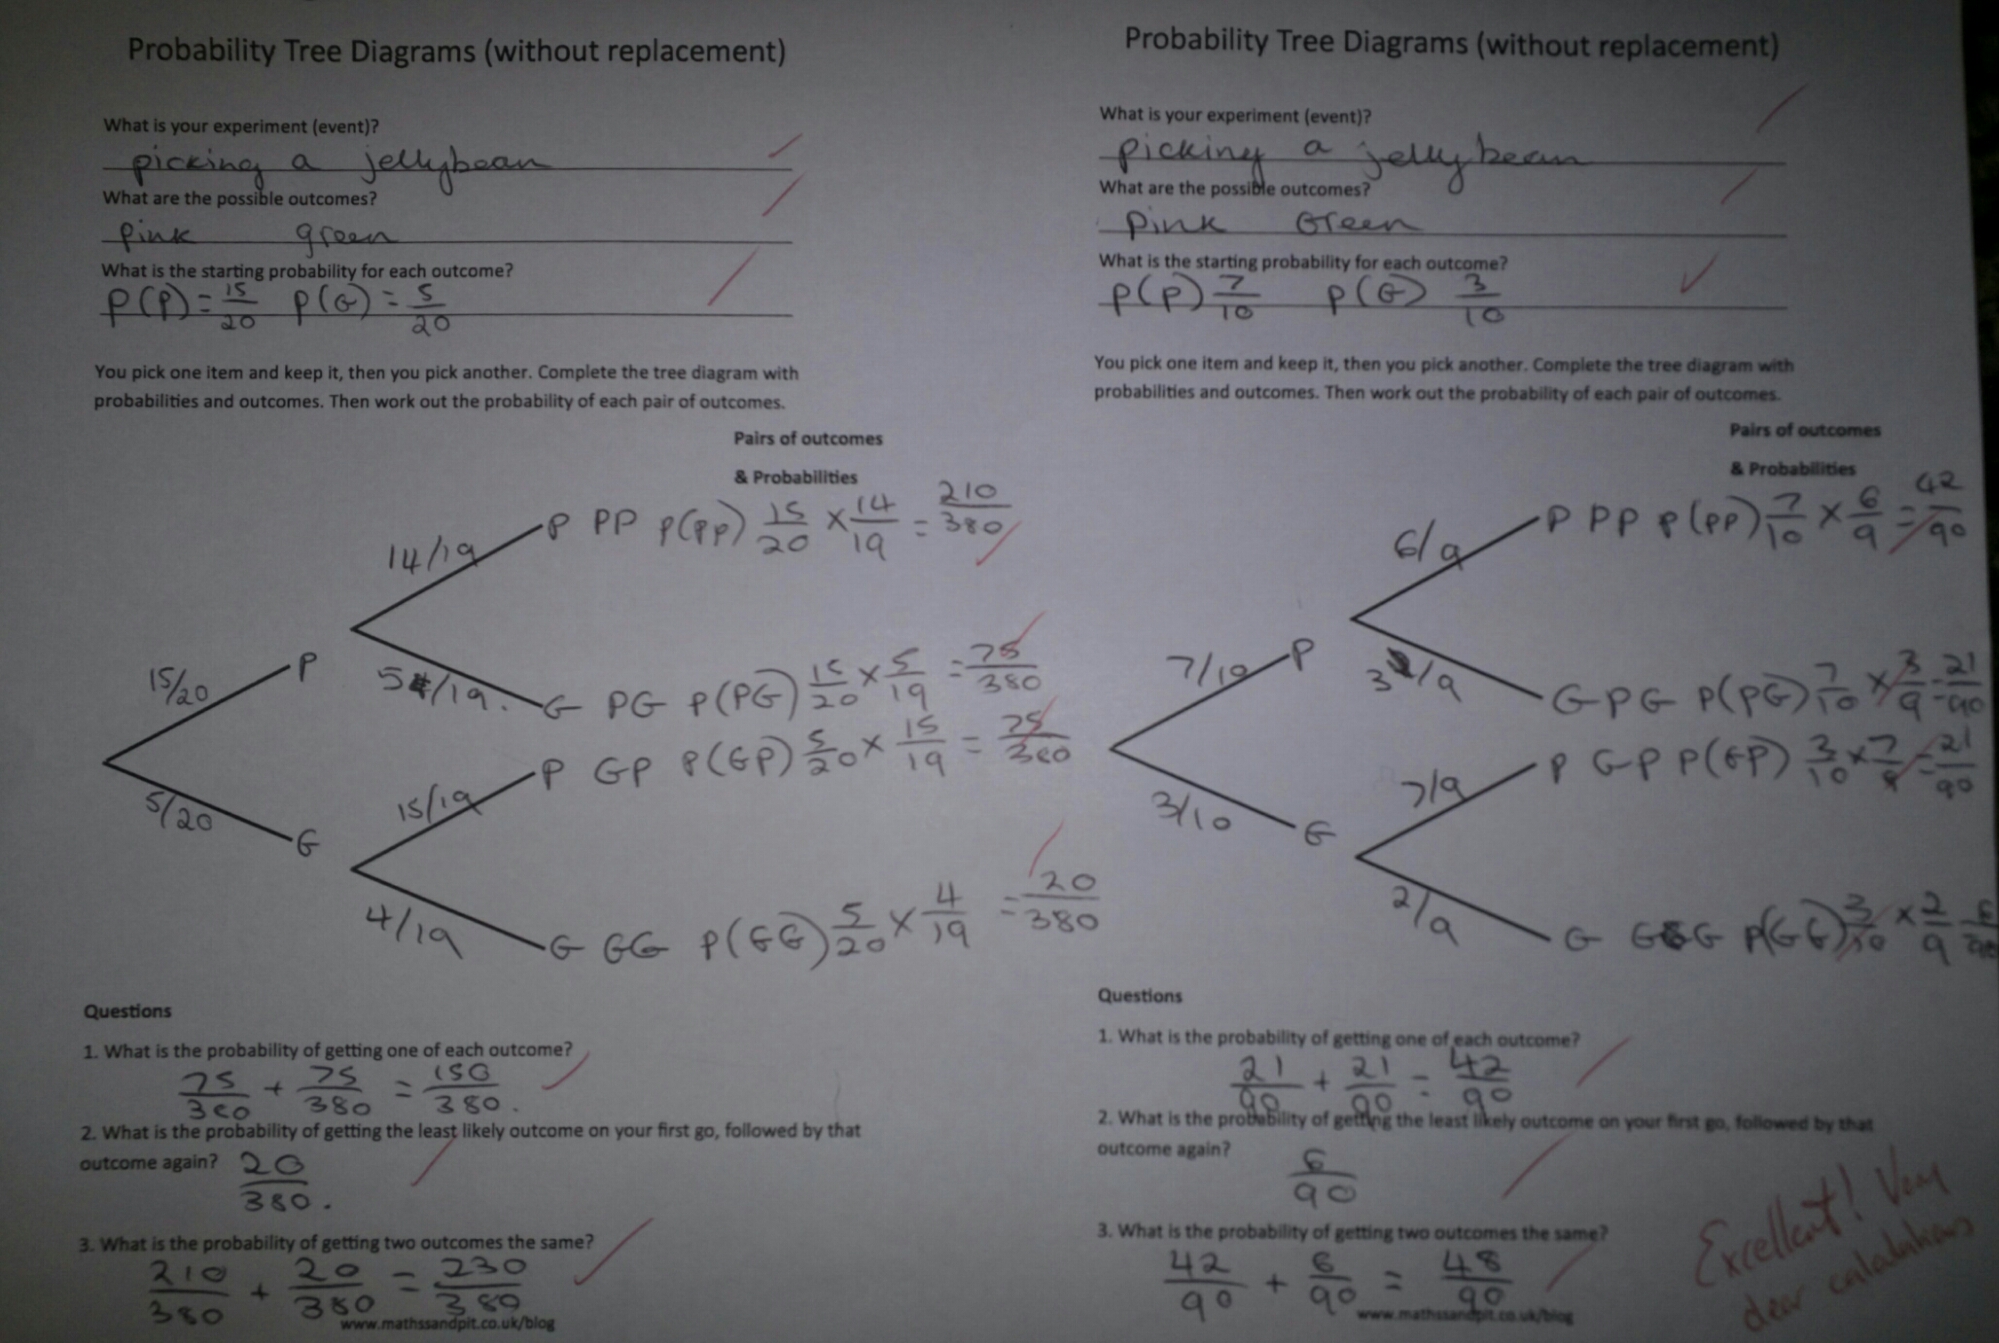
I summarised the lesson by looking at different types of probability problem where items are not replaced. I now have a nice ‘hook’ to refer to when discussing probability tree diagrams without replacement.
Download the worksheet here:
Tree diagram without replacement (pdf)
I printed out two per page as it fitted nicely in their books. The descriptions are deliberately vague to allow it to be used in different experiments.
(The usual warning regarding food allergies and beliefs stands. Some jellybeans have animal derivative gelatine – please check, you don’t want to accidentally upset a student)
Like this:
Like Loading...


