Monthly Archives: September 2014

232. Steps in Volume

This is a quick little post to give you a nifty little resource inspired by the ideas of Bruno Reddy (@MrReddyMaths). I suggest you visit his website at: http://mrreddy.com/.

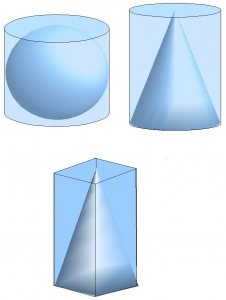
Sphere cone pyramid

Image Credit: http://k12math.com/math-concepts/algebra/volumes/volumes.htm

I’ve been teaching my class how to calculate the volume of spheres, cones and pyramids. They really like these staged worksheets. You could print them out as they are, but I personally print them as A5 booklets which fit into their books.

Volume of Sphere Cone Cylinder (pdf)

231. Fish Shop Maths

I’ve been using this idea since I first started teaching and I’ve finally got around to typing it up!

fish_chips

Image Credit:http://coachandhorsesn16.com/eat/fish-n-chips/

I introduce order of operations by creating an imaginary Chip Shop. I usually read out orders and get the students to write down what they think they are on whiteboards. Note that when you read out the orders, the punctuation doesn’t give any hints.

  • ‘Two fish and three chips’ – 2 fish & 3 portions of chips
  • ‘Fish and chips twice’ – 2 fish & 2 portions of chips or 1 fish & 2 portions of chips
  • ‘Five sausage and chips’ – 5 sausages & 5 portions of chips or 5 sausages & 1 portion of chips

This activity always prompts a ‘discussion’ as to who is correct. The misconception of what an order could mean links nicely with the misconception when working out 2 + 3 x 4. You could also adapt the idea for writing algebraic expressions.

A presentation, with questions, is downloadable in three different formats here:

Fish Shop BIDMAS (pptx)

Fish Shop BIDMAS (ppt)

Fish Shop BIDMAS (ppsx)


230. Resource of the week

I came across this splendid resource on Similar Triangles, by cturner16, on the TES website:
Similar triangles matching activity

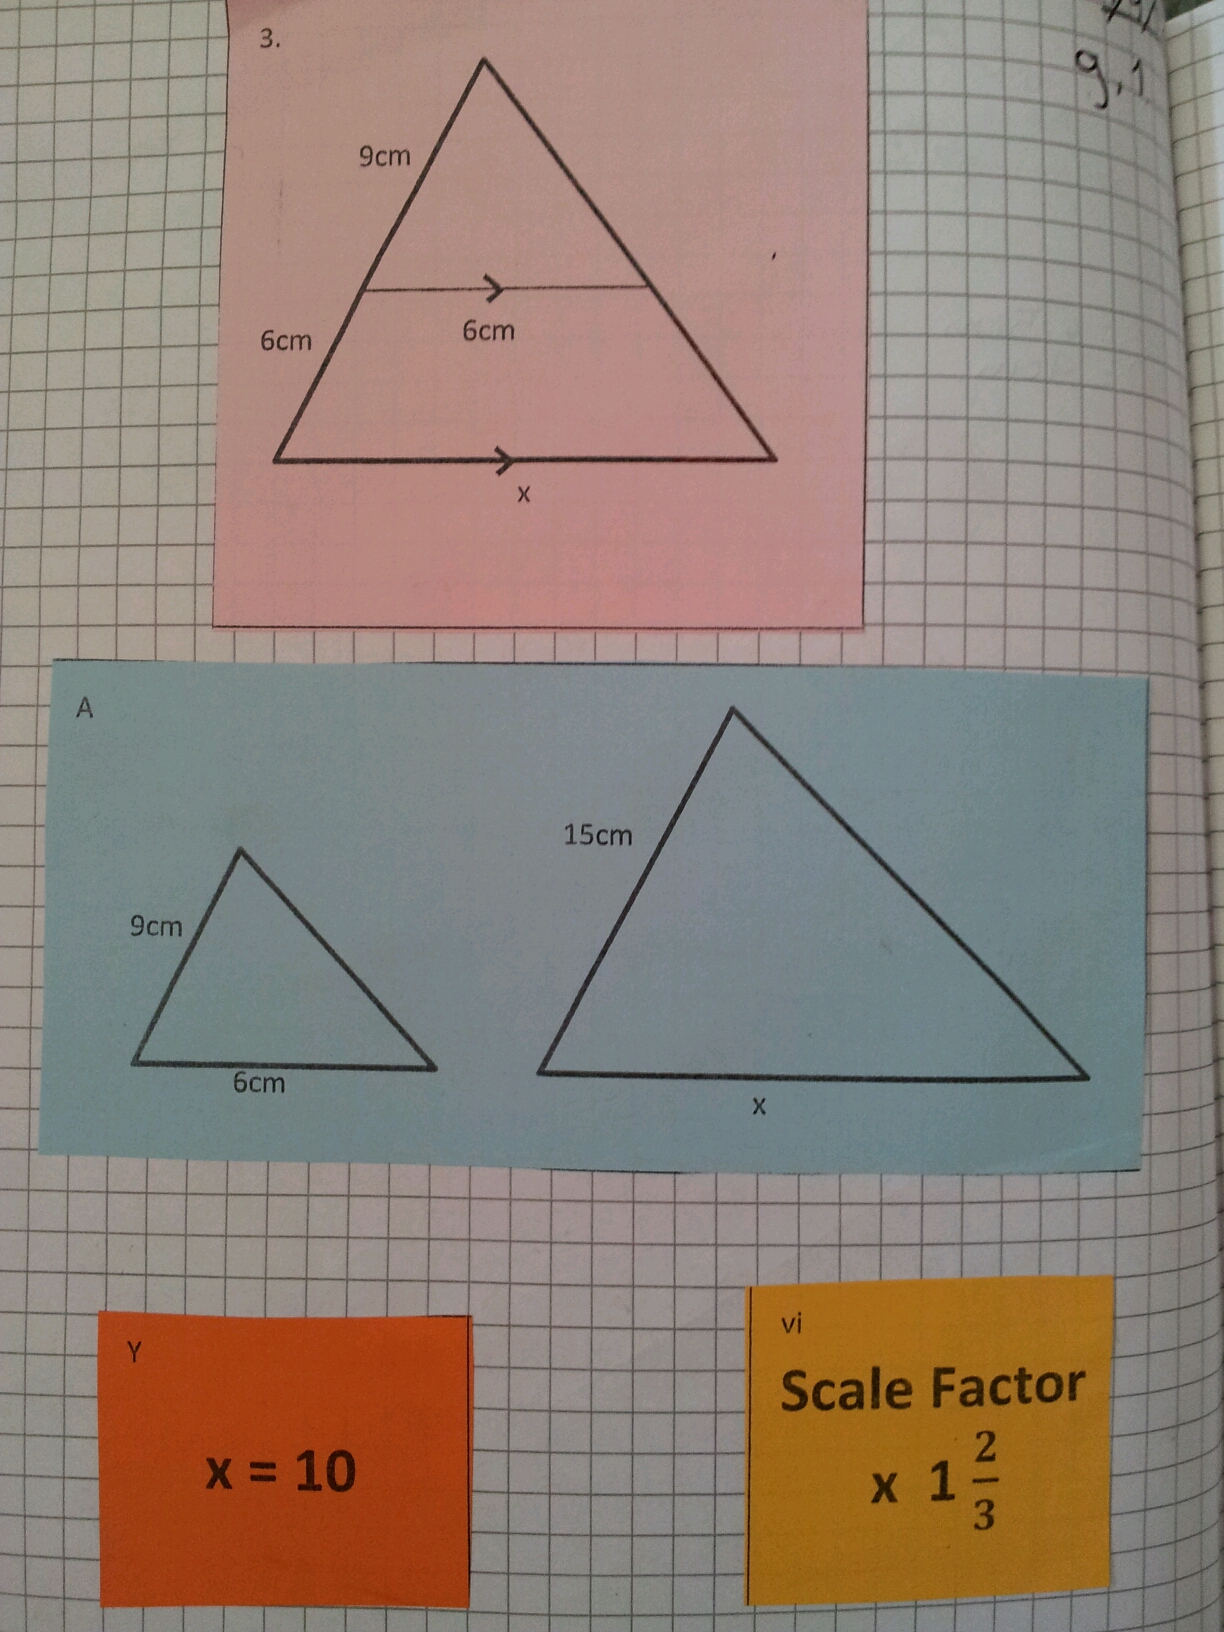
The cards start with a standard diagram of overlapping triangles and you match it up with the individual triangles. The final step is to work out the scale factor and the missing side. It follows the exact steps you would want students to follow when working on these problems.

Now, I know my class well and to avoid the standard bickering, mess and ‘I didn’t think you meant pick up every sheet when you said pick up every sheet’, I copied every set on a different colour:

image

The colour made it so much easier to manage and discuss. There are six problems, so if your students work in 2’s or 3’s, they each get 3 or 2 sets to stick in their book. The problems are full of misconceptions and interesting scale factors. I’m really glad I used it!

Thank you cturner16!

229. Speed Camera Maths

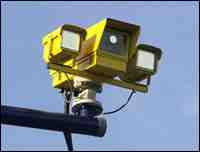
Speed Cameras are so last century: discerning law enforcement agencies favour the Average Speed Camera!
image

These motorway delights timestamp when you go through certain checkpoints and calculate your speed between them. No complicated laser guns required, just number plate recognition and a little distance/time calculation. This already sounds like a KS3/4 class activity or a Mechanics A-Level starter.

Equipment
Squared paper
Pencil
Ruler
Coloured pens
Calculator (optional)

Question
Can you find three different (safe) strategies for staying on the right side of the law through extended roadworks? You must average 40mph over 12 miles (original speed limit 60mph).

Visual Prompt
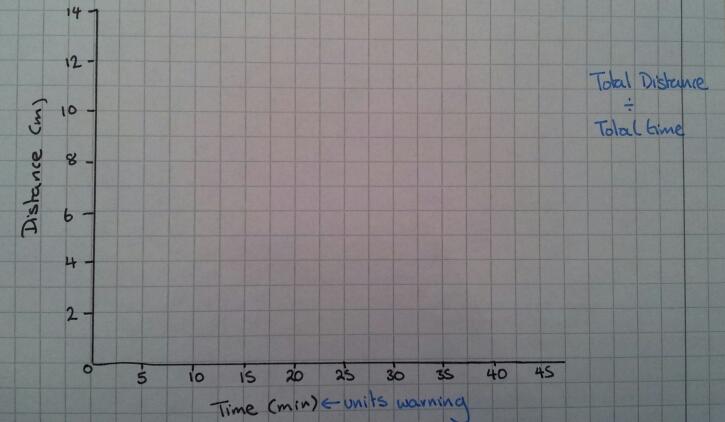
To start off with just draw out blank axes and discuss how you could visually represent this problem.

Idea 1
A distance-time graph
image

Idea 2
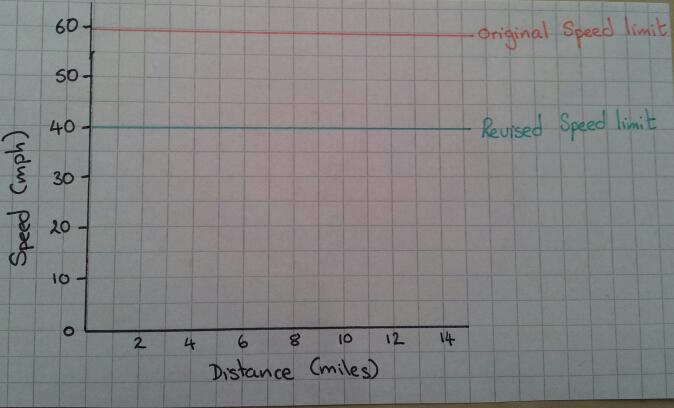
A speed-distance graph

image

Idea 3
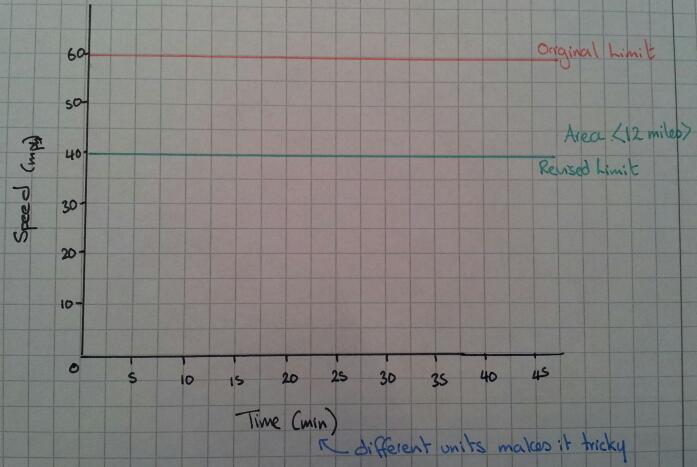
A speed-time graph

image

The straightforward option
How long should it take you to get through the roadworks if you stick to exactly 40mph? What does this look like on a graph? Which type of graph shows this information best?

Top Gear Alert
The boy racer wants to go fast, but avoid a ticket – what could he do?

Hint
What does ‘Average Speed’ actually mean?
Can you instantly jump between speeds?
Is acceleration going to effect your calculations?
What assumptions should you make about acceleration?
Do you need to work out the area under the graph or the gradient at all? How will you do this?
Can you describe what is going on?
Is it safe/legal?

Outcome
Your students should be able to produce many different graphs of how to stay on the right side of an average speed zone. They should be able discuss their findings with each other. However the morality or safety of their driving ideas may be a topic of discussion for a later PSE lesson …

228. Toblerone Tessellation

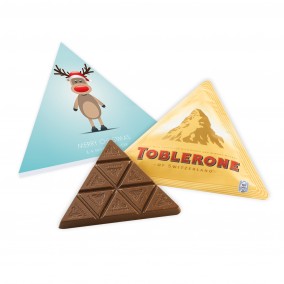
Christmas has come early to my local Co-Op. I was intrigued enough to buy and eat the new Christmas chocolate, but not before marvelling at the mathematical elegance of it’s structure:

image

Image credit: http://www.distinctiveconfectionery.com/personalised-christmas-triangular-toblerone-box.html

The slab of equilateral chocolate breaks up into 9 smaller equilateral triangles. Or you could tessellate more of the big triangle.

Break off the corners and you get a hexagon.

Break off one corner and you get a trapezium.

Two triangles together makes a parallelogram … or it a rhombus? Good discussion point there!

The bar weighs 60g – how much does each triangle weigh? What about the weights of the other shapes you could make?

The dimensions are listed as 180x180x10mm. Where would these measurements fit on the triangle? Is it the length, width and height? Why? Can you calculate the dimensions of the other possible shapes?

Once you start thinking about it, there are lots of activities you could do … and there is the potential to eat your work! As usual, if you are going to do this, make sure you are aware of food allegeries.