Monthly Archives: September 2015

281. Mathsconf5 resources

Hi to all those who went to Mathsconf5, in Sheffield.

If you liked the proportion snapdragon you can download it here: Proportion Snapdragon

If you liked the trigonometry snapdragon you can download it here: Snapdragon download

There are instructions for it here: Trigonometry Snapdragon

If you’d like a snapdragon template or instructions on how to fold it click here: http://mathssandpit.co.uk/blog/?p=667

If you want more foldables after the Paper Maths session, run by the lovely @MsSteel_Maths, I can recommend this resource: Foldables by Dinah Zike

(Note: this pdf is widely available and a version of it is free to download from Dinah Zike’s website, however if you represent Ms Zike and there is a copyright issue please contact me in the comments below)

280. BIDMAS & chips – a second helping

Back in post 231, I discussed using a Fish & Chip shop to introduce BIDMAS. I’ve since taught this topic again and written a resource to go with it:

BIDMAS & chips

There are three different menus – if you hand them out correctly no two pupils should have the same menu. Pupils write their names on the front and fold the menu in half so that they can see the price list.

If you go through the activity in post 231, pupils can use their menus to work out totals without copying from each other. You can then get the pupils to gather into the three different shop groups and argue out the misconceptions.

I used this on my first lesson this year with a shared Year 7 class, in front of five PGCE students and it worked a treat!

279. Old GCSE vs new GCSE in English: a Rough Guide

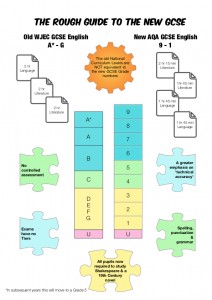
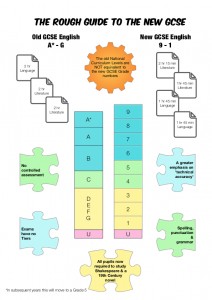
My previous infographic blog post comparing the old and new GCSE Maths was rather popular. I had requests for an English version, but I’m no English teacher. However, I’ve worked with Mr S (an English teacher at my school) to create this infographic:

English WJEC AQA infographic

This infographic specifically works for the change from WJEC to AQA English. There is also a general version of it, should it be of use for other exam boards. Download the pdfs below or click on the images for the jpegs.

English WJEC AQA infographic

English infographic

English infographic

278. Rough Guide to GCSE Maths (new syllabus vs old syllabus)

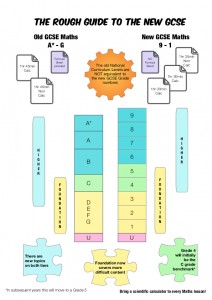
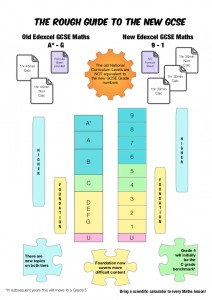
I mentioned on Twitter that I’d made an infographic for students to help explain the changes to the GCSE Maths curriculum. Several people expressed an interest in it, so here it is:

GCSE infographic general

There are two versions – one which specifies Edexcel and one which does not specify an exam board. We use Edexcel, but the general version would work for other boards..

I must stress that these are rough guides and are not endorsed by any exam board – I created them to help my students understand the big picture. I printed them A5 size to fit in exercise books and A4 to go on the wall. A big thank you to Mrs D for proofreading/checking it.

You can download in pdf and jpeg format here:

GCSE Edexcel infographic

Update: I will be editing these files to clarify the Good Pass jigsaw piece. A good pass is a Grade 5, the Grade 4 refers to the funding rules for College/Year 12 resits

276. Desk Data Collection

We’ve all been there. When you do a data topic, it’s nice to use class data – it is easier to discuss/compare and generates irregularities. The tricky bit is collecting it in!

Write it in your book – how do you get everyone else’s?
Write it on paper? – someone has to process the paper
Type it in a classlist on a computer? – long queue for computer, computer out of action if teacher needs to use it
Use a voting system (Qwizdom/Socrative etc)? – good, but subject to user error
Go around the class and read it out? – someone won’t be listening!
Write it on the board? – someone won’t do it/ will put a daft number/ rub out someone else’s result

This was such a nice idea – real life data processed and interpreted by students. We need a quick, accurate data collection solution which ensures everyone contributes. All the ideas above have merit, but how to combine them?

Inspiration struck when I was trying to do this with a bubbly Y10 class – how could I tell if they all contributed to the data? How could I keep track of deliberately daft answers? How can you stop the general milling around and gossiping at the board as they descend on it?

The desks!

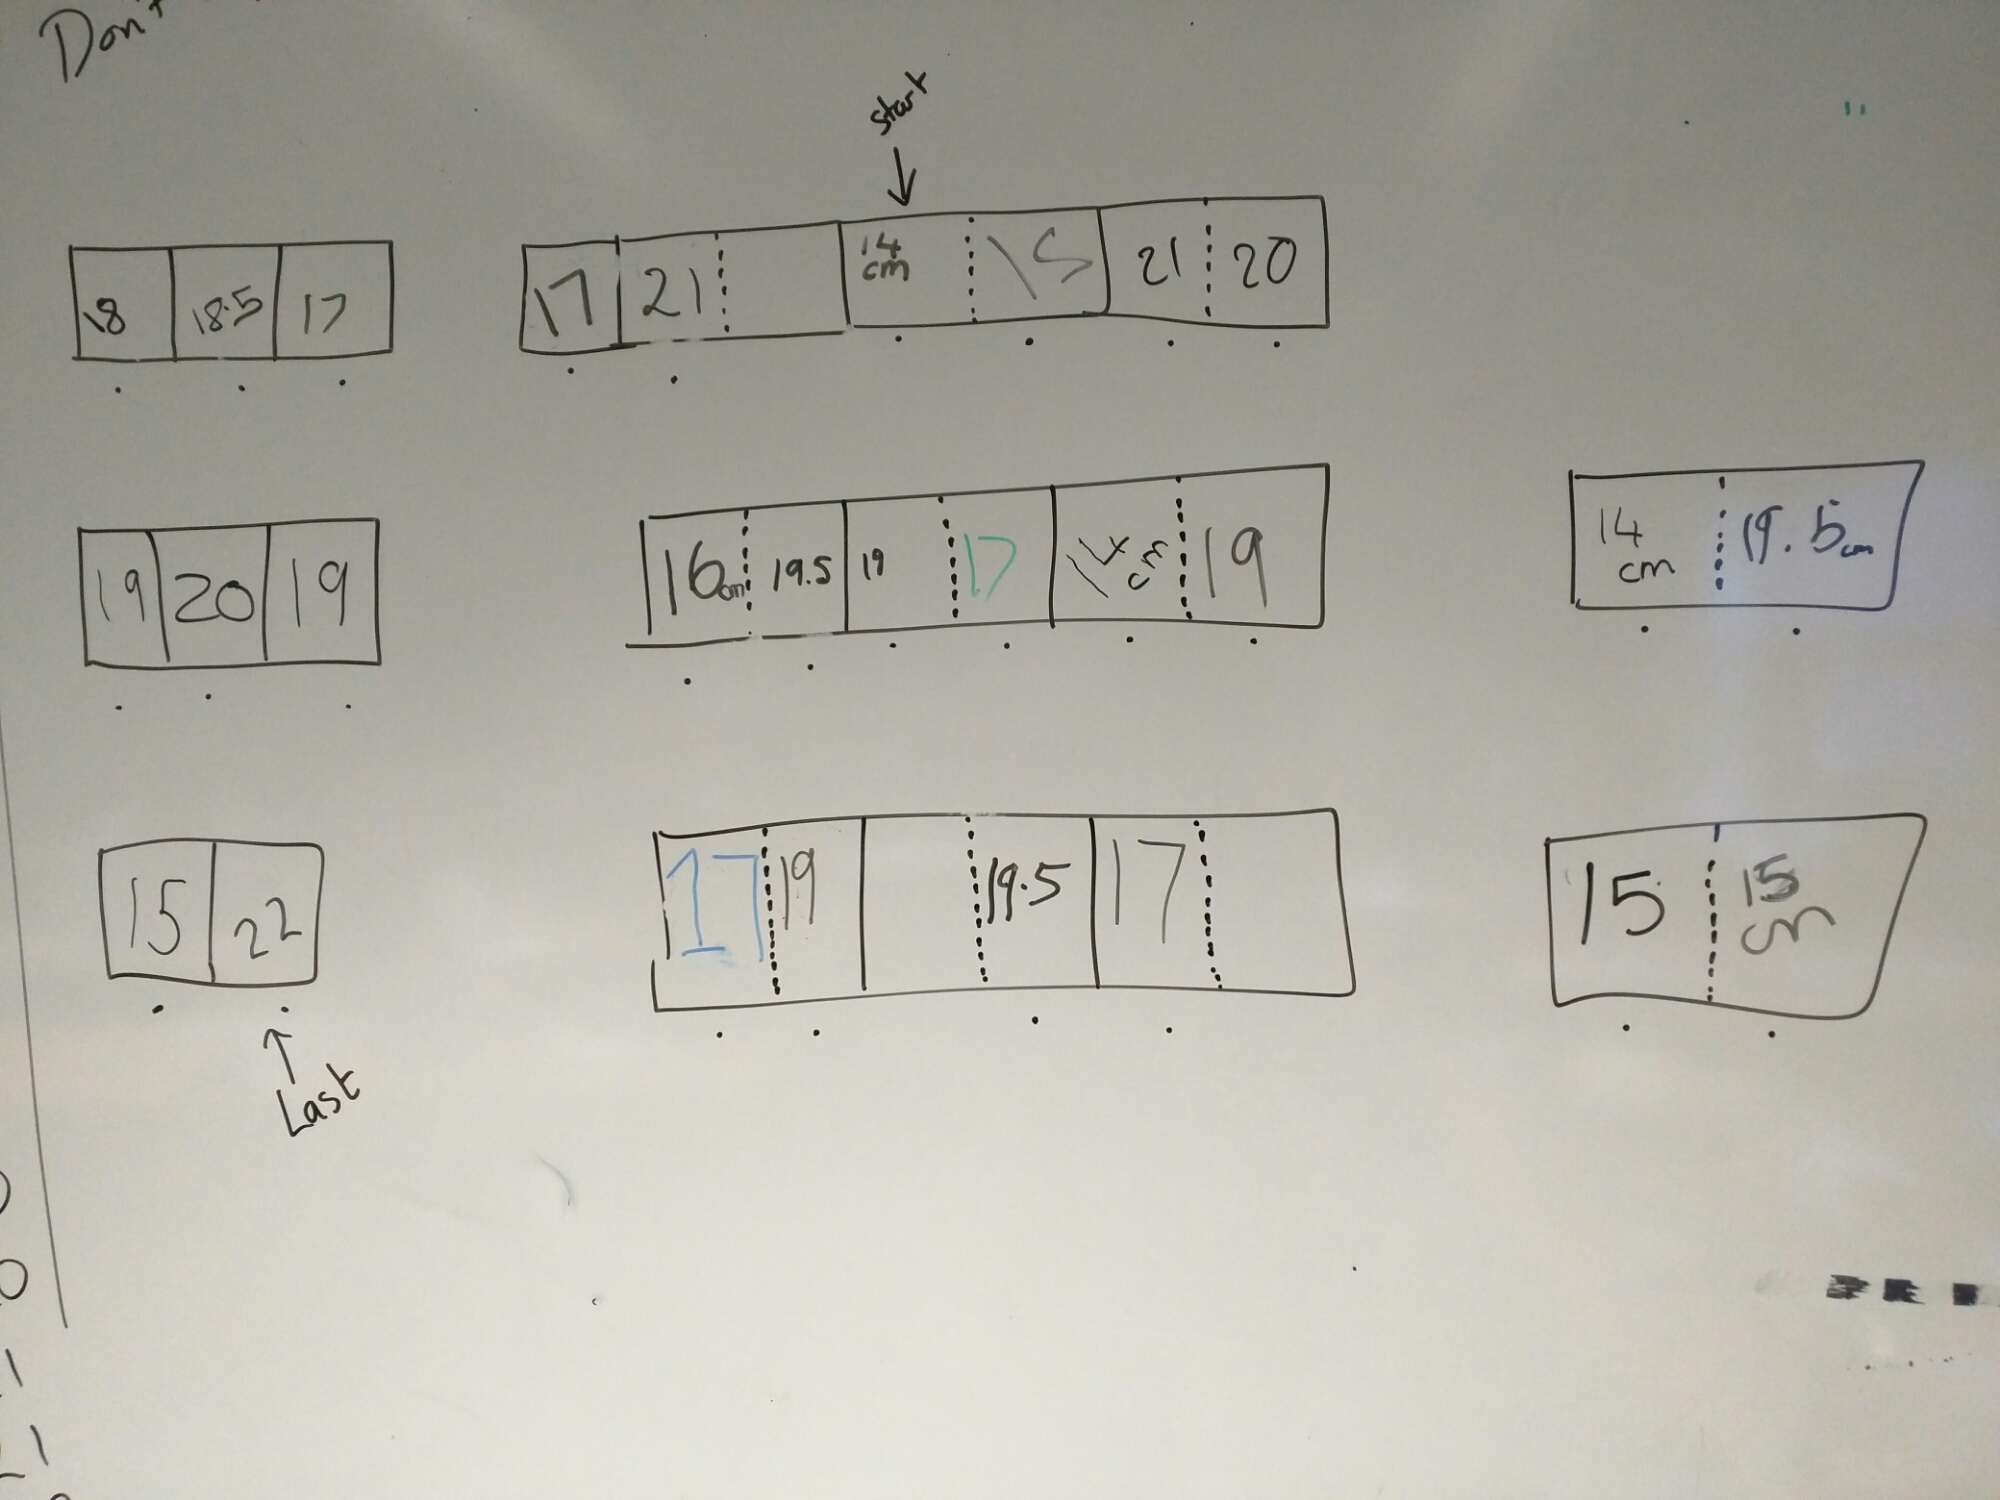
While your class is measuring, sketch out your desk plan on the board. Students write their result in their desk space.

(You can see below that we collected hand span data. The start and finish indicated the smallest and largest widths for listing the numbers in order.)
image

You can keep track of who is finished, without having to stand at the front checking who has contributed. Once the desks are full, you are done. The data collection is structured and you have time to set up the next task.

No fancy technology or processes required!