Tag Archives: investigation

357. It’s not square!

I do love a little challenge for A-level Further Maths students. They are often confident and very capable mathematicians, but occasionally overlook the small details. This challenge looks into which strategies students use when working with 3D vectors, lines and angles.

The most annoying thing? There is no single correct answer.

What is the investigation?

Students start with two points, create a line, construct two perpendicular lines and then join up the lines – did they create a square? How do you know? Justify it?

Download the instructions here: It’s not square (docx), It’s not square (PDF)

Skills required

  • Distance between two points
  • Equation of a line in three dimensions
  • Scalar (dot) product

Solution/Discussion point

  • Students need to use the same direction vector for both perpendicular lines too create a square
  • The two new corners need to be n the same direction away from the original line (not one above and one below)
  • It’s interesting to discuss what non-squares they made. Technology could be used to plot them in 3D.

352. Functions refresher

We recently finished teaching the AS Maths syllabus to Year 12. My colleague and I decided how to split up the start of the second year of the course. I’m starting with the modulus function.

I took one look at the skills needed at thought “Uh-oh”. The students are going to be out of practice with this. They are a lovely group, with a wide range of ability, but we’ve been very focussed on Applied Maths recently.

Option A: Go for it and patch up the vocabulary as we go (getting very frustrated – they knew this last October)

Option B: Break them in gently, recap the skills and vocabulary and extend them further

Option C: Reteach the work from last October.

Yes, you guessed it. I went with Option C. I found a brilliant task on piecewise function graphs on the Underground Maths website.

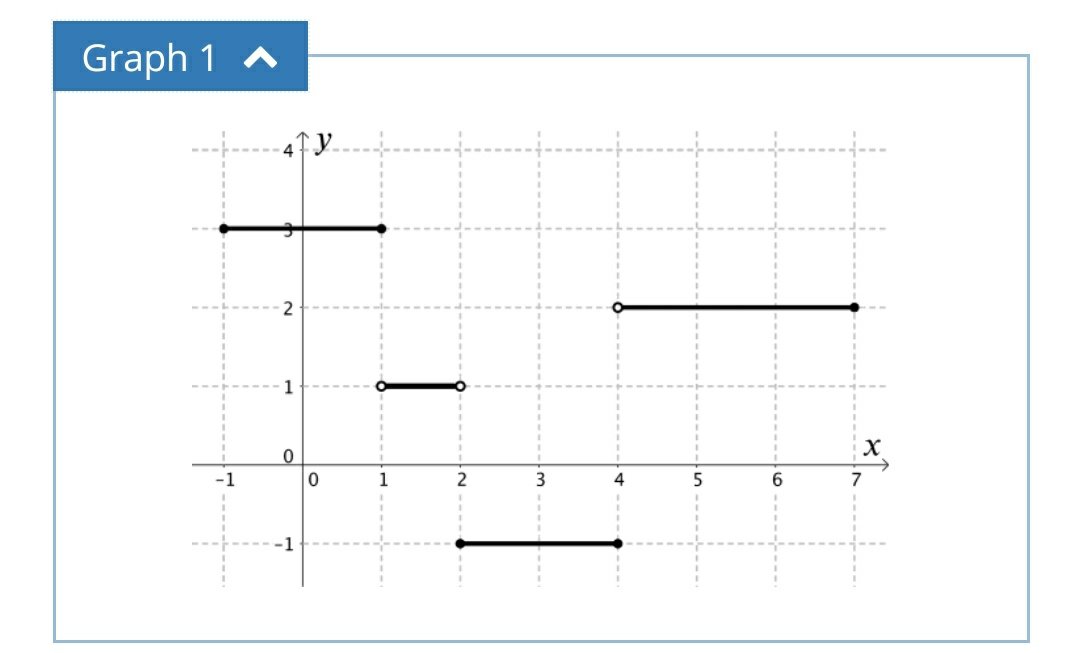
Image credit: https://undergroundmathematics.org/

There are four graphs given. The basic task is to interpret the functions relating to each graph, through description or function.

I photocopied the graphs onto card and sliced them up. Each group had a set of cards. One person described a graph and the others had to accurately draw it. Some students went straight onto squared paper, others drafted it out on mini whiteboards. They repeated this until all the graphs were drawn and everyone had had a go at describing (the describer stuck in their card, so that they had a complete set). Whilst they were doing this, I moved around and encouraged the use of mathematical vocabulary.

Note: it was interesting to see how many students had forgotten the significance of open and shaded circles to denote boundaries of inequalities.

The second task was to match up the function cards with the graphs. Once again, accuracy was key as not all graphs had functions and not all functions had graphs. There were also some that nearly, but not quite matched. This activity really brought out the key skills relating to domain, range and function notation that I was looking for. The extension task was to complete the missing pairs.

But, did it work? I can confirm that the following lesson the class made very good progress investing the modulus function and it’s graph, even going as far to solve equations. They knew what the notation meant, how to plot it and how to interpret the graphs.

I really like the Underground Maths website as it has great resources, good support material and always makes students think. Most of the time it gets teachers thinking too!

349. Circumcircle Investigation

The A-level textbook we use has a nice picture of the circumcircle of a triangle and a definition, plus a brief description of how to work through them. For those who are pondering what a circumcircle is, click on the image or link below

Image credit: WolframMathWorld

I’ll just stick to basic vocabulary in this post, rather than the formal circumcentre and circumradius.

Back to the book – not exactly inspiring or memorable stuff!

I looked at the class and off the cuff changed the lesson plan.

Equipment

  • Plain paper
  • Pencil
  • Ruler
  • Compasses
  • Calculator

Step 1

Draw a decent size triangle on the paper. Label the corners A,B,C.

Step 2

Using geometrical constructions, find the centre of the circle that your triangle fits in. Check by actually drawing the circle

Step 3

Discuss what techniques gave the best results – hopefully you’ll have perpendicular bisectors. There is a nice comparison between bisecting the angles (which some students will do) and bisecting the sides. The angle bisectors always cross inside the triangle, the side bisectors don’t.

Step 4

Randomly generate co-ordinates for A, B, & C. Get the students to pick them and then they can’t moan if the calculations are awful.

Step 5

Discuss how you are going to find the centre and radius of the circumcircle. We decided on:

  • Only use two sides
  • Find the midpoints
  • Find the gradients and hence perpendicular gradients
  • Generate the equations of the lines through the midpoint
  • Find where they intersect
  • Use the point and one corner to find the radius

Step 6

Review their methods, looking for premature rounding in questions. I’m still instilling an appreciation for the accuracy of fractions and surds, over reaching for the calculator.

Step 7

This is how my solution looked – I numbered the picture and the steps so students could follow the logic. I was answering on one page projected on screen.


328. Slice of genius

So, I was doing my usual Human Piechart  activity when an interesting point occurred. I had the class split into a group of 20 and a group of 18 (I had a student in charge of each group so that the circles would be factors of 360). I asked the class how we could combine the groups to make a whole class pie chart. One student suggested we add together the angles and divide by two. Several other students agreed that it was a good idea.

There goes my lesson plan.

I put this prediction on the board and asked them to prove it or disprove it using hard facts. I was very impressed by the different techniques they used. Most students started by adding the angles and dividing by two, then:

  • They went to the raw data and calculated the actual answers, disproving the prediction.
  • Some looked at the angles on the ‘combined’ pie chart and worked out the number of degrees per person for each angle. They used the irregularities in angles to disprove the prediction.
  • Looking at how many degrees there were per person and using logical deduction that you cannot add the angles.
  • Others noticed that categories with the same number of people had different sized angles.

All this before they’d answered a single pie chart question! The moral of this story is: don’t ignore the wrong suggestions, embrace them and use student knowledge to dispel the myths.

293. Boxing Bounds

I thought this would make a nice little starter – address a few different topics, bit of problem solving, all over in 15 minutes. How wrong I was!

The Question: A company packs toys into boxes which measure 12cm by 8cm by 10cm (to the nearest centimetre). The boxes are packed into crates which measure 1m by 0.75m by 0.8m (to the nearest centimetre).
(a) Basic question – How many boxes fit into the crate?
(b) What is the maximum volume of a toy box?
(c) What is the minimum volume of the crate?
(d) Look at your answers to (b) and (c) – do they affect your answer to (a)?

It was a simple question about fitting toy boxes into a shipping crate. It extended to looking at upper and lower bounds, then recalculating given this extra information. Simple? No chance!

Problem One
Not changing to the same units

Problem Two
Working out the two volumes and dividing to find the number of toys. When challenged on this, it took a while to get through to the basics of how many toys actually fit – mangled toys and split up boxes don’t sell well.

Problem Three
Maximising the arrangement of boxes – remainders mean empty space

Problem Four
Using the information from Problem Three to find the total number of toys

Problem Five
Working out the dimensions and volume of the empty space in the box

Problem Six
Trying to convert centimetres cubed into metres cubed. I don’t even know why they wanted too!

Problem Seven/Eight
What’s an upper/lower bound?

Problem Nine
What do you mean that the original answer changes when the box size alters?

Problem Ten
All those who weren’t paying attention when you went over Problem Two and don’t ‘get’ why the answer isn’t 625!

284. All tied up – an adventure in skewness

When you move from 2D vector equations to 3D vector equations the biggest challenge is skewness. On plain old 2D graphs if two lines aren’t parallel, they intersect and vice versa. Not so easy in three dimensions … how to explain skewness? Got some string and duct tape? Then let me explain …

Equipment
String
Scissors
Duct tape
A low ceiling
A chair/stepladder/tall student

Step 1
Tape a piece of string from the ceiling to the floor at an angle. Attach a second piece to the ceiling and ask students to position it so it is parallel with the first string. This isn’t as easy as it seems once they realise it must look correct from every angle. Secure the string to the floor with duct tape.

Step 2
Attach a third piece of string to the ceiling. Instruct students to position it so it intersects one of the strings. Secure the end.

Step 3
Attach a fourth piece of string to the wall. Ask them to position it so that it is not parallel to or intersecting any existing string.

(My ingenious bunch took the string out of the door and fastened it to the bannister, just in time for management to thankfully not be garroted)

Step 4
Give the students a fifth string and instruct students to make it parallel to an earlier string and intersect the fourth string. They choose both end points.

If all goes well, you’ll get something like this:

image

You can then explain the differences between parallel, intersecting and skew lines without resorting to iffy diagrams on a whiteboard or complicated geometry software. Students can walk through them and really get a feel for the geometry of the situation.

(When it comes to taking it down, I hope your students are slightly more sane than mine – one of them shouted ‘Argh, it’s a spider web’ and ran through it. Actually quite an efficient way to tidy up!)

Resources
You can download five large print 3D vectors here:
3d vector cards (pdf)
3d vector cards (docx)
The challenge is to find the parallel lines (3 lines), the skew lines and the intersecting lines (2 pairs).

There are more ideas on 3D vector equations here:
211. Hidden Rectangle Problem

259. Squashed Tomatoes

If you taught in England while mathematical coursework still existed, this post may not be new to you. However those who did not may be pleasantly surprised by the simple complexity of ‘Squashed Tomatoes’!

Aim
To investigate a growth pattern, which follows a simple rule.

Equipment

  • Squared paper
  • Coloured pens/pencils
  • Ruler & pencil

Rules
Imagine a warehouse full of crates of tomatoes. One crate in the middle goes rotten. After an hour it infects the neighbouring crates which share one whole crate side. This second generation of rot infects all boxes which share exactly one side. Once a box is rotten it can only infect for an hour, then ceases to affect others. This sounds complicated, but trust me … it’s simple!

Picture Rules

The first box goes rotten – colour in one square to represent the crate. The noughts represent the squares it will infect.

Tomato 1

The second set of crates becomes rotten – use a different colour. The noughts represent what will become rotten next:

tomato 2

The third set of crates becomes rotten – change colour again. At this point it is useful to tell students to keep track of how many crates go rotten after each hour and how many are rotten in total:

tomato 3

The fourth set of crates forms a square:

tomato 4The fifth hour returns the pattern to adding one to each corner:

tomato 5

The sixth hour adds three onto each corner:

tomato 6

Now you can continue this pattern on for as big as your paper is. Students can investigate the rate of growth of rot or the pattern of rot per hour. As the pattern grows, the counting can get tricky. This is when my students started spotting shortcuts. They counted how many new squares were added onto each ‘arm’ and multiplied by number of ‘arms’.


Here are some examples of my students work:

image

This is a lovely part-completed diagram:
image

This piece of work includes a table of calculations – you can see the pattern of 1s, 4s and multiples of 12.
image

This is just amazing – you can see that alternate squares are coloured (except for the centre arms).
image

On this large scale you can see the fractal nature of this investigation.

Extension: Does this work for other types of paper? Isometric? Hexagonal?