Category Archives: Mechanics

363. A-level Exam misconceptions 2022

It’s been a while, but I’m back. Crazy times and all that!

Today I’m sharing a presentation about my thoughts on the Edexcel A-Level Maths papers, from the perspective of reviewing students papers. As a KS5 Co-ordinator I am asked by students to look at borderline papers before they send them off for a paper review.

The mark schemes were very clear on where marks should (or should not) be awarded. This presentation (or set of posters) highlights the most common student errors I spotted during my reviews. I would also say that these are most frustrating issues as they are so easy to fix. Unfortunately it highlights the lack of formal external exam experience this cohort had, through no fault of their own.

These resources are geared towards the Edexcel papers, but I’m sure the skills are equally appropriate for other boards. Also a hat-tip to Jack Brown & TLMaths as I have linked one of the misconception slides to his video on hidden quadratic equations (thank you!).

Exam misconceptions 2022 (PPT editable)

Exam misconceptions 2022 (PDF)

Personally, I’m going to print these out and put them in my A-level display corner. I might use the actual presentation after the Y13 mocks to see if they’ve fallen for the same issues. I hope not!

340. SUVAT dilemma

If you’ve been a regular reader of this blog you may remember a post in 2014 advocating the use Duck Tape to help with practical investigations. The post was: http://mathssandpit.co.uk/blog/?p=1585

I’ve recently reused the mechanics activity with a new class of Year 12 students. They had only just started mechanics and were familiar with models and suvat equations. We timed four different objects being dropped, under gravity, down a stairwell. The items had a variety of masses: a paper helicopter, a light plastic ball, a small sponge and a dense juggling ball. We meticulously timed each drop and double checked the height.

I asked the students to work out the velocity of each object on impact with the ground. It was akin to lighting the blue touch paper and standing back …

They are a competitive bunch and raced ahead to use the correct suvat equations to calculate the velocity. Then the fireworks started!

Part of the class insisted that the juggling ball must have the highest velocity. Part of the class insisted the velocities were the same for all of the objects. The rest were catching up and wondering what all the discussion was about. I innocently gathered their ideas on the board and asked them what was going on. Those who had used initial velocity, time & distance to find the final velocity had differing answers for each object. Those who had used initial velocity, distance and acceleration had a consistent answer.

Suddenly a hand shot up and said “Because we model objects as particles, their mass doesn’t matter so we can’t use the times”. This was followed by assorted groans from the class – especially those who’d used the individual times of the objects.

The variation of the original activity was to emphasise prior learning on setting up mathematical models for solving mechanics problems. Objective achieved!

(Obviously later in the course we’ll look at the impact of mass on mechanical models, but this was early days)

229. Speed Camera Maths

Speed Cameras are so last century: discerning law enforcement agencies favour the Average Speed Camera!

image

These motorway delights timestamp when you go through certain checkpoints and calculate your speed between them. No complicated laser guns required, just number plate recognition and a little distance/time calculation. This already sounds like a KS3/4 class activity or a Mechanics A-Level starter.

Equipment
Squared paper
Pencil
Ruler
Coloured pens
Calculator (optional)

Question
Can you find three different (safe) strategies for staying on the right side of the law through extended roadworks? You must average 40mph over 12 miles (original speed limit 60mph).

Visual Prompt
To start off with just draw out blank axes and discuss how you could visually represent this problem.

Idea 1
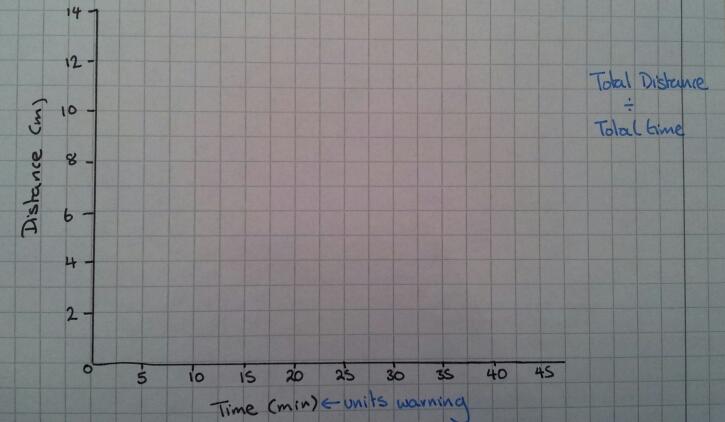
A distance-time graph

image

Idea 2
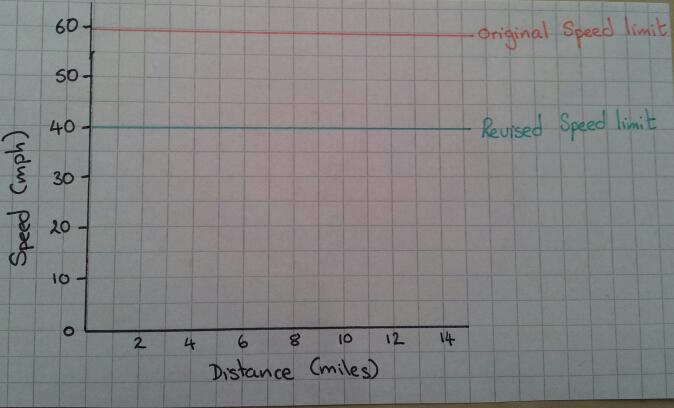
A speed-distance graph

image

Idea 3
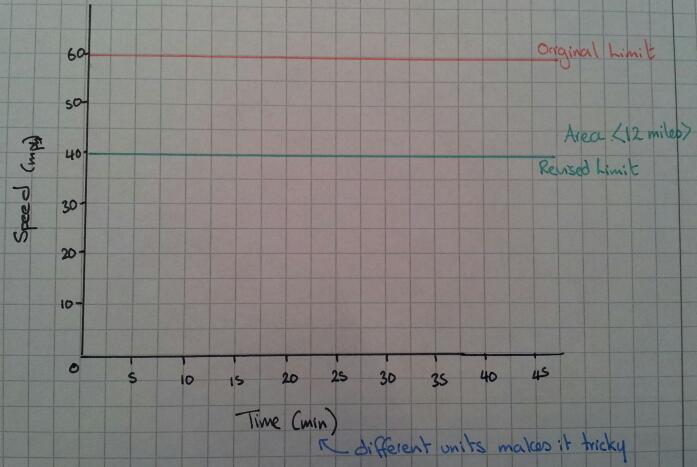
A speed-time graph

image

The straightforward option
How long should it take you to get through the roadworks if you stick to exactly 40mph? What does this look like on a graph? Which type of graph shows this information best?

Top Gear Alert
The boy racer wants to go fast, but avoid a ticket – what could he do?

Hint
What does ‘Average Speed’ actually mean?
Can you instantly jump between speeds?
Is acceleration going to effect your calculations?
What assumptions should you make about acceleration?
Do you need to work out the area under the graph or the gradient at all? How will you do this?
Can you describe what is going on?
Is it safe/legal?

Outcome
Your students should be able to produce many different graphs of how to stay on the right side of an average speed zone. They should be able discuss their findings with each other. However the morality or safety of their driving ideas may be a topic of discussion for a later PSE lesson …

202. Curling your A-Level

Whilst watching the Winter Olympics it occurred to me that the sport of curling would be an excellent discussion starter for teaching the motion of particles, momentum & impulse.

  • The motion of the curling stone on ice relates to F=ma.
  • The moment the player pushes off the hack, whilst still pushing the stone relates to the motion of connected particles.
  • The collision of stones relates to momentum and impulse.
  • The action of the sweeper changes the friction.

On YouTube I discovered this physics video by NBC Learning. They have many videos explaining the Science of the Winter Olympics.

I  pulled my ideas together in this Prezi, which allows plenty of student discussion: the task is blank for your own resource as I used a textbook.

188. Ducks, chalk and gravity

So how did TeachMeet result in me standing in a supermarket one evening doing a price comparison of duct tape?

Let us go back in time to #mathsmeetnorthwest. Dave Usher did a brilliant presentation on ‘Big Maths’, including the use of gaffer (duct) tape in lessons. I thought this was a genius idea – sticky, sturdy and temporary. I didn’t get a chance to buy any at the weekend, so I ended up in the supermarket on a weeknight.

But what to buy?

Cheap own brand duct tape at £2.95 for 15m or branded ‘Duck’ tape at £3.95 for 25m?

I started school the next day with one idea on how to use it, which quickly developed into three..

Lesson 1: Averages

Equipment: Duct tape, liquid chalk marker

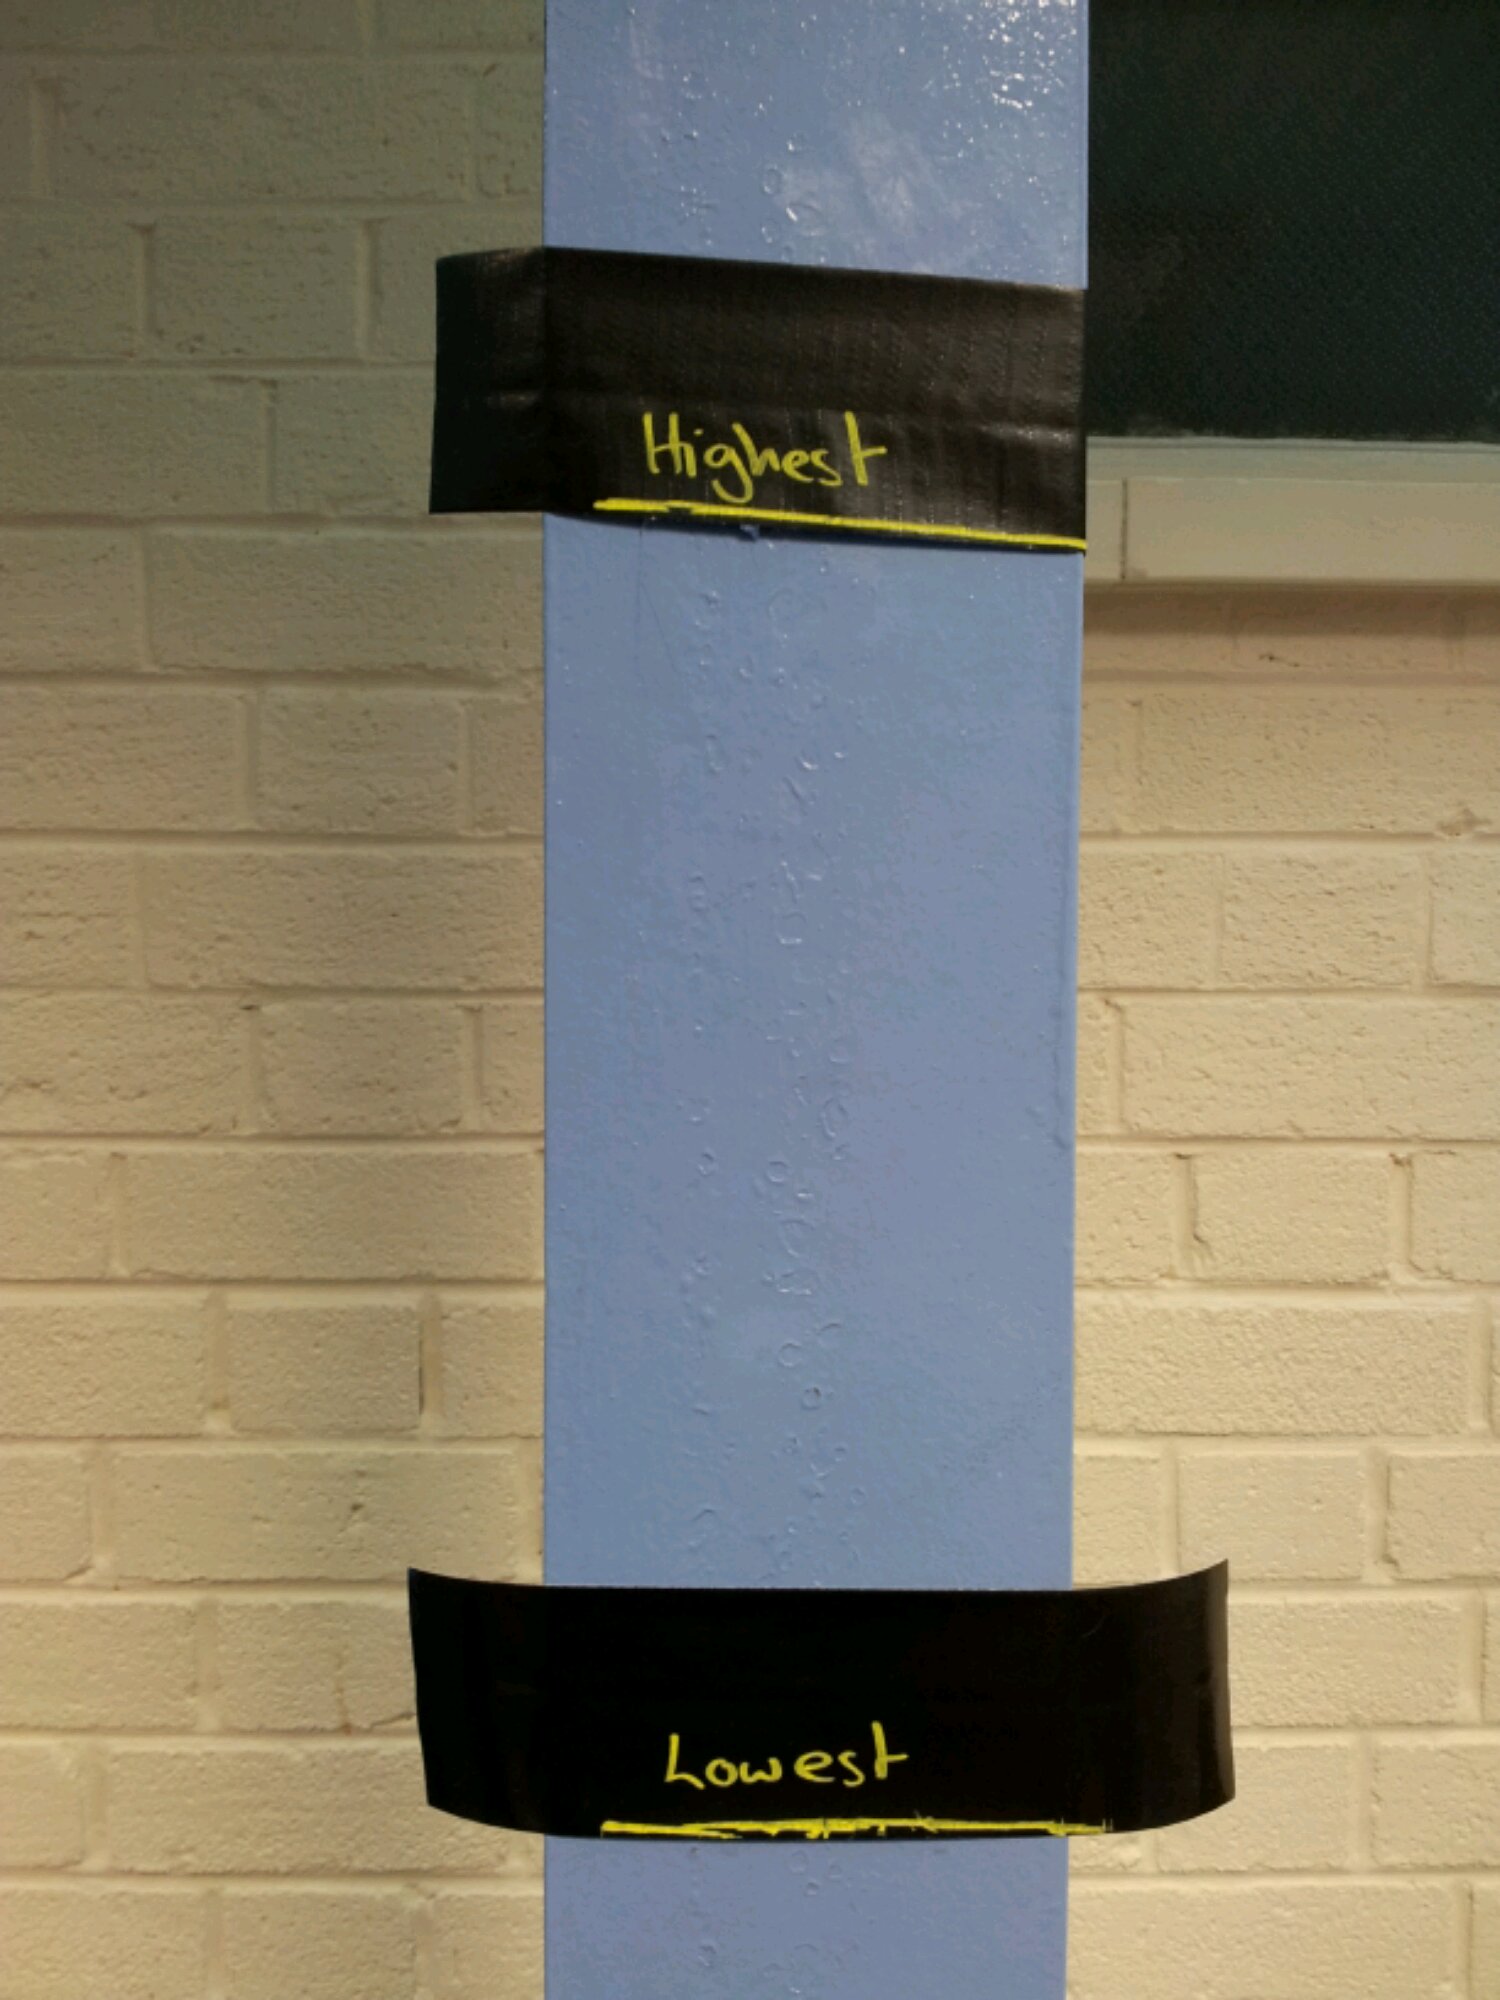
I did averages and range indoors. This meant I couldn’t chalk the walls or floor. However I could mark out key features with tape. I used the activity Averages and marked out the median, the highest and lowest values on the floor. It was at this point I figured out I could write on black duct tape with liquid chalk marker – brilliant! We labelled the wall with the highest and lowest heights of the class so we could see the actual range of heights.
image


Lesson 2: GCSE Revision

Equipment: Exam papers, scissors, glue, wall paper, duct tape

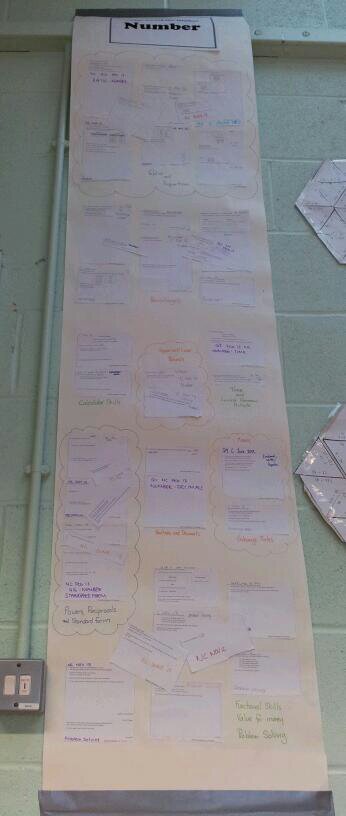
I have been using the Foundation GCSE Review with my Higher GCSE resit group. Reviewing ten Higher GCSE papers involves over 200 questions – that’s a big wall display! Both of the TeachMeets I have attended have used the idea of learning wallpaper. So that’s what we used – I’m grateful that some of my students are over 6ft tall or the wall display wouldn’t have gone up.
image

Now the duct tape was used to secure the top of the wall display and to ‘passer-by’ proof the bottom. It should last longer now that the lower end is reinforced.

image


Lesson 3: A-Level Mechanics

Equipment: Duct tape, liquid chalk, mobile phones, calculators, soft ball (I used a ball of wool)

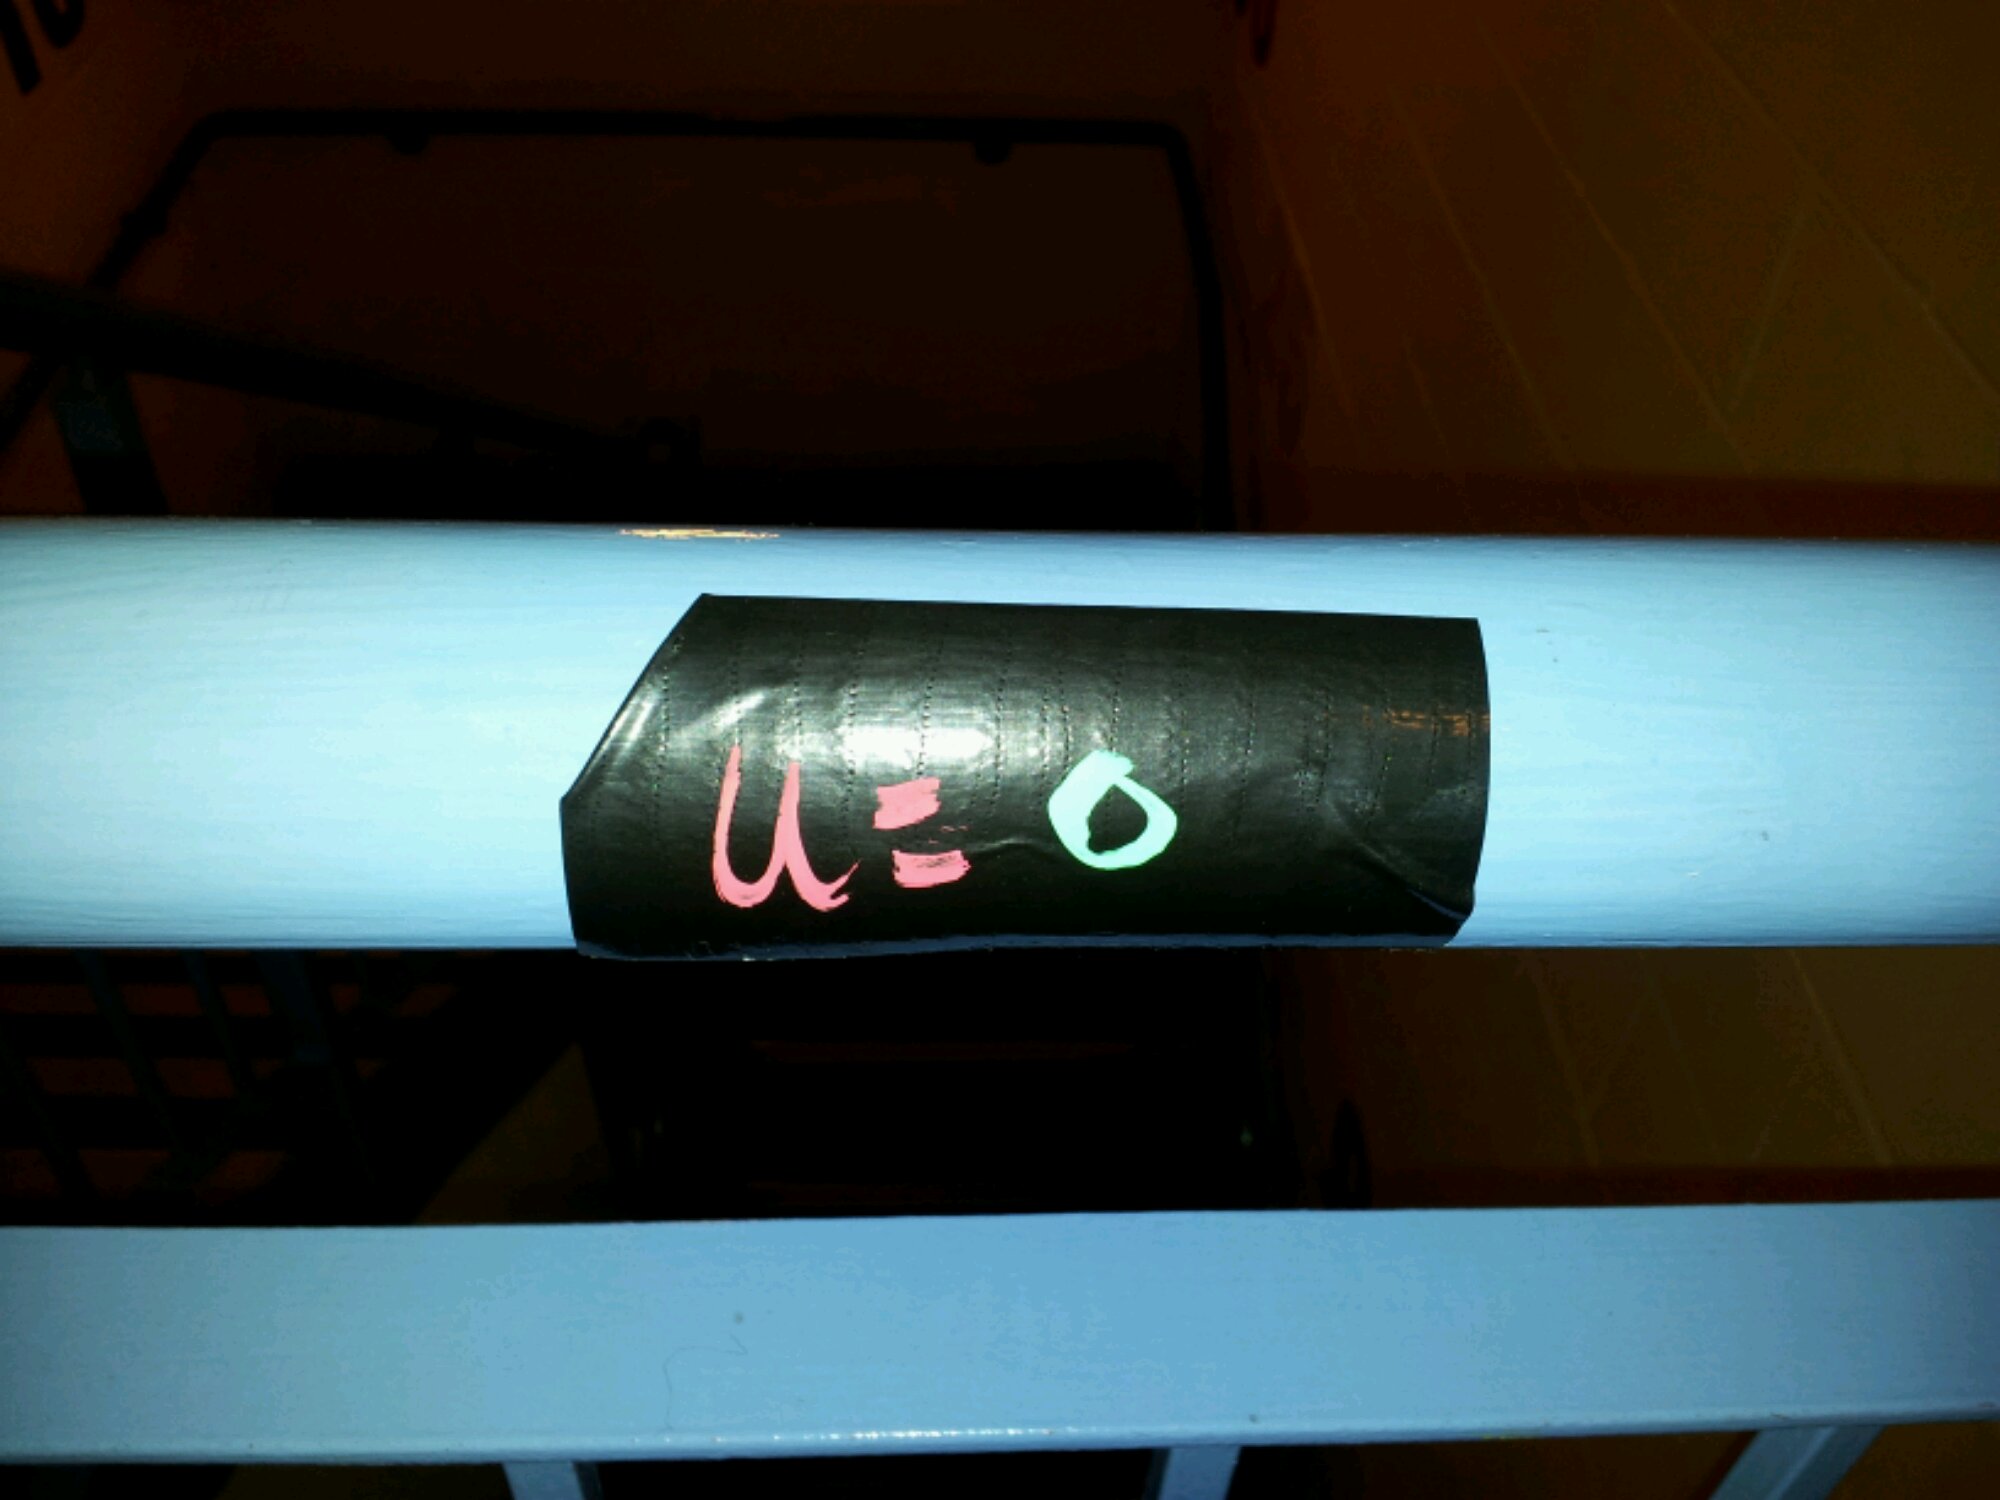
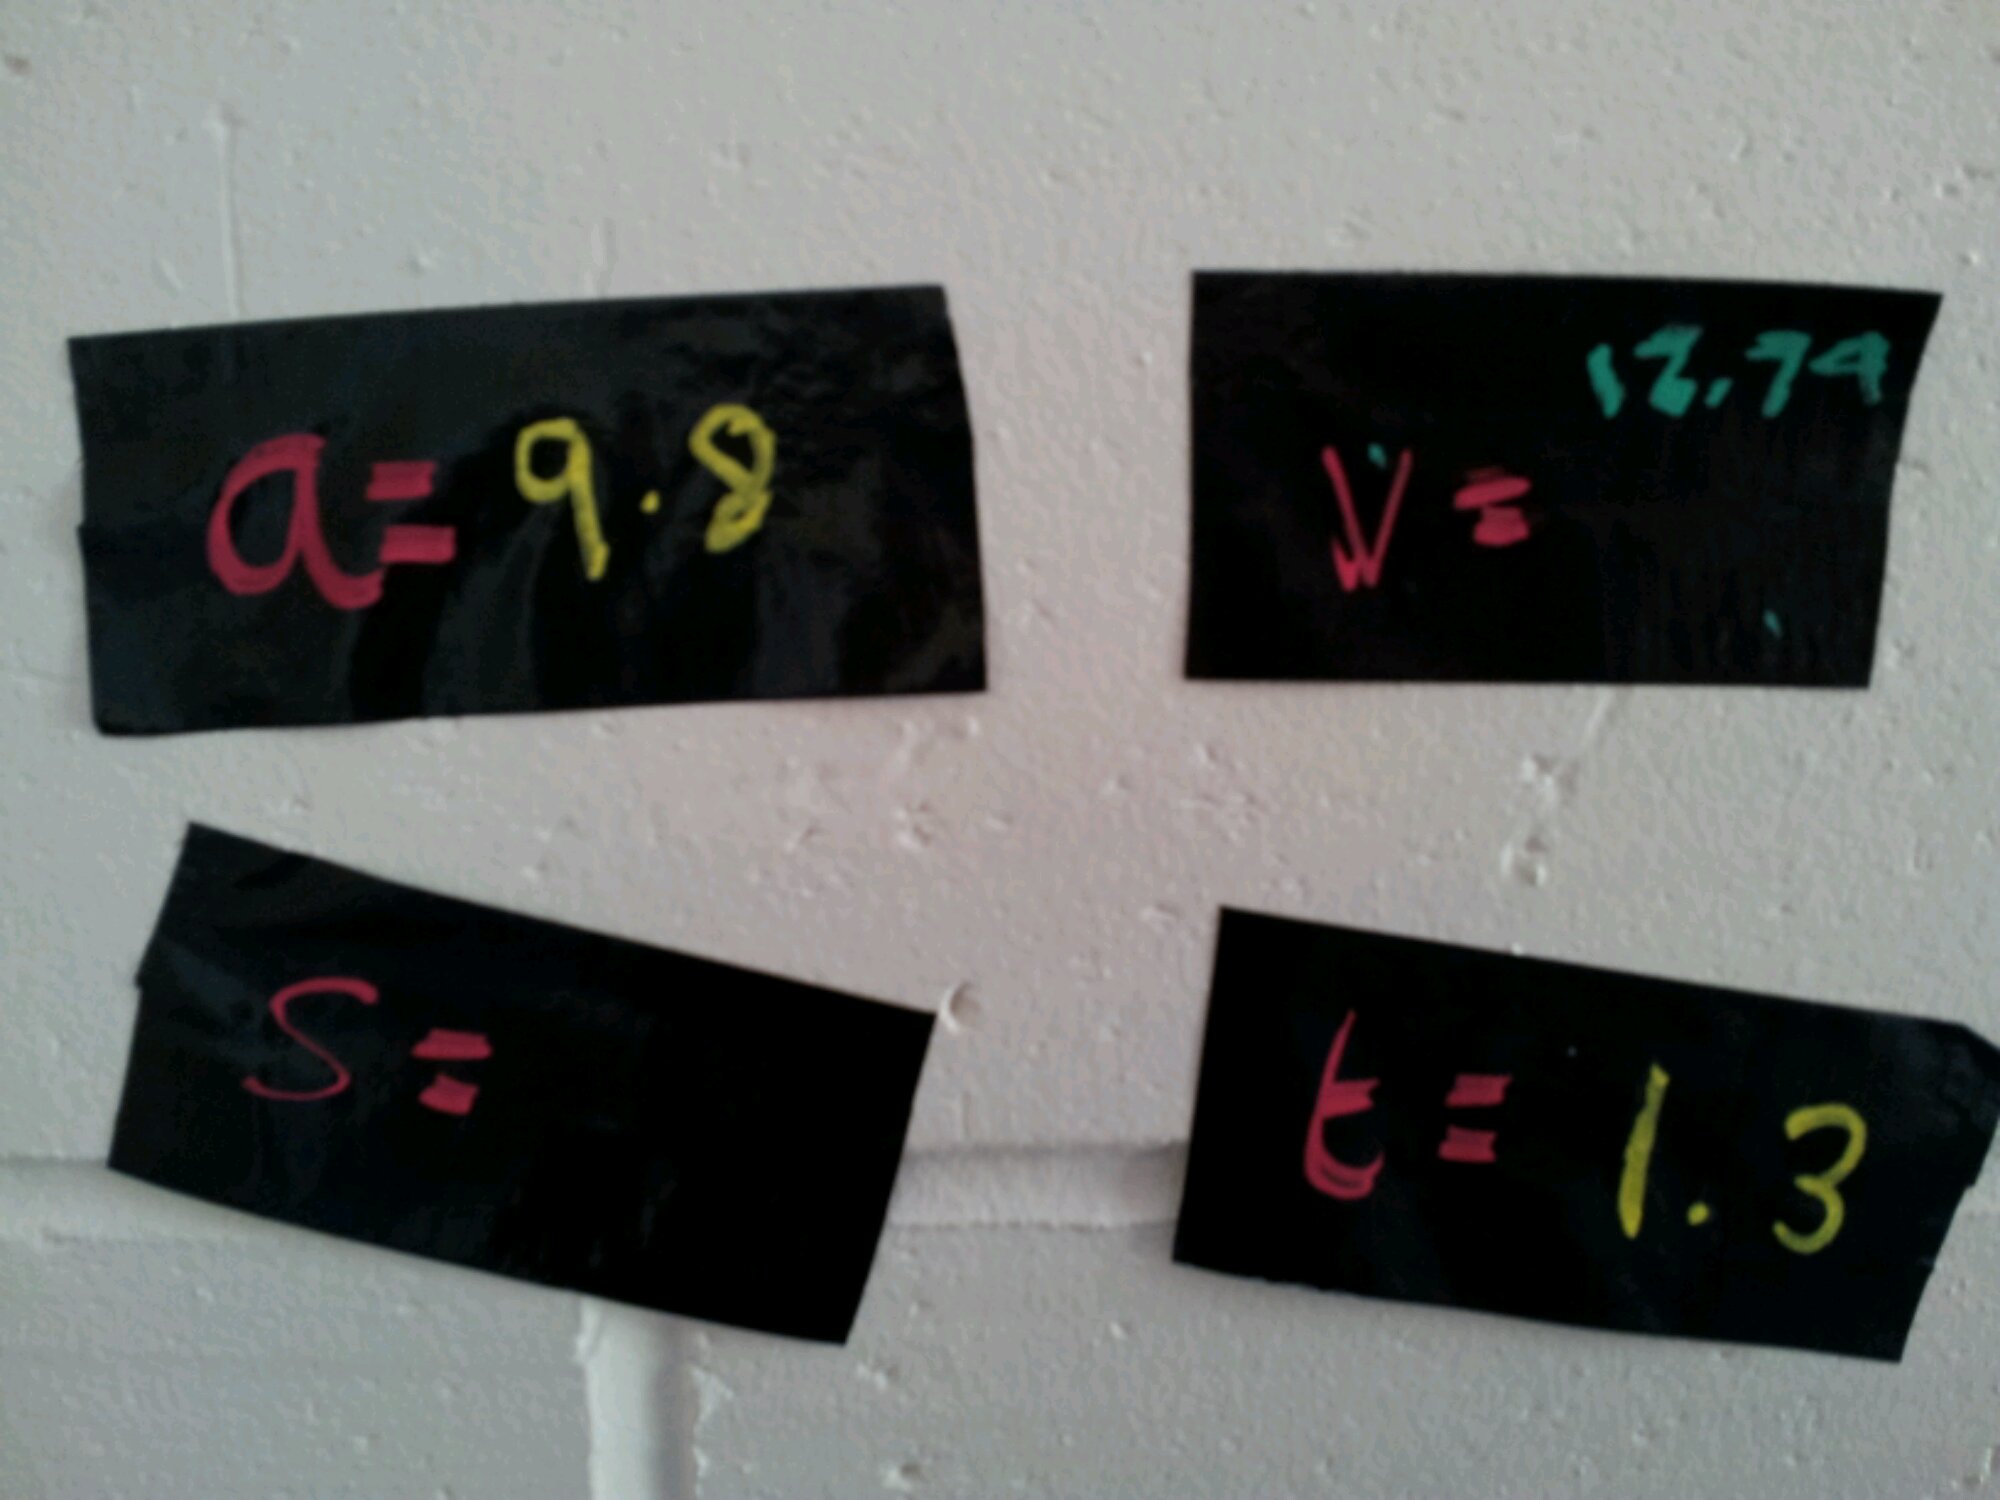
It’s all very well drawing diagrams for A-Level Mechanics questions, but how about a life size diagram? We were looking at vertical motion under freefall/gravity. I gave the students pieces of duct tape chalk labelled with a, s, u, v, t. We went to the staircase and labelled the wall with the tape – so u (initial velocity) was taped to the top of the bannister and v (final velocity) went on the floor at the bottom of the stairs, etc.
image

The students then labelled what they knew: a=g, u=0, v=?, t=?, s=?
image

The students used mobile phones to time the drop from the bannister to the floor and calculated the distance and final velocity. The physical activity allowed us to think about how to draw these kinds of diagram.

And finally …
Just some pictures of an alternative whiteboard:
image

image