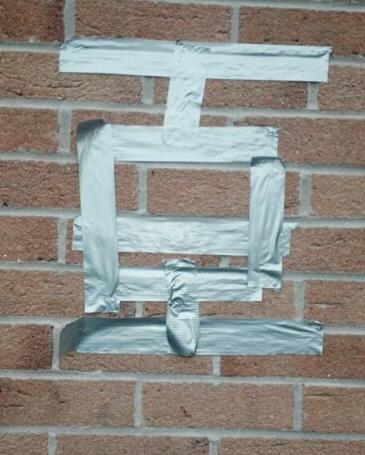
So how did TeachMeet result in me standing in a supermarket one evening doing a price comparison of duct tape?
Let us go back in time to #mathsmeetnorthwest. Dave Usher did a brilliant presentation on ‘Big Maths’, including the use of gaffer (duct) tape in lessons. I thought this was a genius idea – sticky, sturdy and temporary. I didn’t get a chance to buy any at the weekend, so I ended up in the supermarket on a weeknight.
But what to buy?
Cheap own brand duct tape at £2.95 for 15m or branded ‘Duck’ tape at £3.95 for 25m?
I started school the next day with one idea on how to use it, which quickly developed into three..
Lesson 1: Averages
Equipment: Duct tape, liquid chalk marker
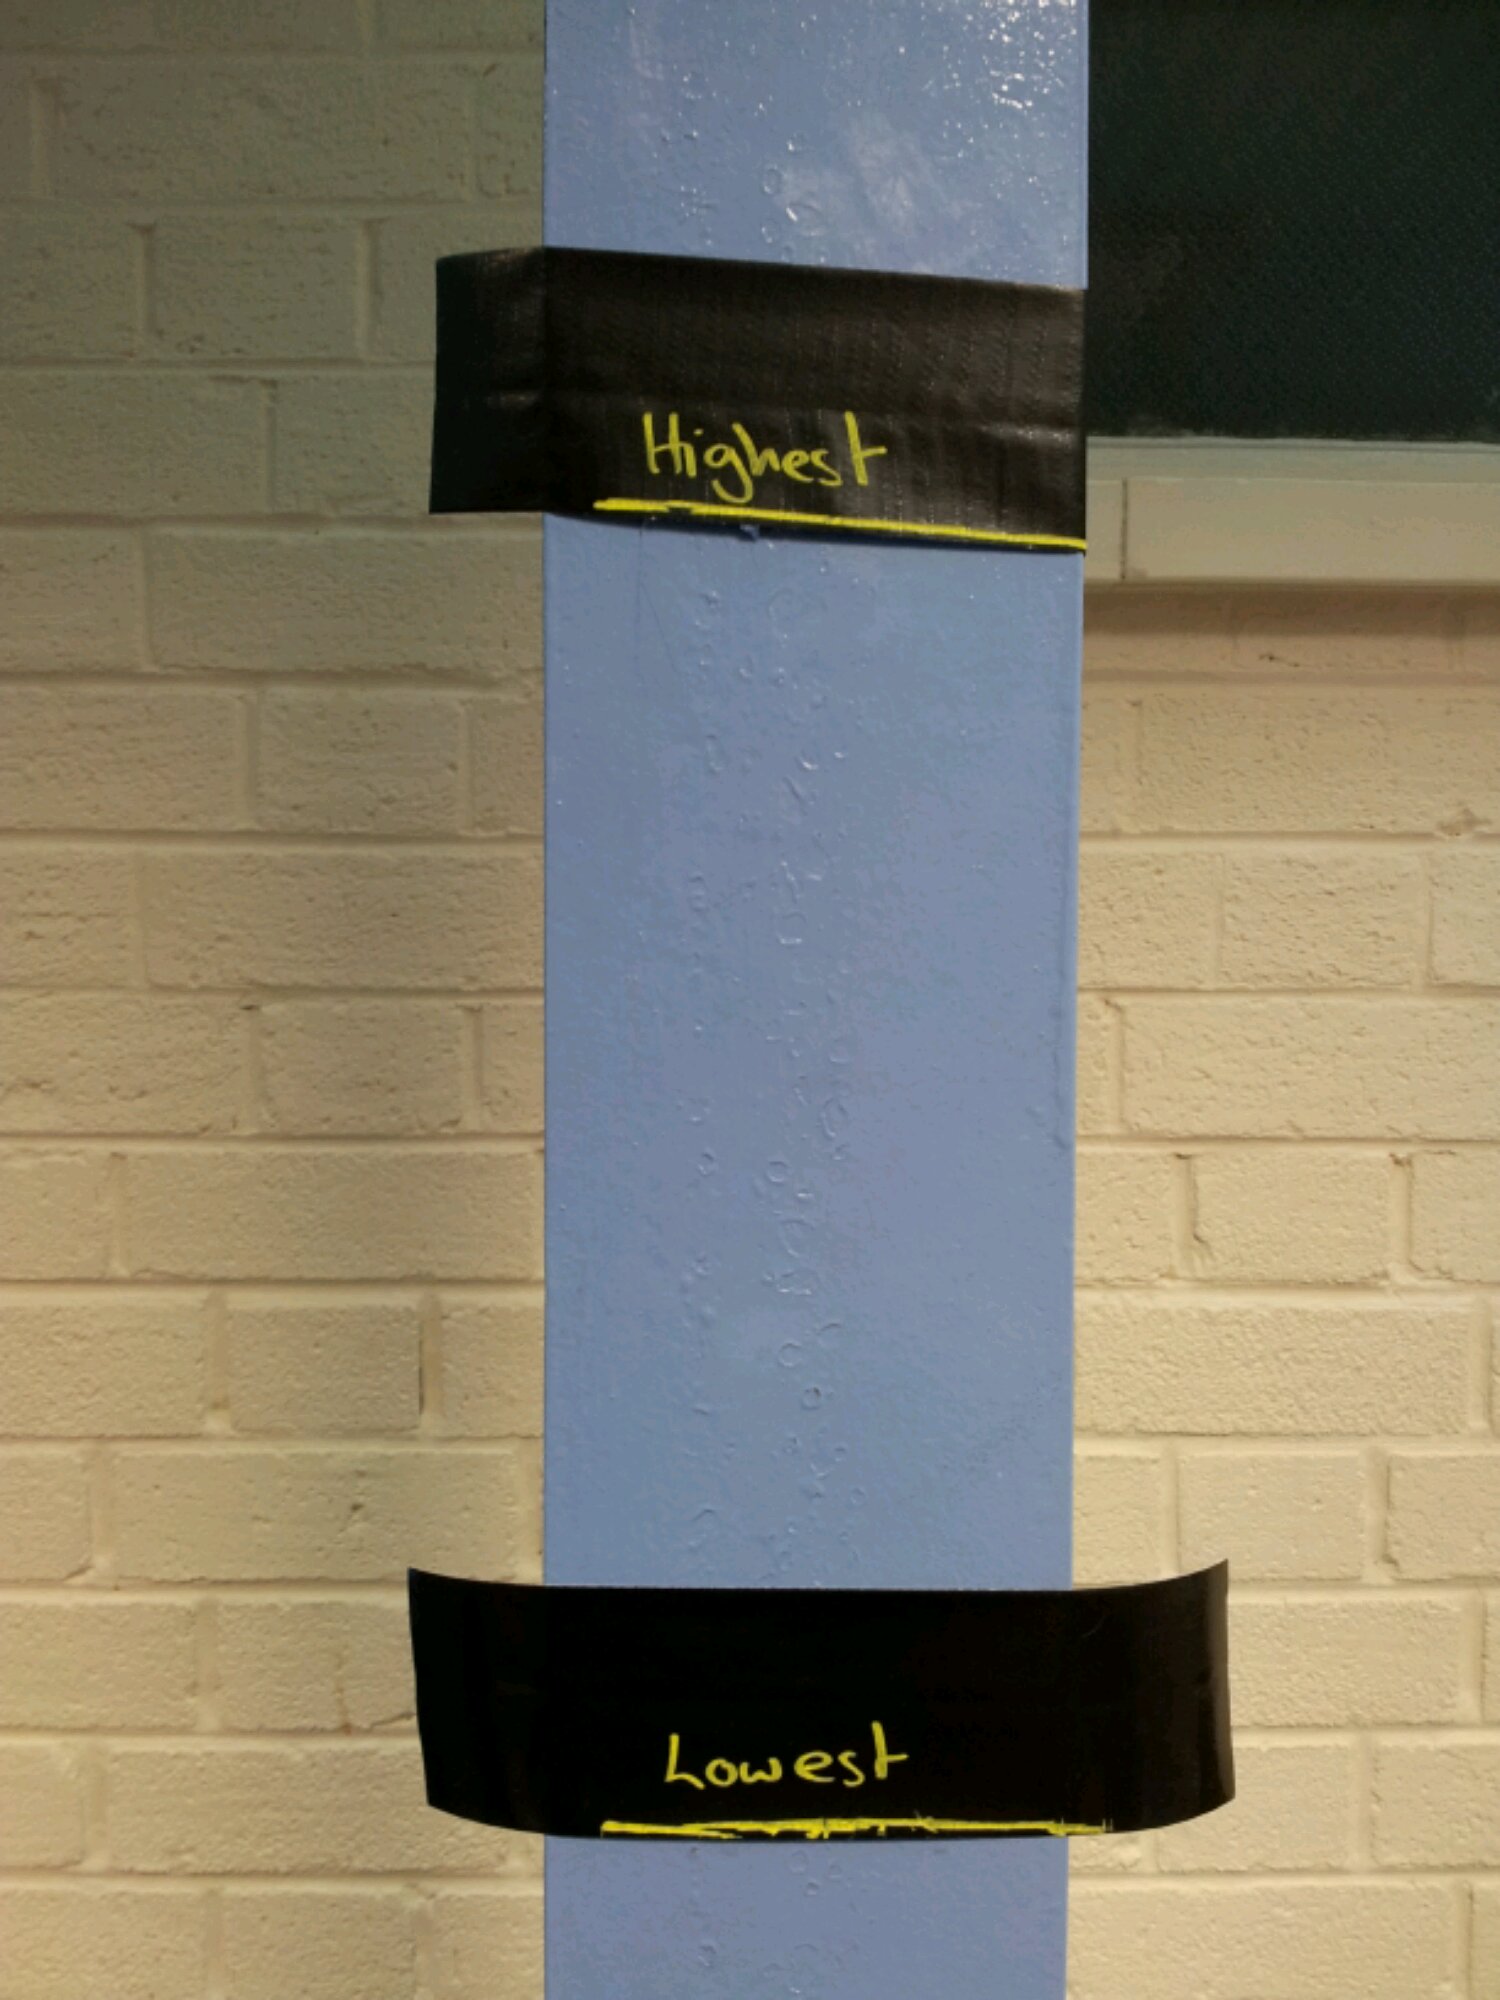
I did averages and range indoors. This meant I couldn’t chalk the walls or floor. However I could mark out key features with tape. I used the activity Averages and marked out the median, the highest and lowest values on the floor. It was at this point I figured out I could write on black duct tape with liquid chalk marker – brilliant! We labelled the wall with the highest and lowest heights of the class so we could see the actual range of heights.
Lesson 2: GCSE Revision
Equipment: Exam papers, scissors, glue, wall paper, duct tape
I have been using the Foundation GCSE Review with my Higher GCSE resit group. Reviewing ten Higher GCSE papers involves over 200 questions – that’s a big wall display! Both of the TeachMeets I have attended have used the idea of learning wallpaper. So that’s what we used – I’m grateful that some of my students are over 6ft tall or the wall display wouldn’t have gone up.
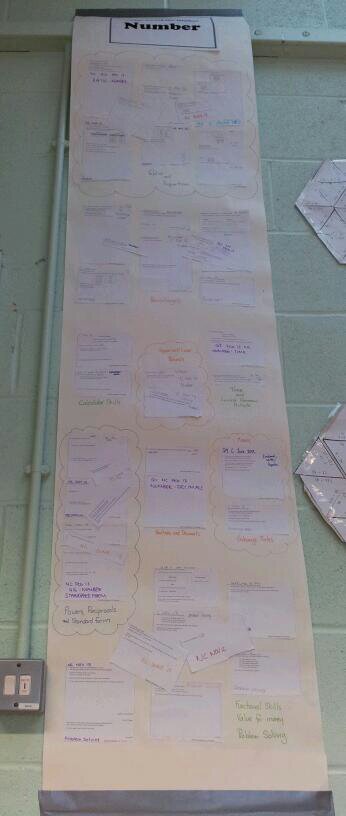
Now the duct tape was used to secure the top of the wall display and to ‘passer-by’ proof the bottom. It should last longer now that the lower end is reinforced.

Lesson 3: A-Level Mechanics
Equipment: Duct tape, liquid chalk, mobile phones, calculators, soft ball (I used a ball of wool)
It’s all very well drawing diagrams for A-Level Mechanics questions, but how about a life size diagram? We were looking at vertical motion under freefall/gravity. I gave the students pieces of duct tape chalk labelled with a, s, u, v, t. We went to the staircase and labelled the wall with the tape – so u (initial velocity) was taped to the top of the bannister and v (final velocity) went on the floor at the bottom of the stairs, etc.
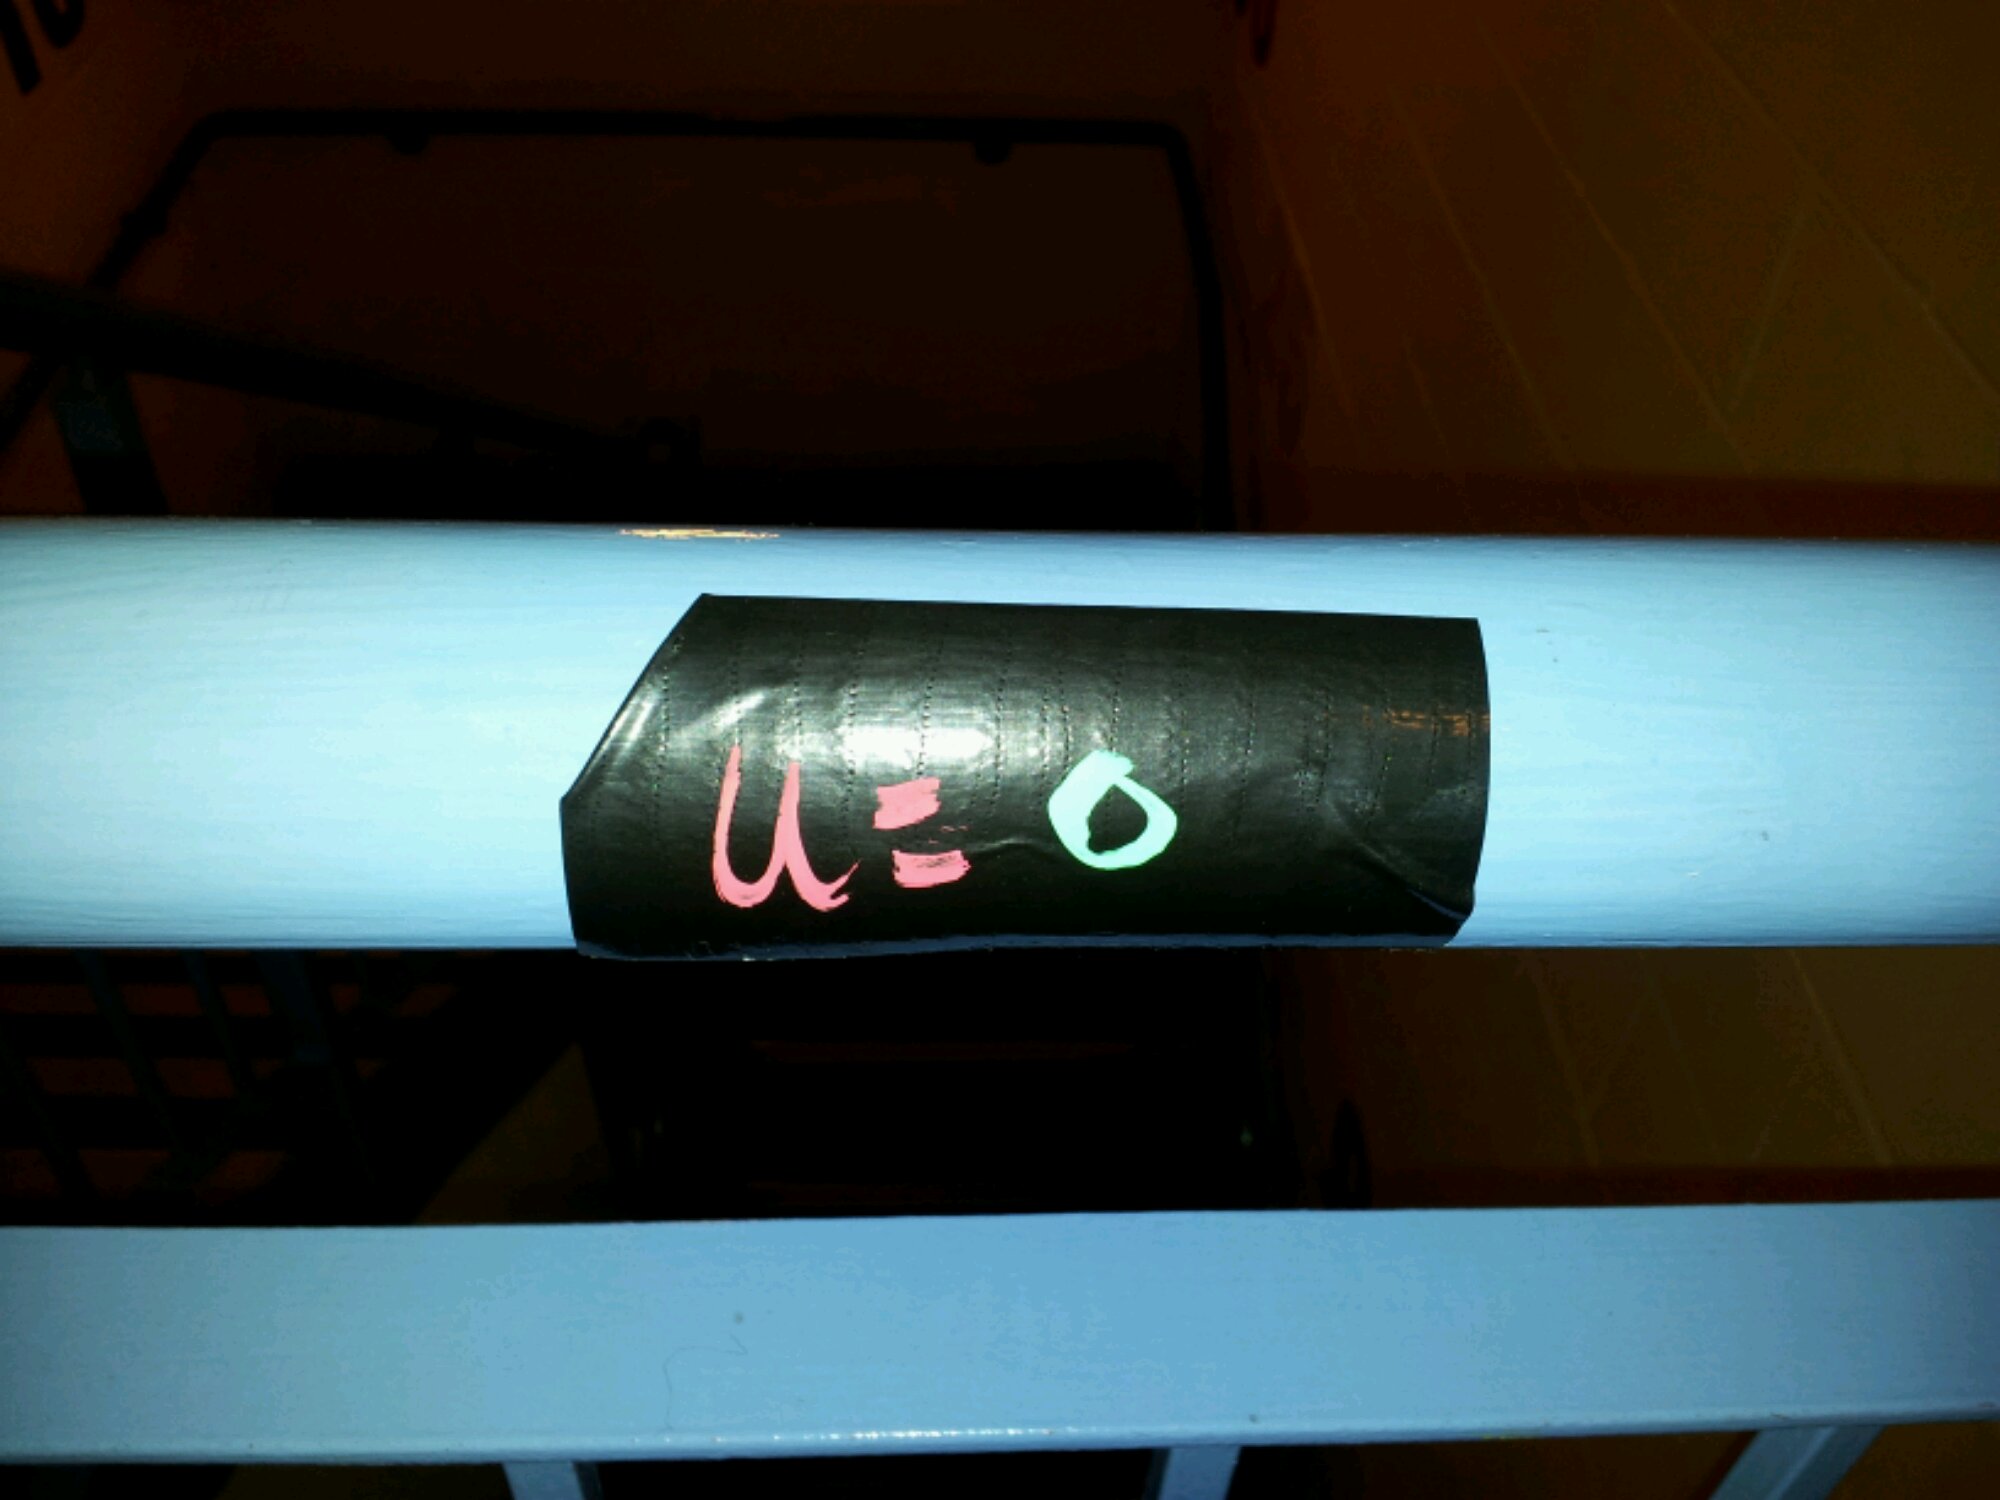
The students then labelled what they knew: a=g, u=0, v=?, t=?, s=?
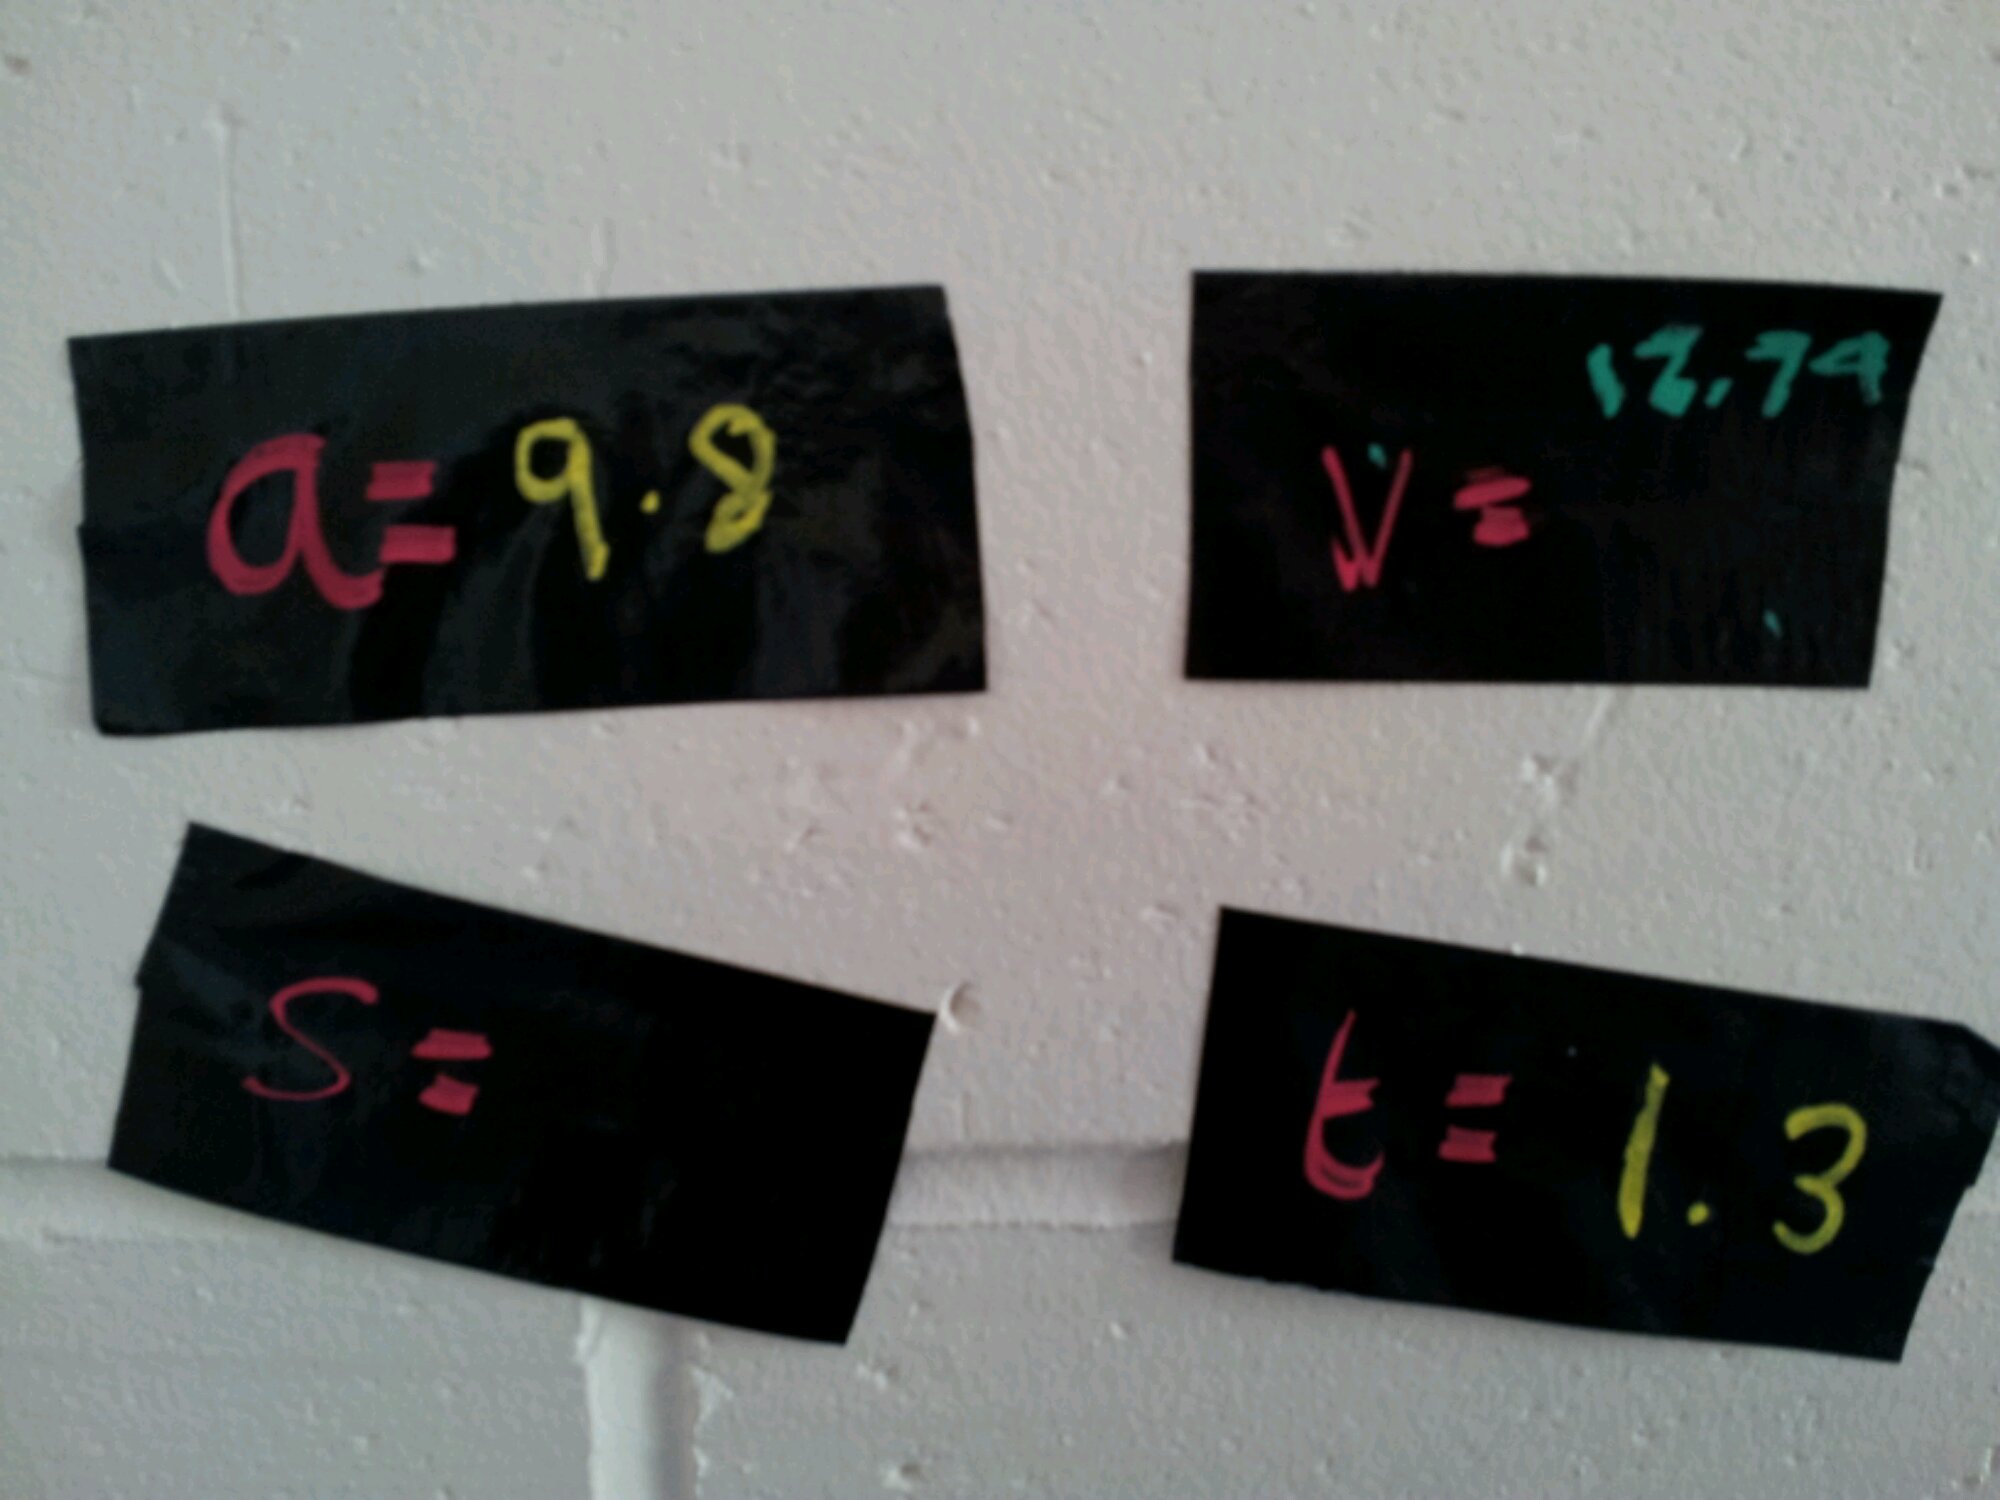
The students used mobile phones to time the drop from the bannister to the floor and calculated the distance and final velocity. The physical activity allowed us to think about how to draw these kinds of diagram.
And finally …
Just some pictures of an alternative whiteboard:
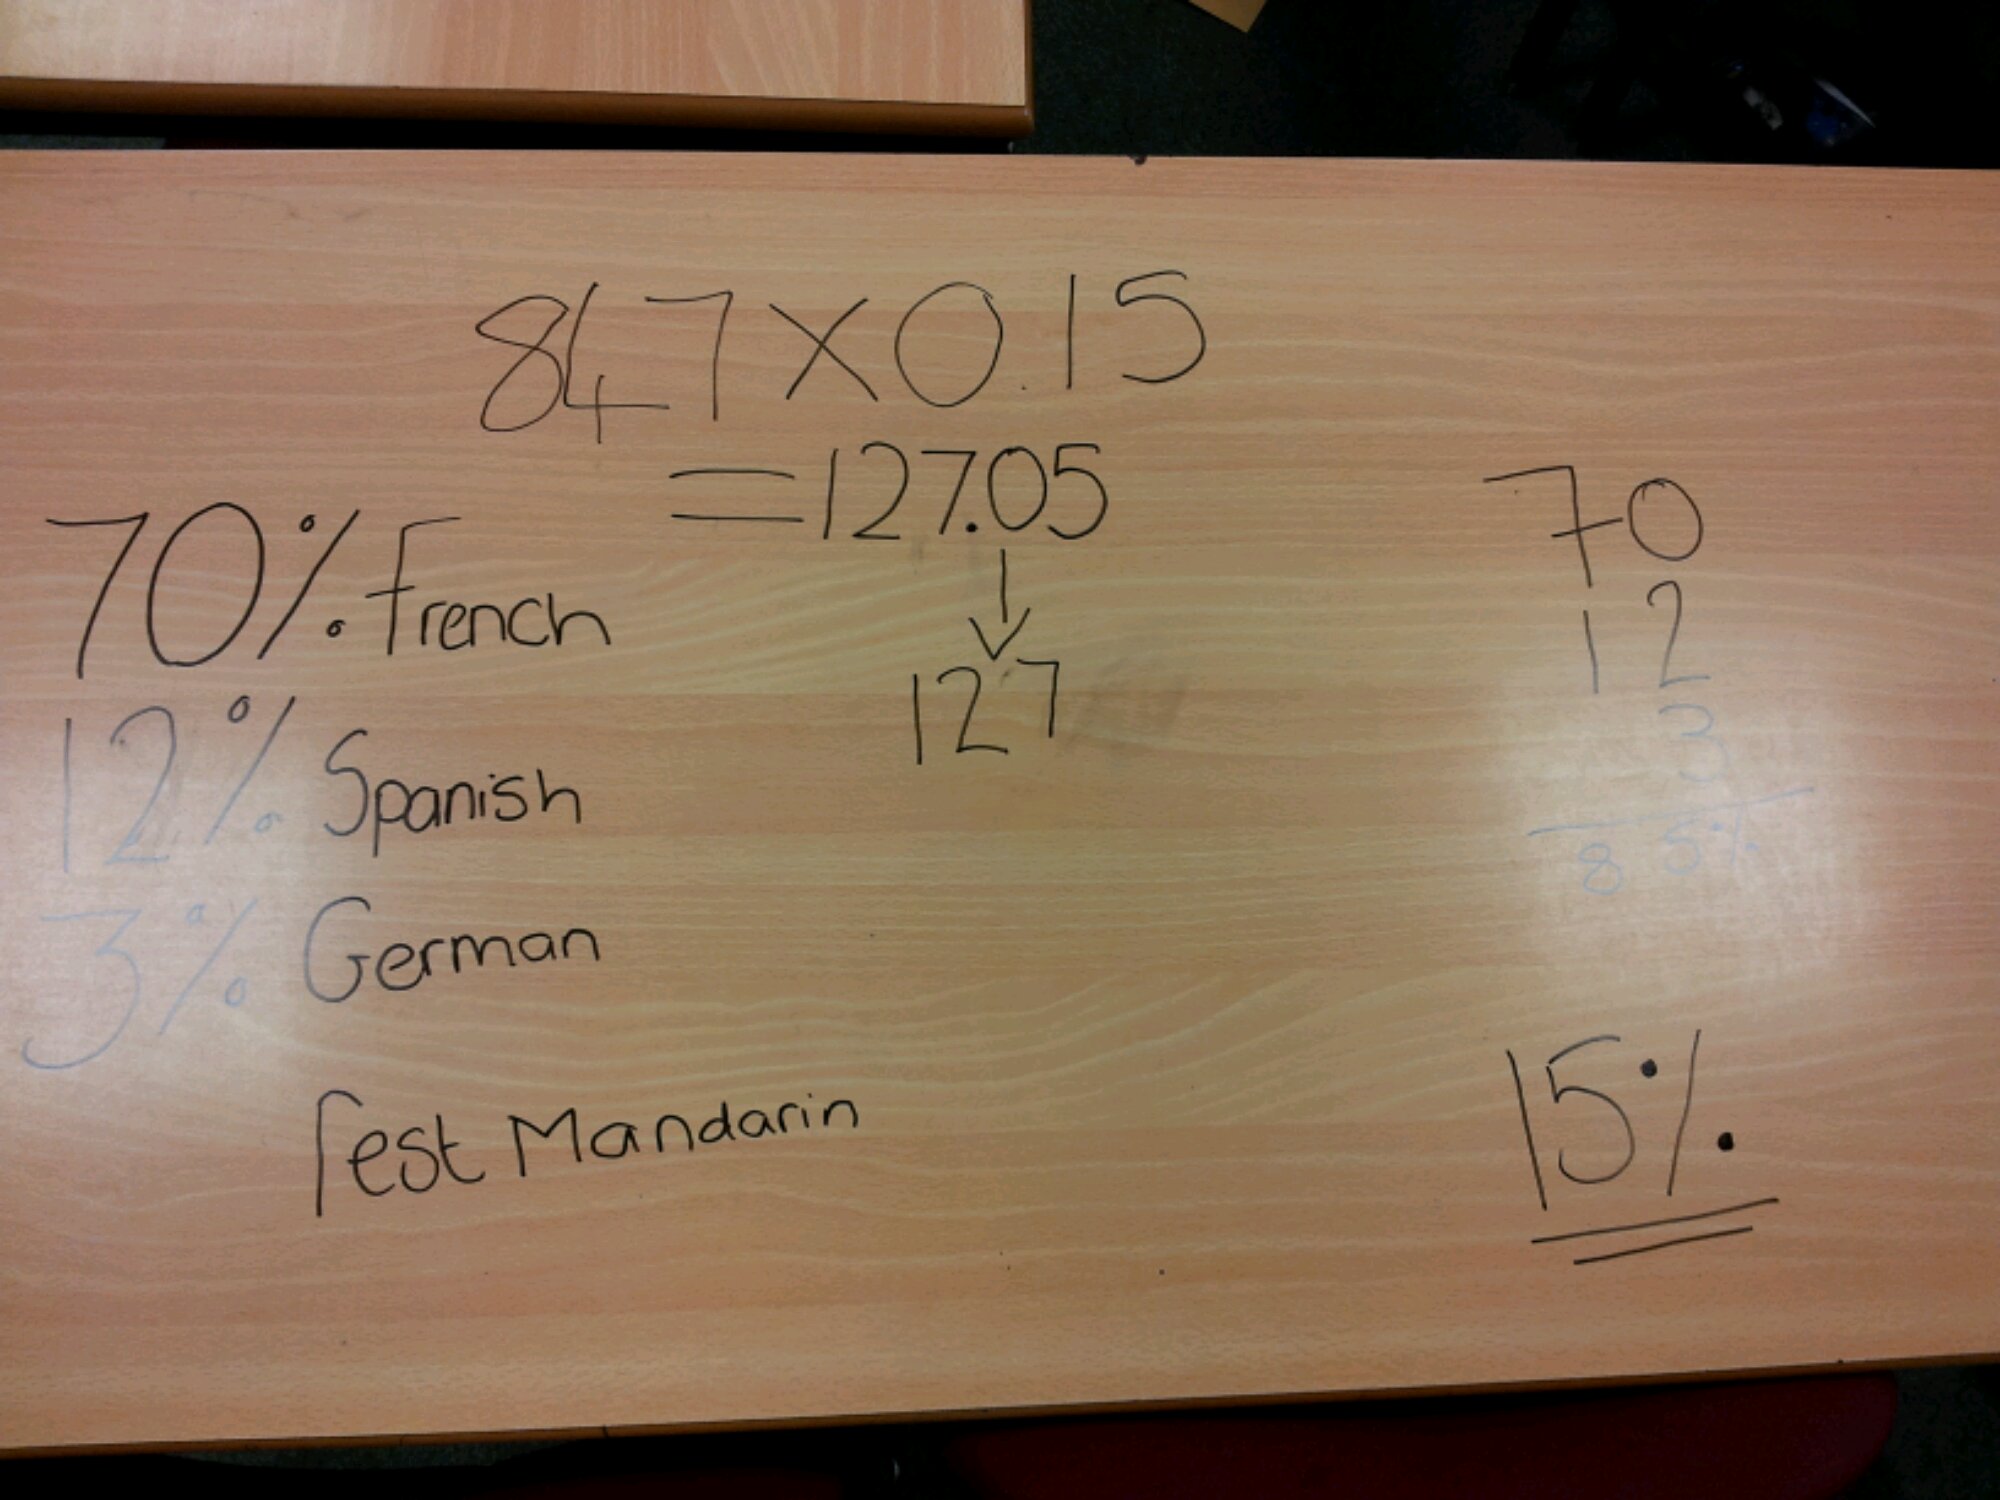
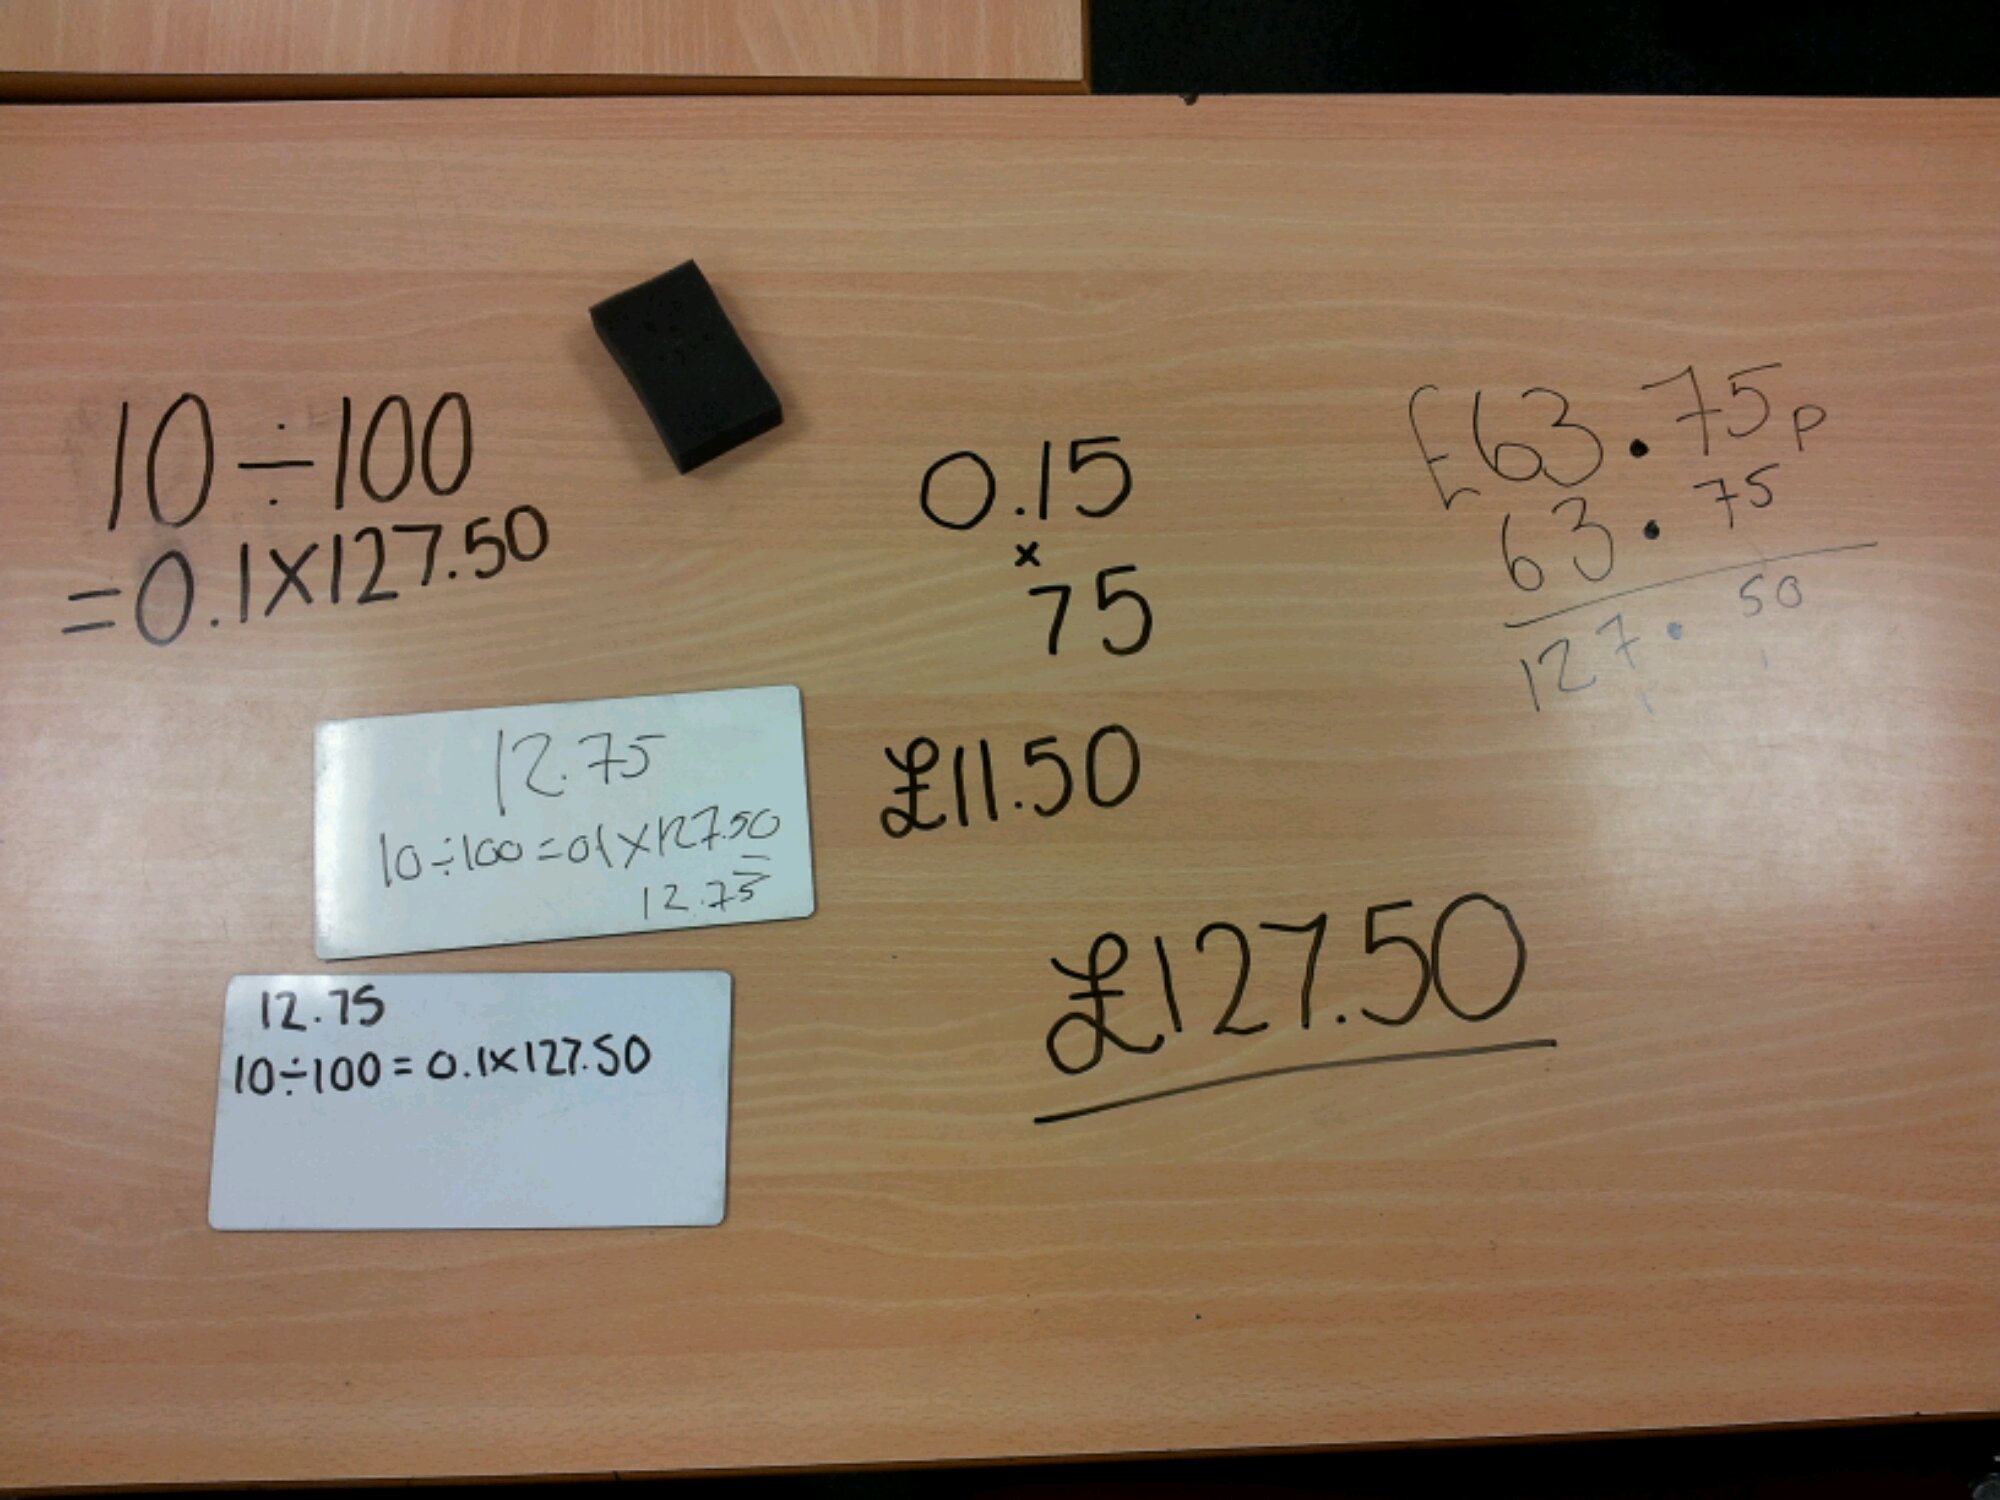
Like this:
Like Loading...


