Tag Archives: percentages

345. Practical percentage skills

It’s perfectly obvious that fluency in the use of multiplication tables directly impacts students ability to divide. This grows into confidence with algebra and reverse operations. Students are able to see the links between the concepts. Our understanding of the importance of such skills is part of the success of programmes such as TTRockstars and Numeracy Ninjas.

Why is it then that so many textbooks, websites and resource banks keep the manipulation of percentages as separate skills sets? Percentage increase / Percentage change / Reverse percentages. We know that when concepts overlap, fluency increases when these links are pursued. So that’s what I set out to do.

I have a bright Year 8 class and started working on percentages with them. It didn’t take much to have them confident using equivalent decimal multipliers to find percentages of amounts. Using a multiplier for increase/decrease was a walk in the park. Then finding percentage change came up. Over the years I’ve seen a lot of students get very confused with half remembered methods:

“Which do I take away?”

“What number do I divide by?”

“Is this calculation the right way around?”

I tend to teach new value divided by old value and interpret the answer. It got me thinking – why am I teaching them this? They can increase by a percentage using a multiplier, why can’t they rearrange their working to find the actual percentage? Same goes for reversing a percentage.

After a good discussion, I used this worksheet to recap and develop their skills:

Percentages Linking concepts questions

Percentages Linking concepts answers

Warning: “Original Amount” section, question (d) is a tricky one.

As with all new approaches, it’s always good to see if it worked. I set the following task from Don Steward’s website:

MEDIAN percent problems

I have GCSE students who wouldn’t know where to start on those questions, yet my Year 8 with their ‘have a go’ attitude were absolutely awesome. I’m definitely using this method again!

290. Alcoholic Percentages

The season of gratuitous excess is upon us and the reminders about safely consuming alcohol are popping up in supermarkets … usually next to the massive bottle of brandy, which are on special offer! We educators are counting the days to the holiday break.

But wait!

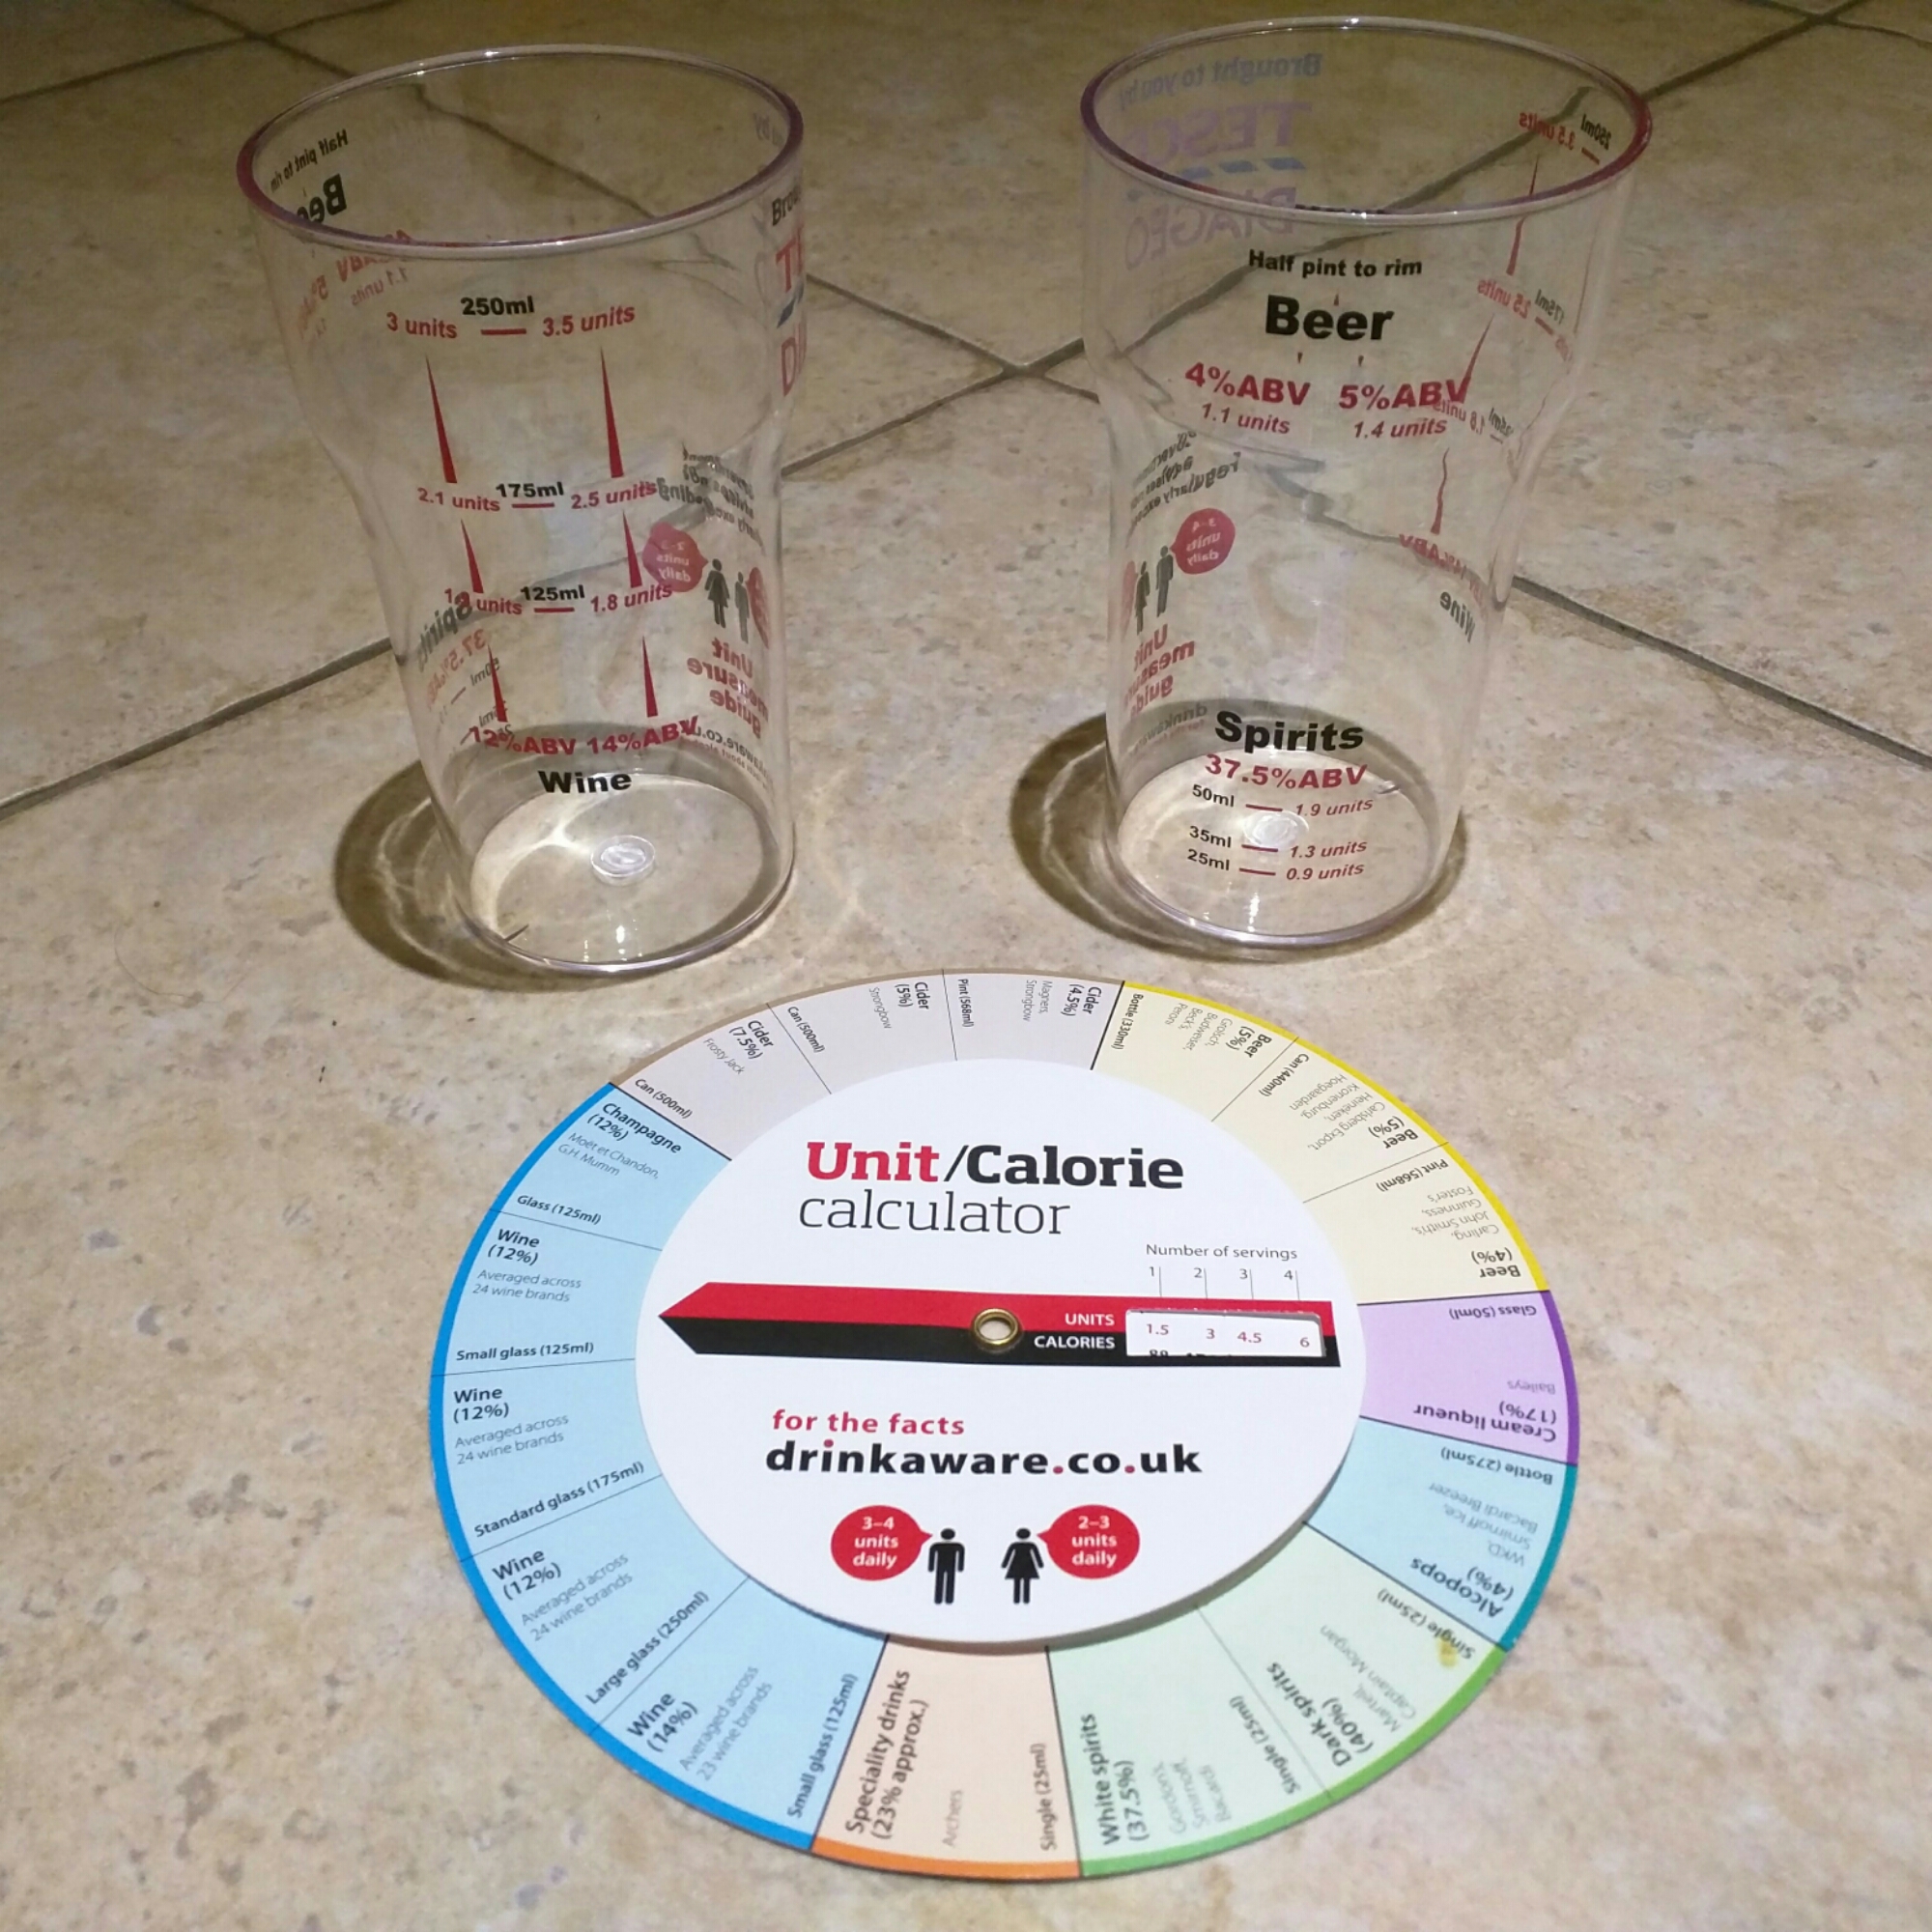
Keep your eyes peeled for all the alcohol awareness promotions. My local supermarket had information leaflets and these goodies:

image

Forget doing percentages about sale prices. How about working out the volume of alcohol in different beverages? Finding out how easy it could be to exceed the recommended intake? A bit of education of the effects of alcohol in a cross curricular lesson?

Now how much brandy soaked Christmas cake is equivalent to one unit of alcohol?

205. Percentages cubed

This neat little activity combines nets of cubes with non-calculator percentages. It doesn’t necessarily replace teaching basic percentages, but it is a good starting point.

Objectives

  • To understand the link between different percentages.
  • To construct a cube, using a 2D net.
  • To calculate percentages.

Equipment
Pre-printed nets of cubes on card
Scissors
Glue
Felt-tip pens

Task 1
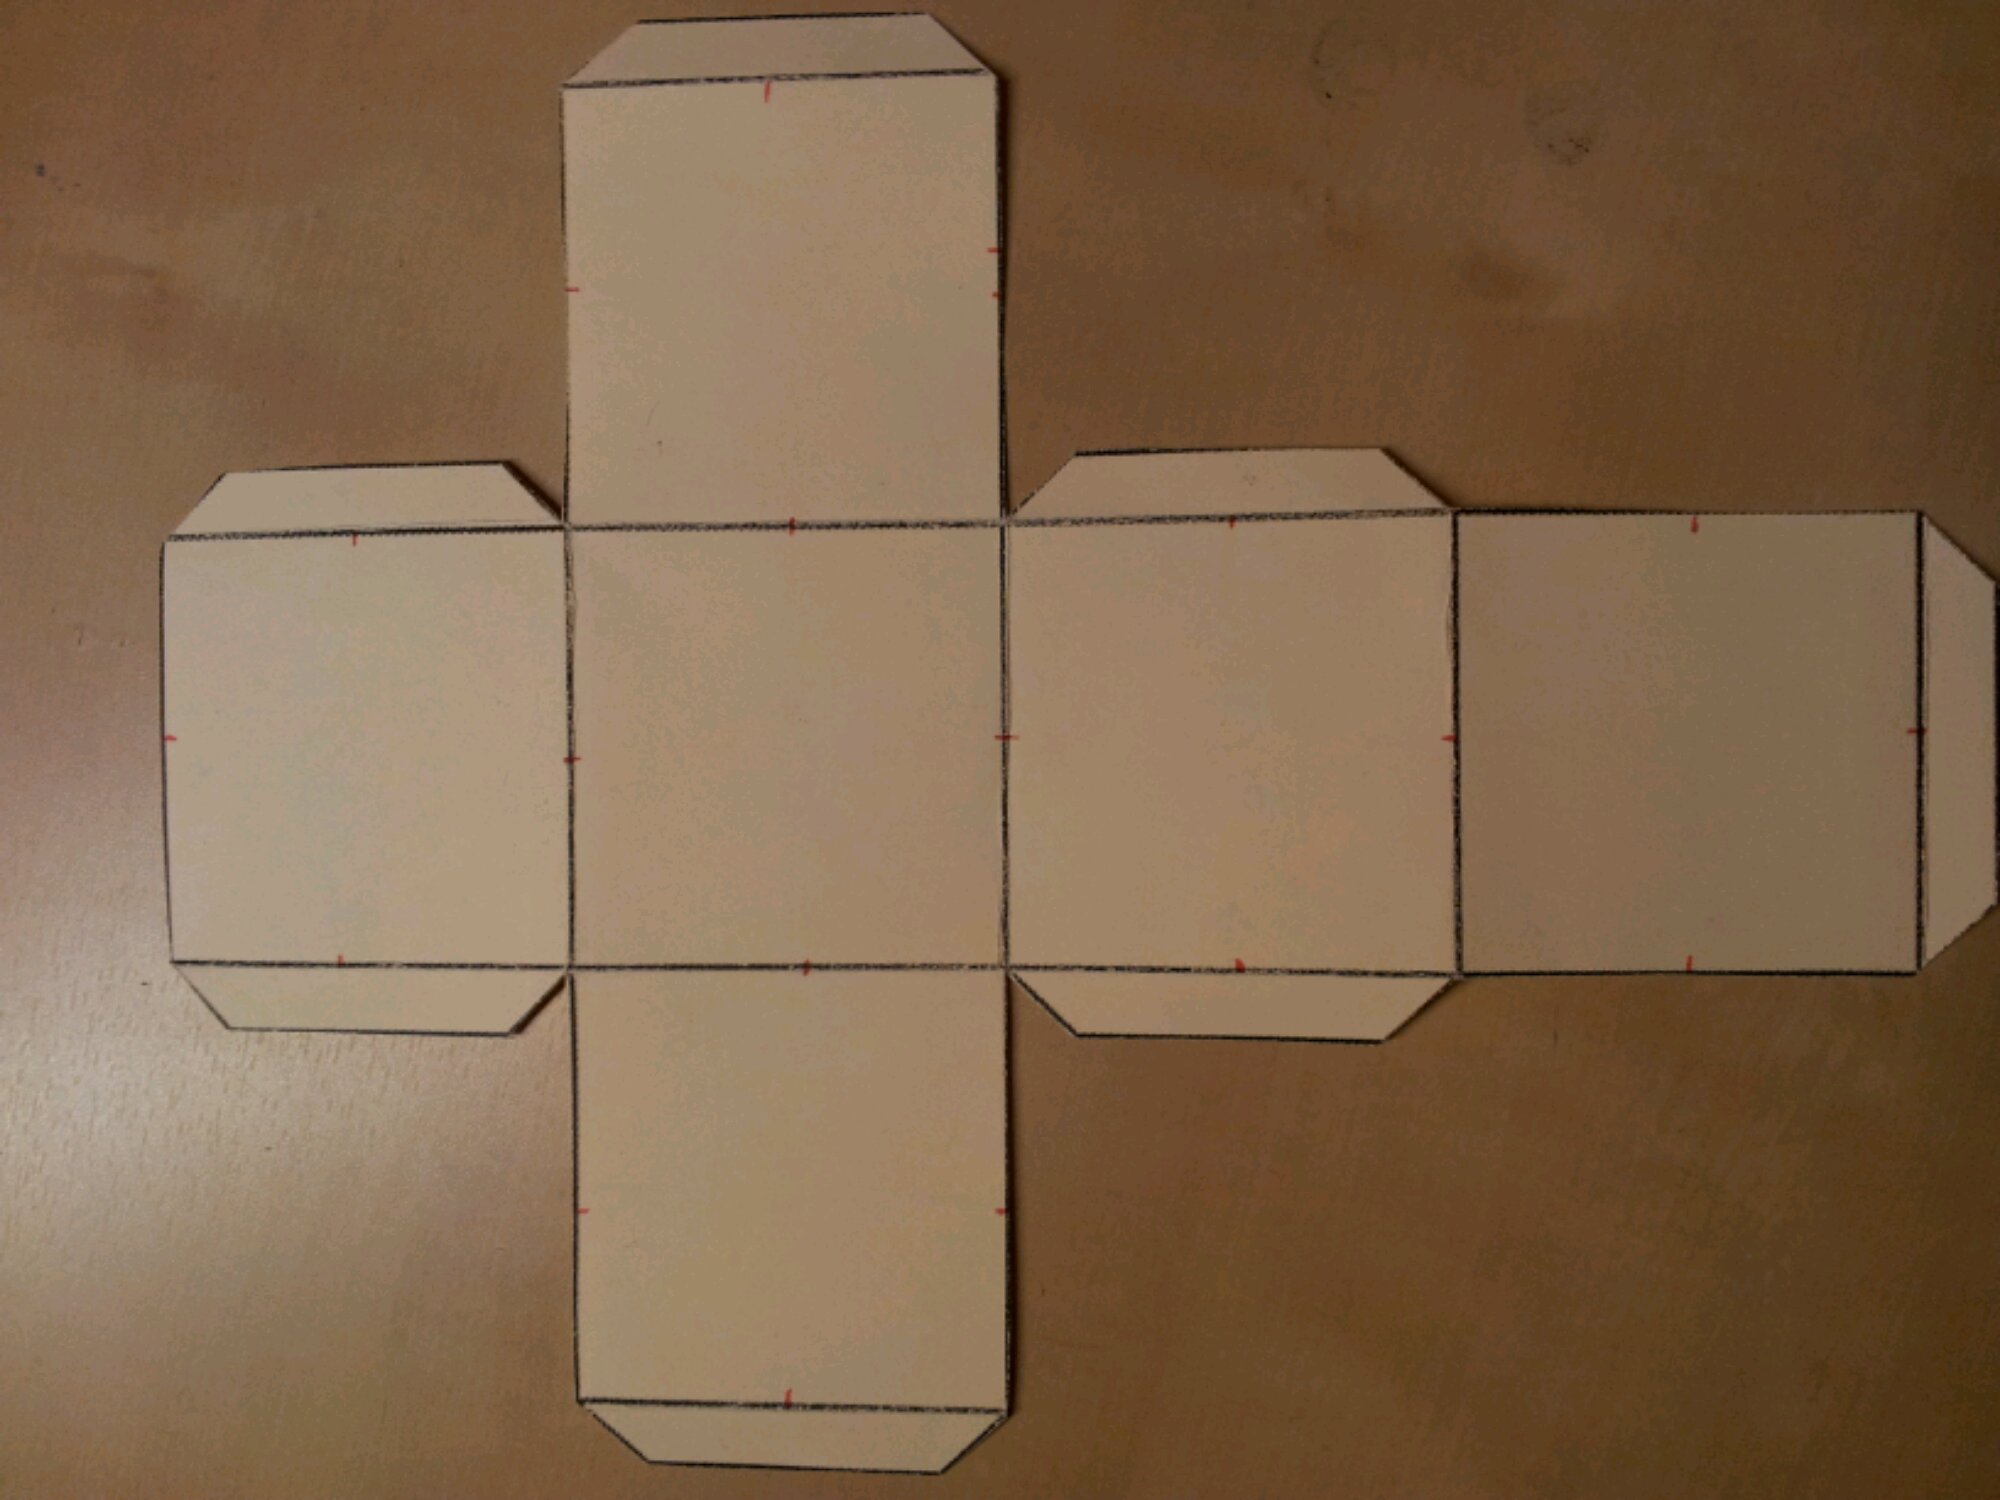
Cut out the net of the cube and mark the midpoint of each edge, ensuring matching points on the joins.

image

The matching points are important later on. Fold in both directions along each line.

Task 2
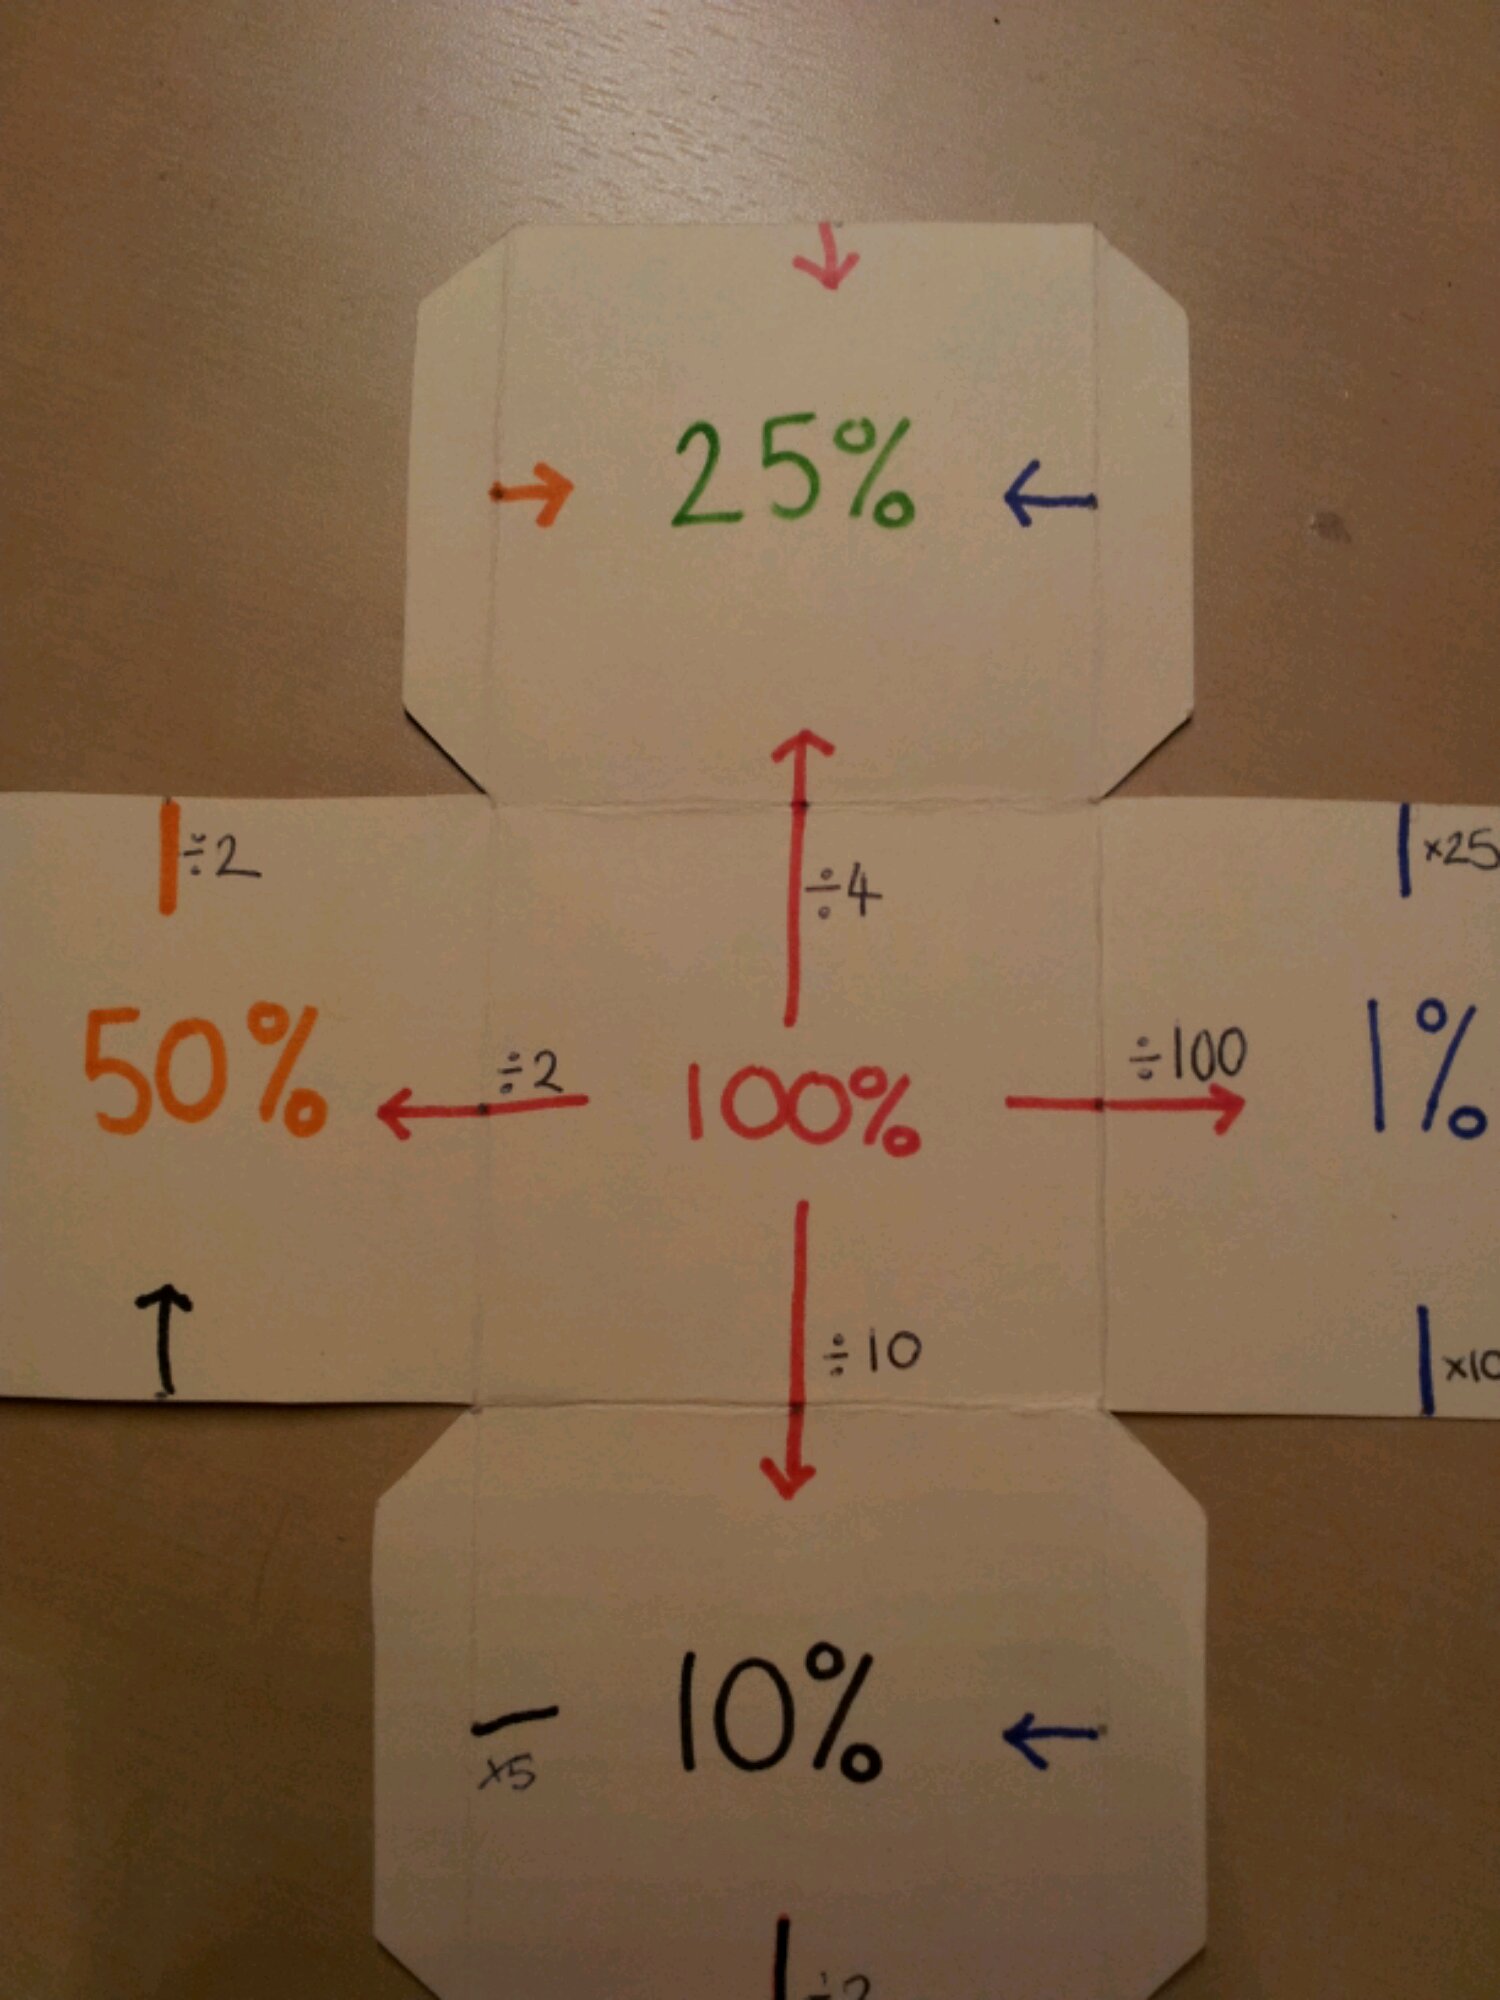
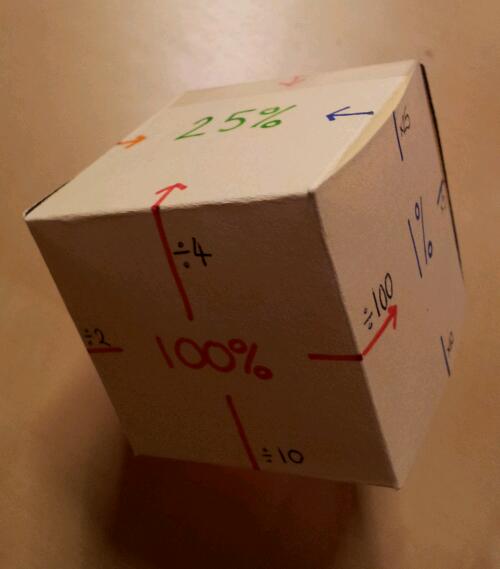
Label the middle square 100%.
Draw horizontal and vertical arrows going away from it with divide by 2, 4, 10 & 100. What percentages should go on these squares?

image

You will notice the arrows go through the midpoints.

Task 3
After your class have identified the squares as 50%, 25%, 10% & 1%, ask your class how these are linked.

This bit wowed my class.

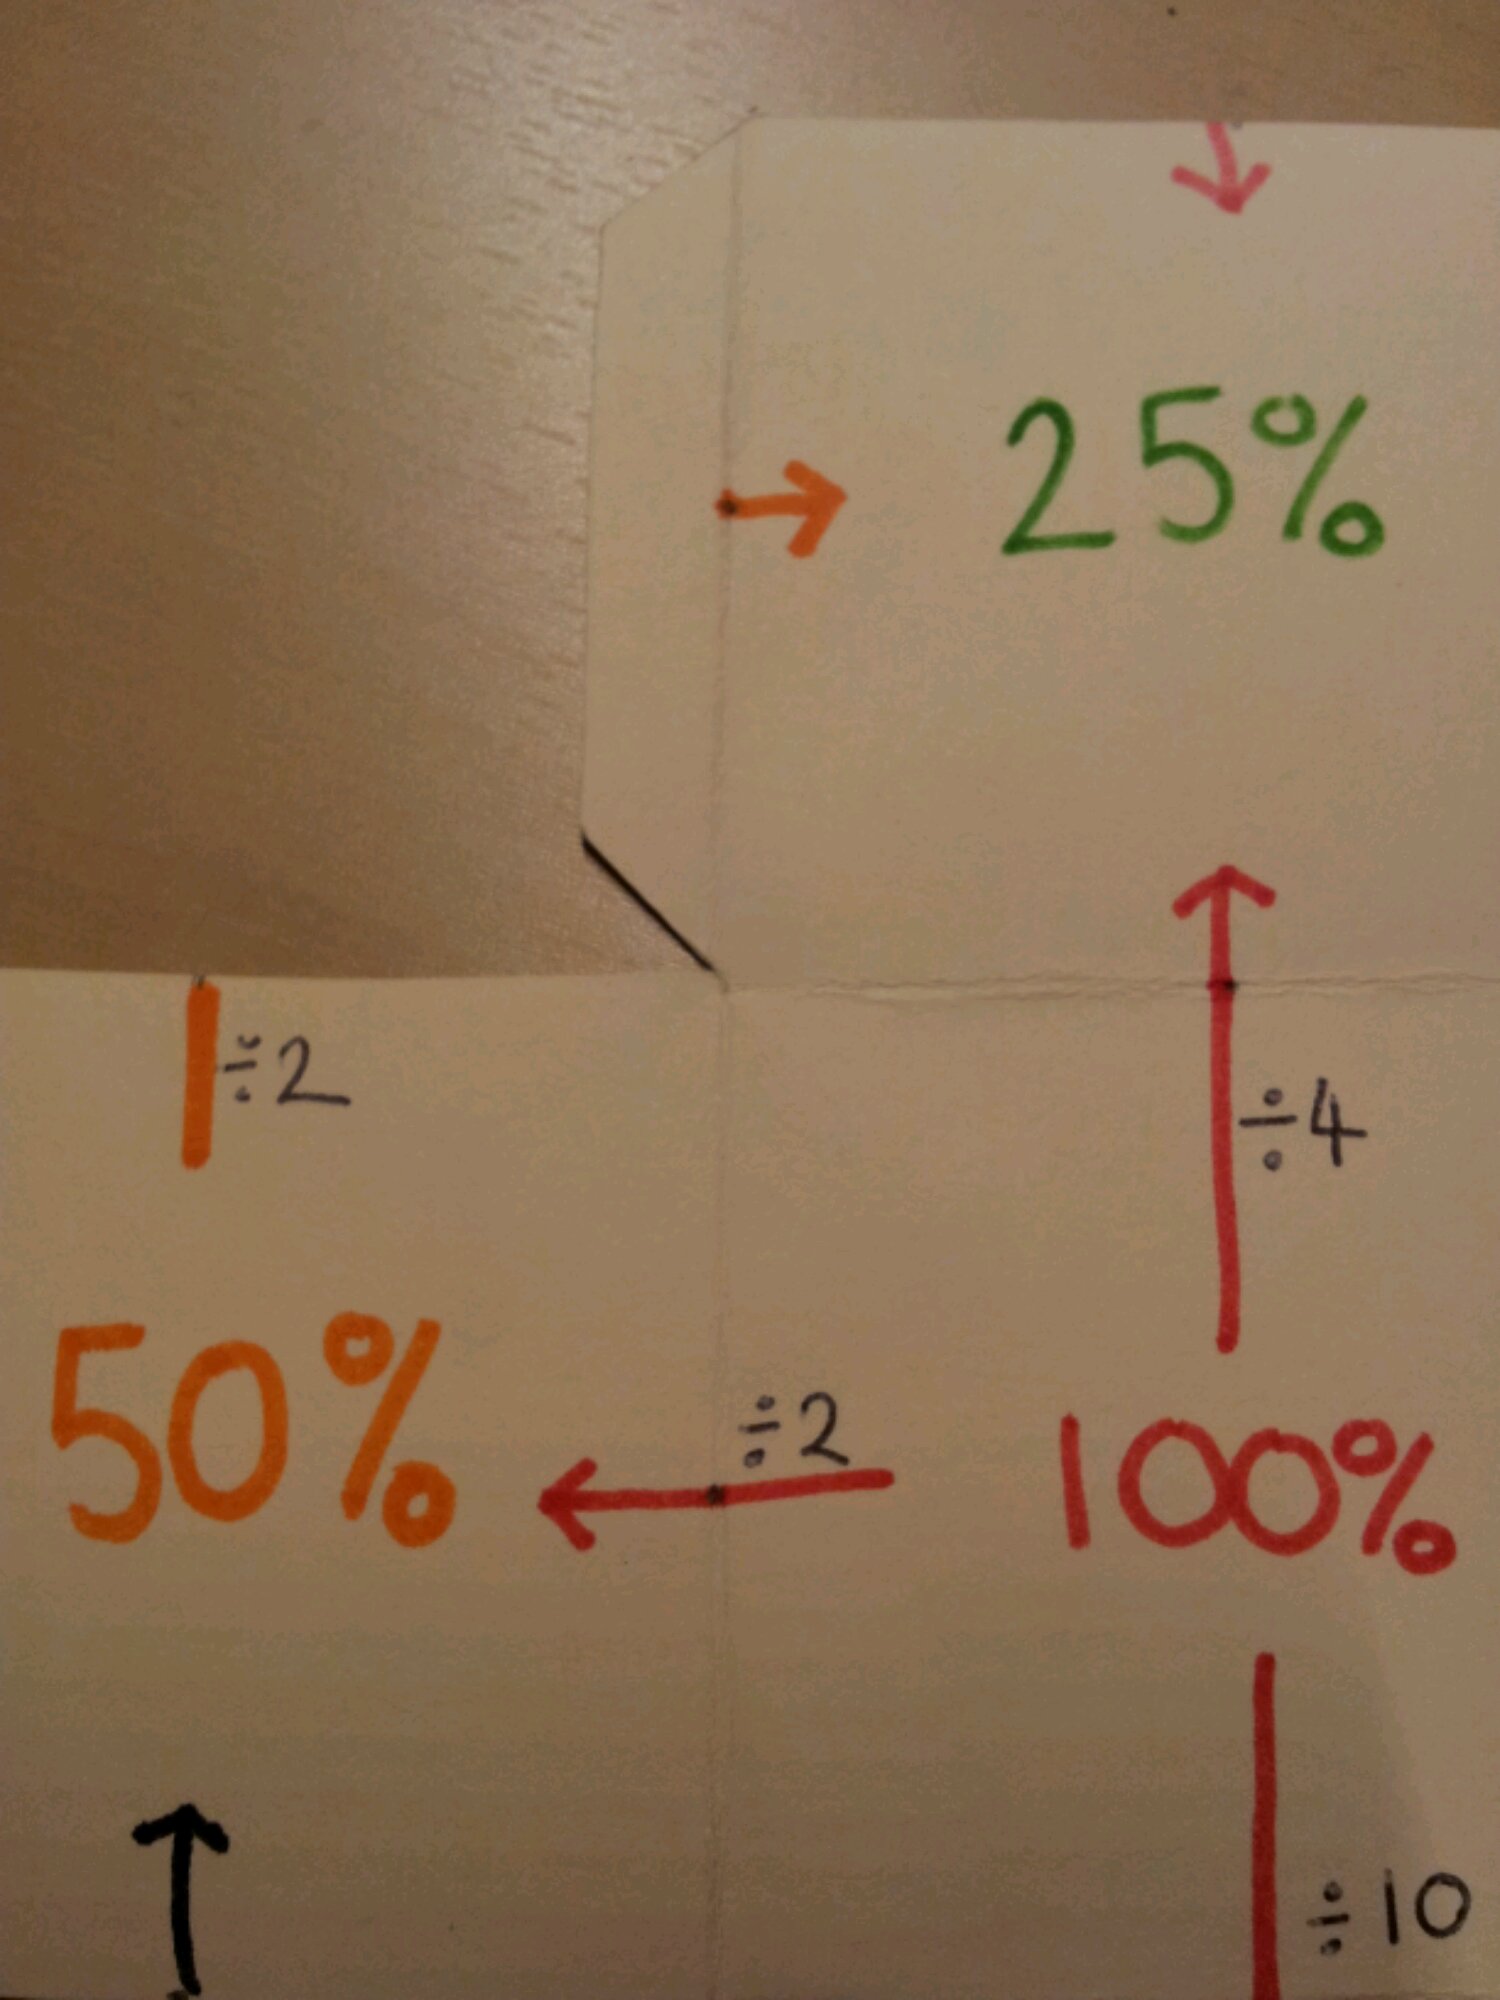
Draw a vertical line up from 50%.
Label it divide by 2.
Draw an arrow coming in from the left of the 25%.

image

What happens if you fold the cube up?
The arrow joins up! This is why you need the midpoints.

Task 4
Ask your class to complete the labels linking the other percentages.

image

Task 5
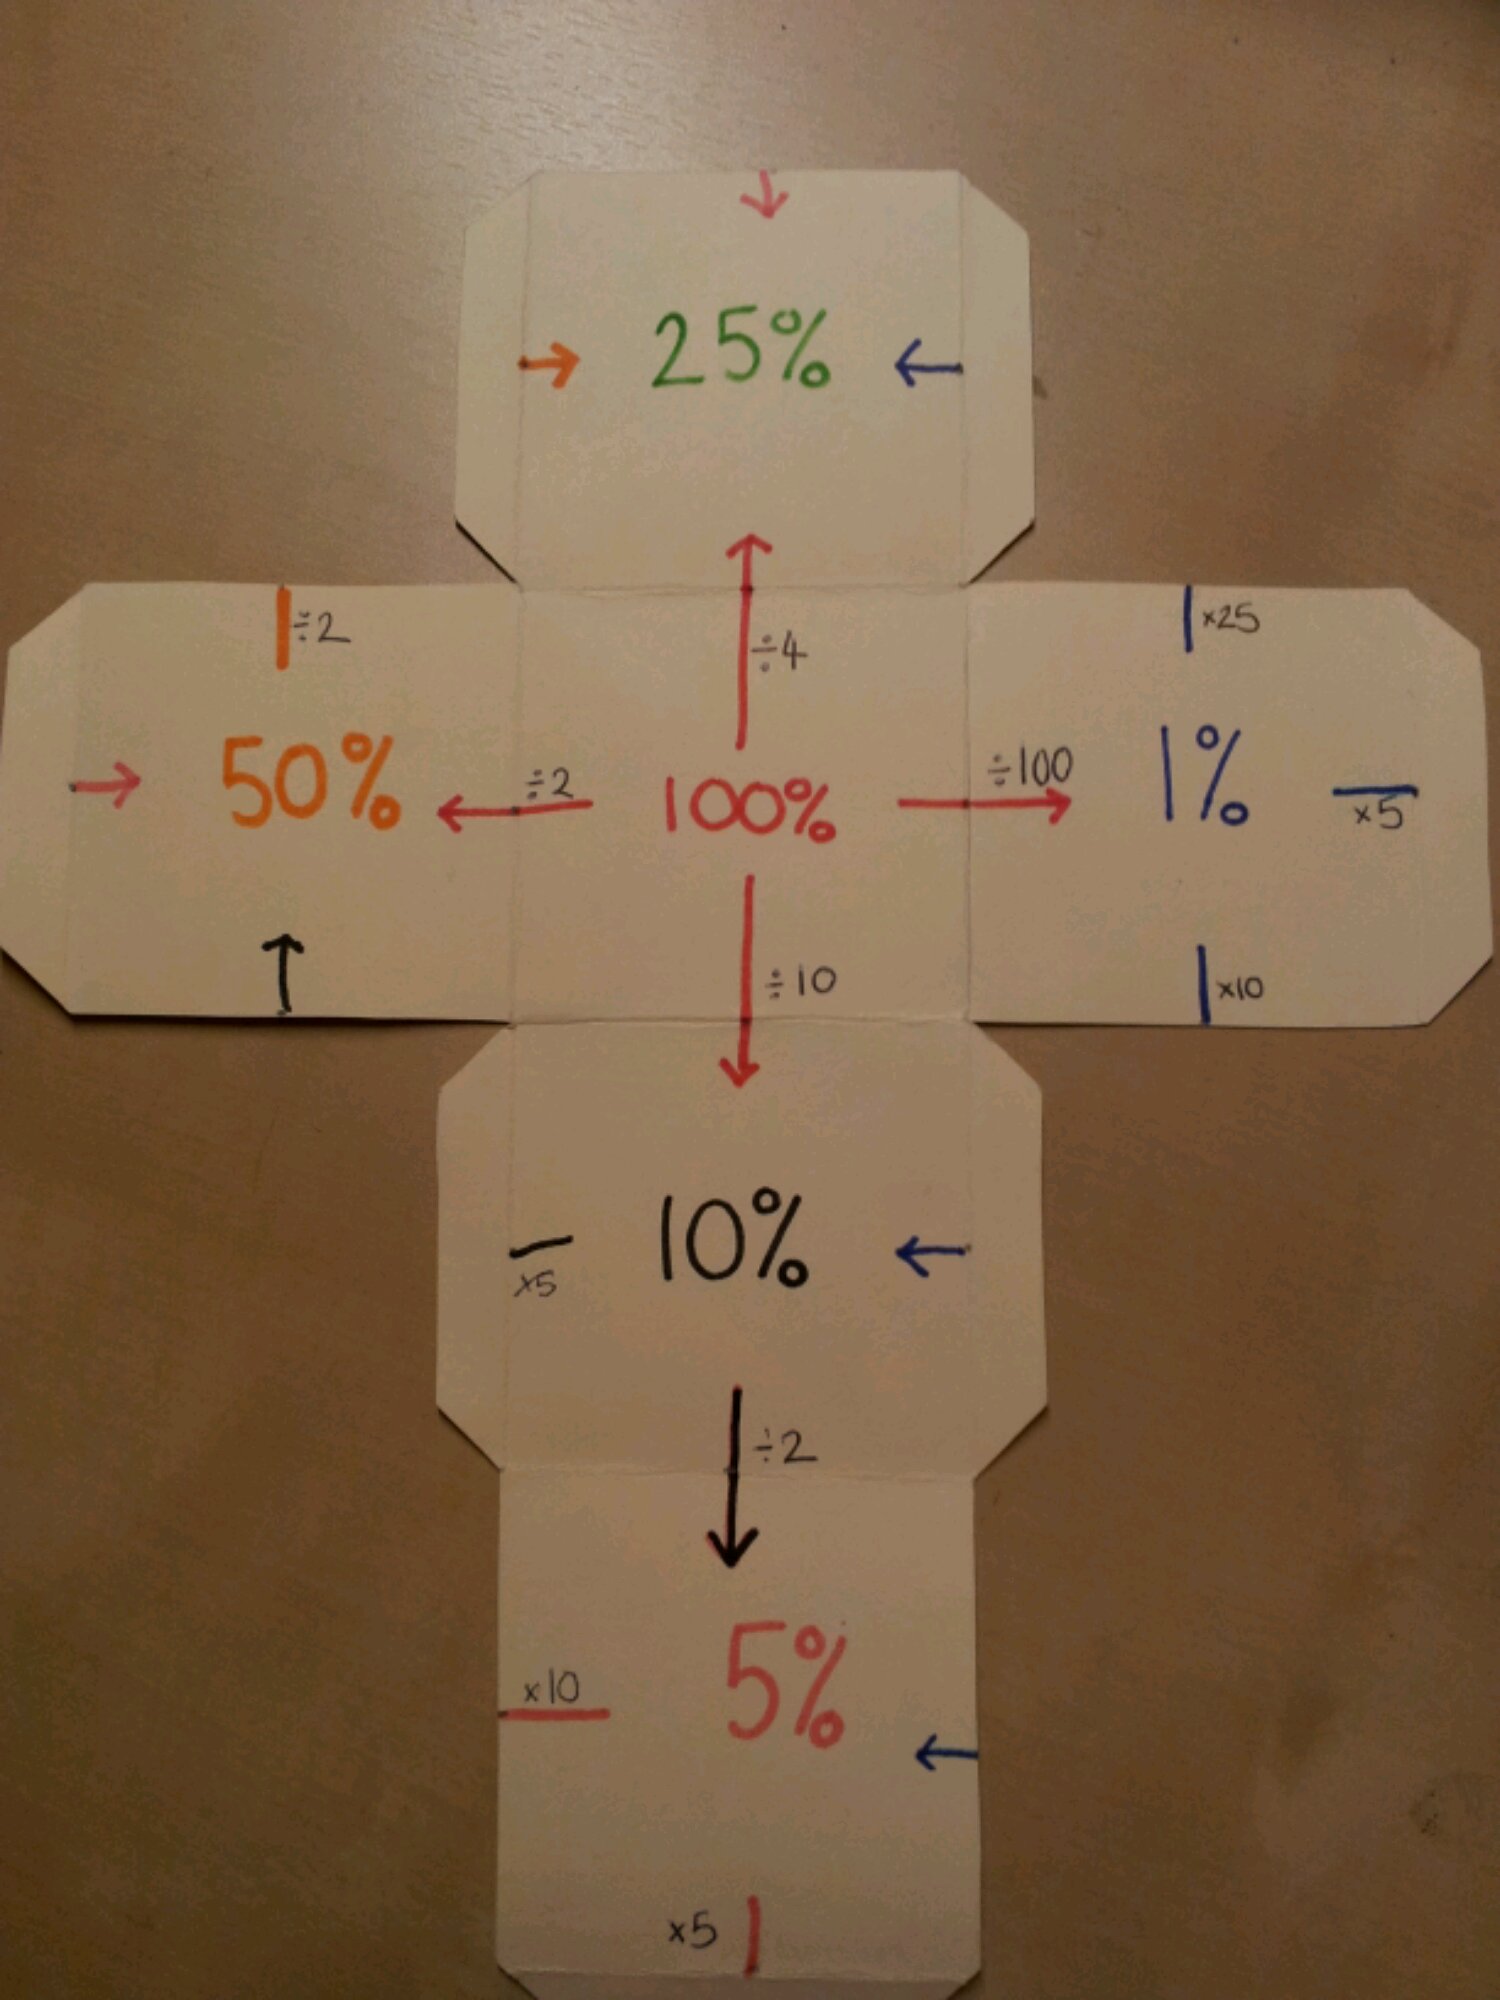
You should have one empty square. Label this 5%.

Ask your pupils to complete their arrows. They can be completed with divide or multiply.

image

You will notice that mine is colour coded, based on the original percentage in each calculation.

Task 6
Glue the 5% square flap to the 25% square. This allows you to temporarily tuck in the other flaps, whilst allowing the cube to be folded flat to go in a book.

image

Task 7
Give pupils a starting number eg 360. This represents 100%.
By following the arrows on the cube, they can work out all these percentages quickly and efficiently.

190. Visual Compound interest

So you’ve reached that bit of the Number curriculum at the end of Percentages – Simple and Compound interest. The theory is straight forward enough:

  • Simple interest is calculated on the original balance.
  • Compound interest is calculated fresh every year on the current balance.

This shouldn’t be a tricky concept, yet it is frequently  glossed over or partially taught to lower ability students. This is the maths they’ll need to get their head around at the bank in a few years time. So why not replace the scary calculations and rote learning with diagrams, which embed understanding.

Equipment

  • Coloured pens
  • Whiteboard
  • Squared paper
  • Ruler
  • Calculator (Optional)

Simple Interest: Step 1

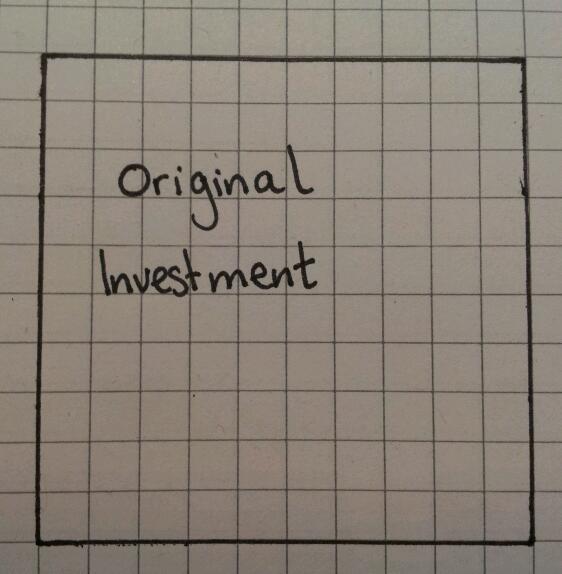
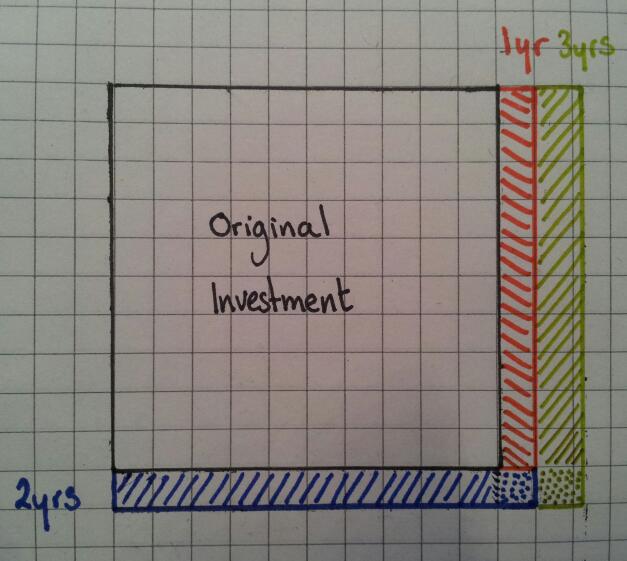
Draw a square which has sides which are a multiple of ten (I used 10×10). This area represents the original investment.

image

Step 2

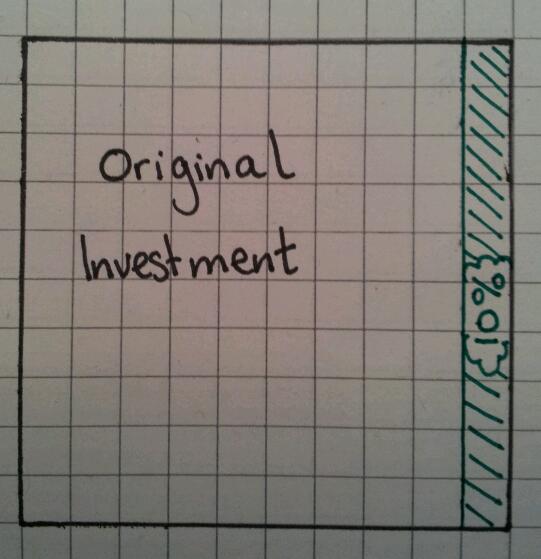
Assume the interest rate is 10%. Calculate 10% of the area and shade it in lightly. Basically one column, since it’s a 10×10 grid.

image

Step 3

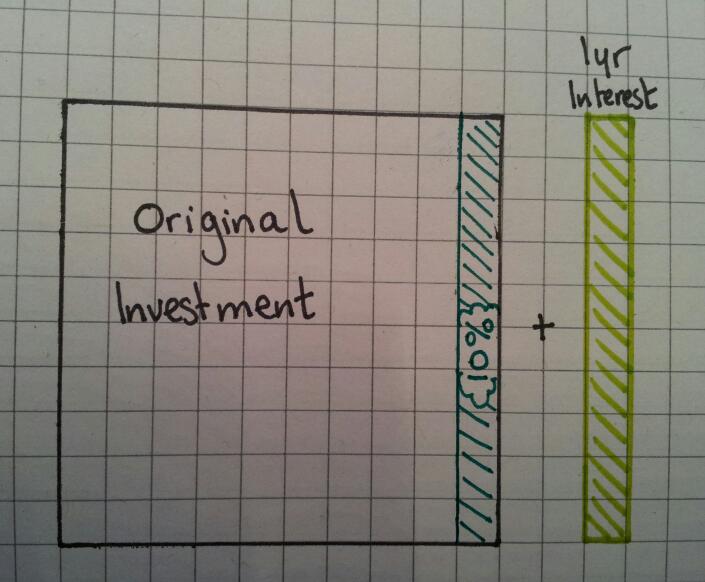
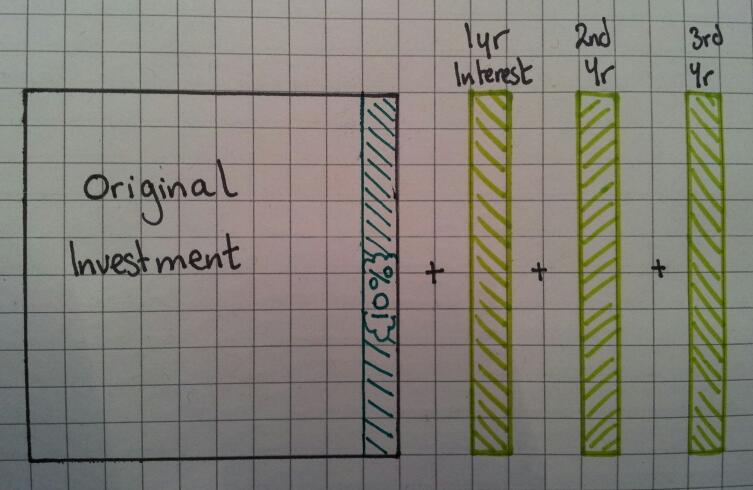
Add on 10% by drawing the shaded area again. This is the 1st interest payment.

image

Step 4

Repeat Step 3 for the 2nd and 3rd years.

image

Step 5

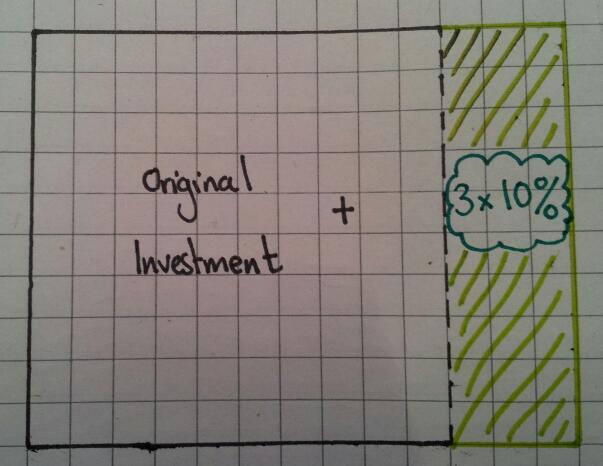
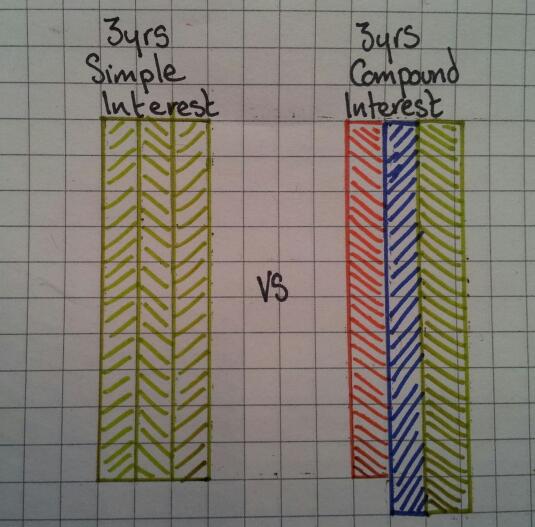
In summary, a simple interest (10%) investment over 3 years is the same as adding on 30%.

image


Compound Interest: Step 1

Repeat steps 1 -3 of simple interest

image

Step 2

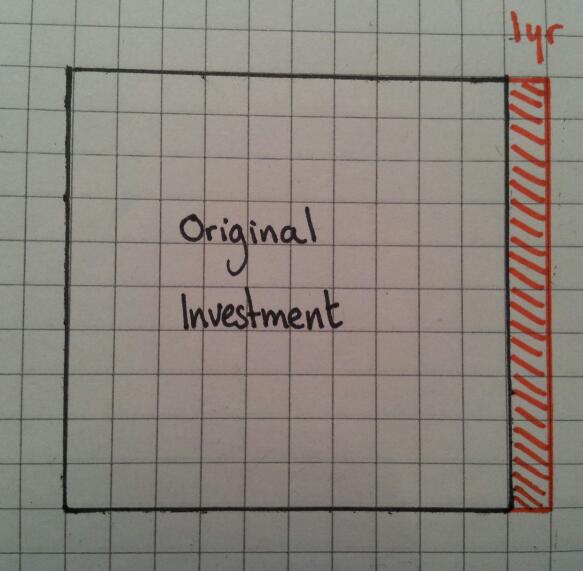
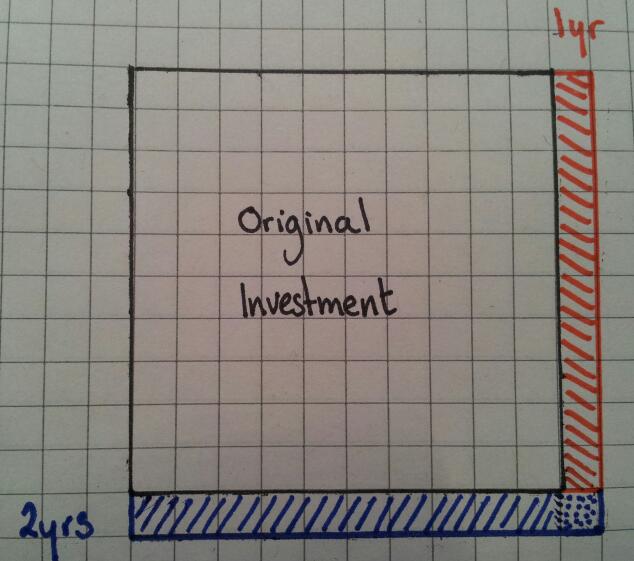
Work out 10% of the height and draw a new row – since the grid is 10 squares high, it’s simply one square high.

image

Notice that the row is wider than the original square – the dotted area indicates the extra interest earned on the previous years interest. This starts the discussion that you are not adding on the same amount each time.

Step 3

Using the same concept as Step 2, work out 10% of the width of the diagram. This time the width is a little more than one square wide.

image

Once again it’s clear to see that you are adding on more than the last year.


Comparison: Simple vs Compound interest

Which is the better investment? It’s pretty clear to see:

image

You can compare these two types of interest using area calculations, rather than long lists of percentage calculations and you can actually ‘see’ the different methods.


157. Receipt for learning

Do you ever really look at the bottom of your supermarket receipts?

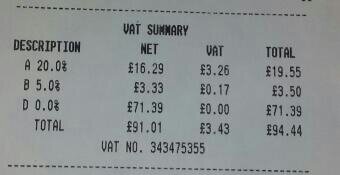
This caught my eye today:

image

The bill is broken down into three bands of tax, the relevant amounts, VAT and total amount payable.

It would be quite an easy task to enlarge a receipt on a photocopier and blank out quantities. Don’t forget to blank out financial transaction details. You could work out percentages of amounts, reverse percentages or find missing percentages. It could be extended to percentage increase using multipliers. It also links to decimal calculations, rounding and money.

All this learning from a bit of paper from the supermarket*.

*Not all supermarkets do this, but there is usually some kind of tax reference.

48. Percentage book

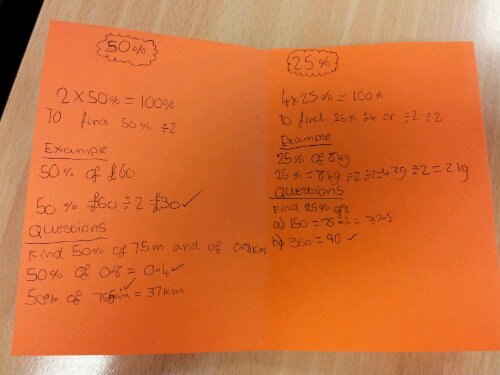
I’ve found that copying examples and methods into a useable revision resource can be tricky for younger pupils or those with concentration issues. They don’t refer back to their notes because they are either incomplete, unreadable, unfindable in their book or just lost.

I saw instructions for making simple books from a single sheet of paper and wondered if it was worth a try.

Non calculator percentage book

Making the book
Fold a sheet of paper into eight as shown. The sample here is A4, but I used A3 in class.

image

Cut along the middle two quarters (blue line in the picture) and fold in half lengthways.

image

Fold this into an X shape.

image

Arrange into a book.

image

Instructions
Clearly label the cover – you want your pupils to find this easily.

As we filled in each page, I explained why we did each process. Because their books were larger, the bottom of their pages had questions too.

image

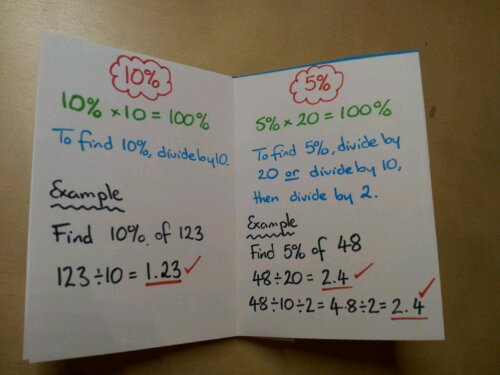
We covered 50%, 25%, 10%, 5%, 30% and the last page was a challenge/extension task: 17.5%.

The back page was left blank so that they could stick the mini-books into their exercise books.

Example

image

45. Show me the money

If you offer personal finance as a compulsory part of the curriculum, stop reading now.

‘Pay day loan’ companies have been the subject of several news stories over the last few months. Do they make money from those suffering from financial strife? Are the people who take them out too short-sighted to see the long term impact? Are they bad at Maths?

Personally, I don’t think there is a simple answer to any of it. That is the reason I’ve started including pay day loans when I do percentages with KS4 pupils.

Loan calculator
This idea arose when I was revising with older pupils who had the skills to work out percentages, but were struggling to apply them.

I showed them the loan calculator sliders on Wonga.

image

I asked the class to estimate how much different loans would cost for different numbers of days. They showed their answers on whiteboards. I then showed the actual amount owed and we discussed it.

The questions they came up with and how they justified their choices were brilliant.

Student Examples
If you are always £100 short at the end of the month and continually paid off the loan with interest, what would you owe after a year?
(They spotted that after each month you would need £100, plus an extra months interest etc)
What is the APR? What does APR mean?
(It was 4214% on the day we discussed it)
Why do you pay fees on a loan?
Are pay day loans a bad thing as a one off, emergency solution?
(They were split on their answer to this one)

Some of these questions wouldn’t be relevant in a GCSE, but they are life skills which will hopefully benefit them in the future.

By the way, they were ‘gobsmacked’ when they realised how much interest you pay back on a mortgage and what percentage of your wages go on monthly repayments!