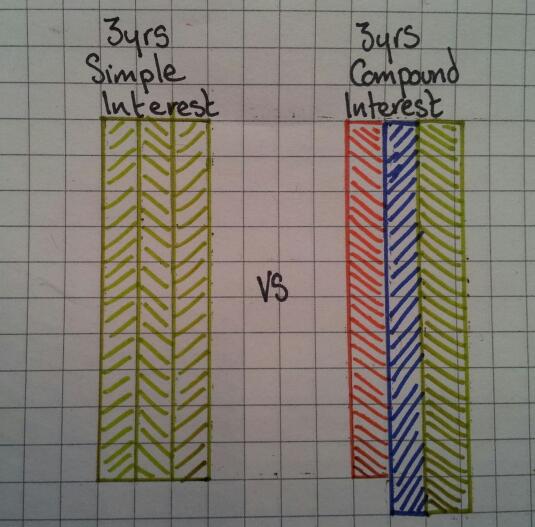
So you’ve reached that bit of the Number curriculum at the end of Percentages – Simple and Compound interest. The theory is straight forward enough:
- Simple interest is calculated on the original balance.
- Compound interest is calculated fresh every year on the current balance.
This shouldn’t be a tricky concept, yet it is frequently glossed over or partially taught to lower ability students. This is the maths they’ll need to get their head around at the bank in a few years time. So why not replace the scary calculations and rote learning with diagrams, which embed understanding.
Equipment
- Coloured pens
- Whiteboard
- Squared paper
- Ruler
- Calculator (Optional)
Simple Interest: Step 1
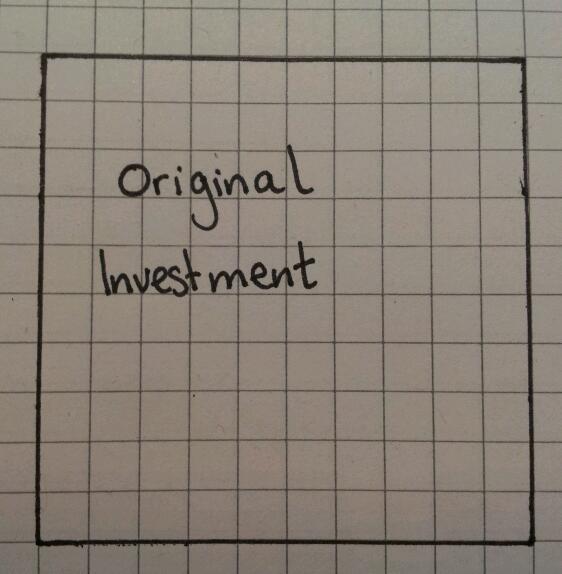
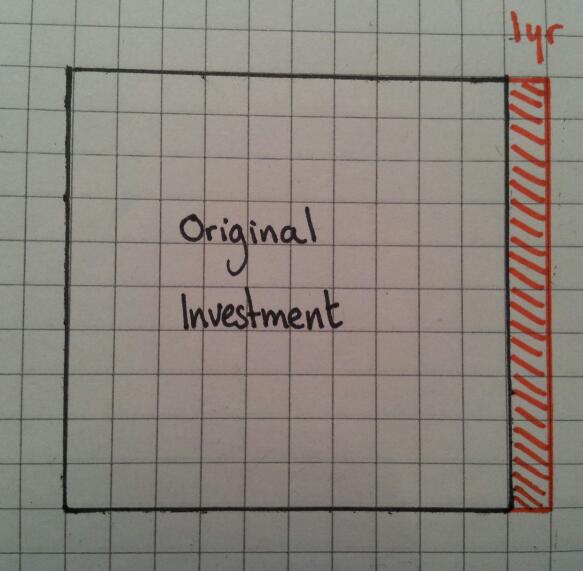
Draw a square which has sides which are a multiple of ten (I used 10×10). This area represents the original investment.
Step 2
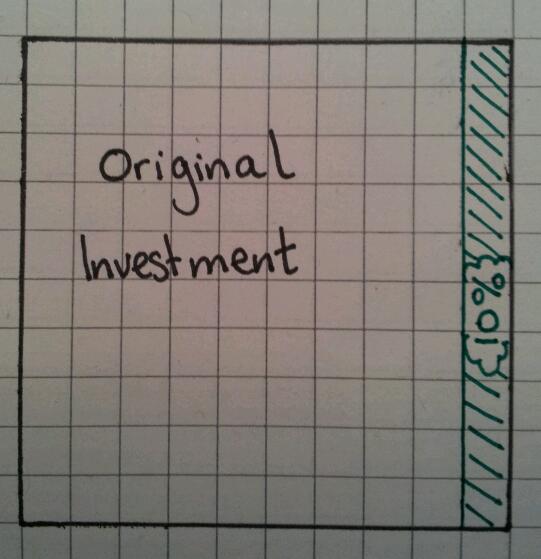
Assume the interest rate is 10%. Calculate 10% of the area and shade it in lightly. Basically one column, since it’s a 10×10 grid.
Step 3
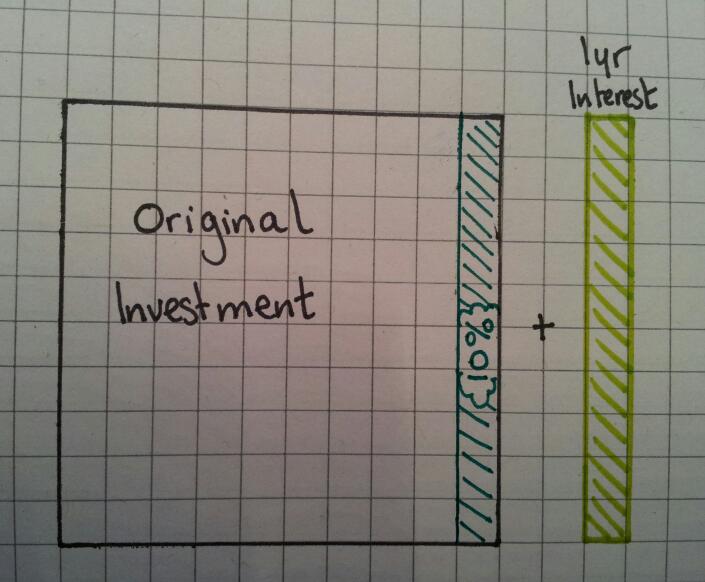
Add on 10% by drawing the shaded area again. This is the 1st interest payment.
Step 4
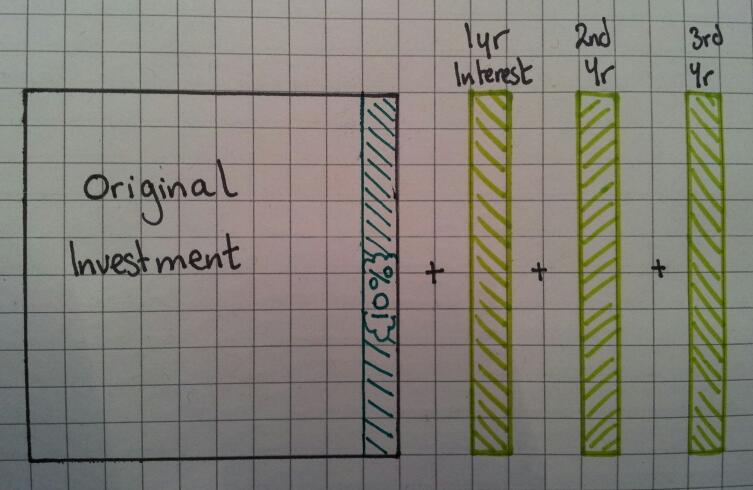
Repeat Step 3 for the 2nd and 3rd years.
Step 5
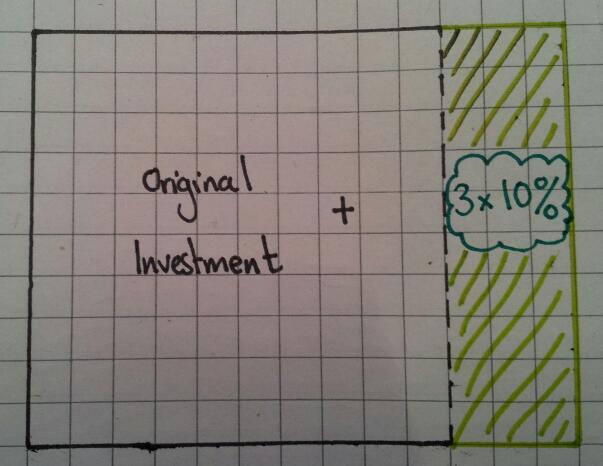
In summary, a simple interest (10%) investment over 3 years is the same as adding on 30%.
Compound Interest: Step 1
Repeat steps 1 -3 of simple interest
Step 2
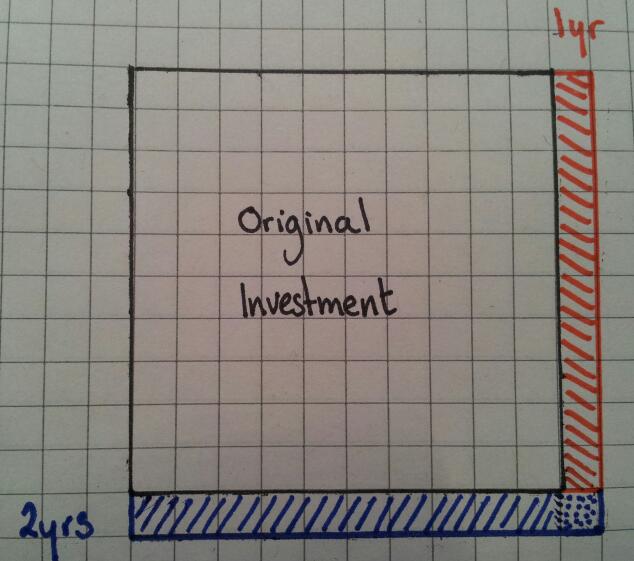
Work out 10% of the height and draw a new row – since the grid is 10 squares high, it’s simply one square high.
Notice that the row is wider than the original square – the dotted area indicates the extra interest earned on the previous years interest. This starts the discussion that you are not adding on the same amount each time.
Step 3
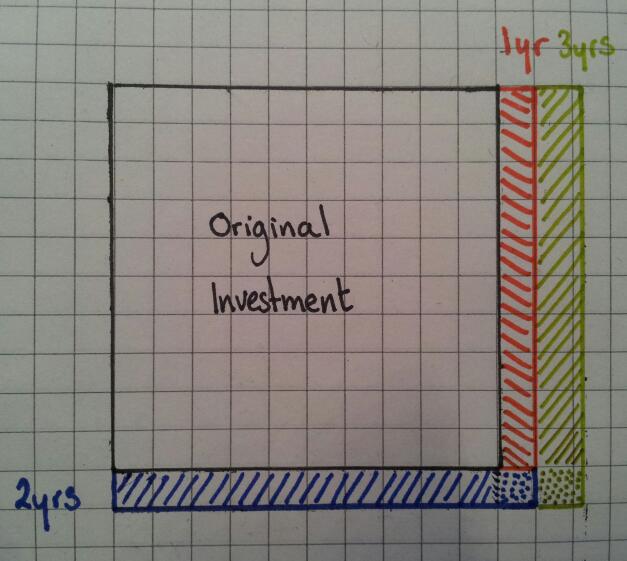
Using the same concept as Step 2, work out 10% of the width of the diagram. This time the width is a little more than one square wide.
Once again it’s clear to see that you are adding on more than the last year.
Comparison: Simple vs Compound interest
Which is the better investment? It’s pretty clear to see:
You can compare these two types of interest using area calculations, rather than long lists of percentage calculations and you can actually ‘see’ the different methods.

