Tag Archives: probability

296. Jellybean Trees

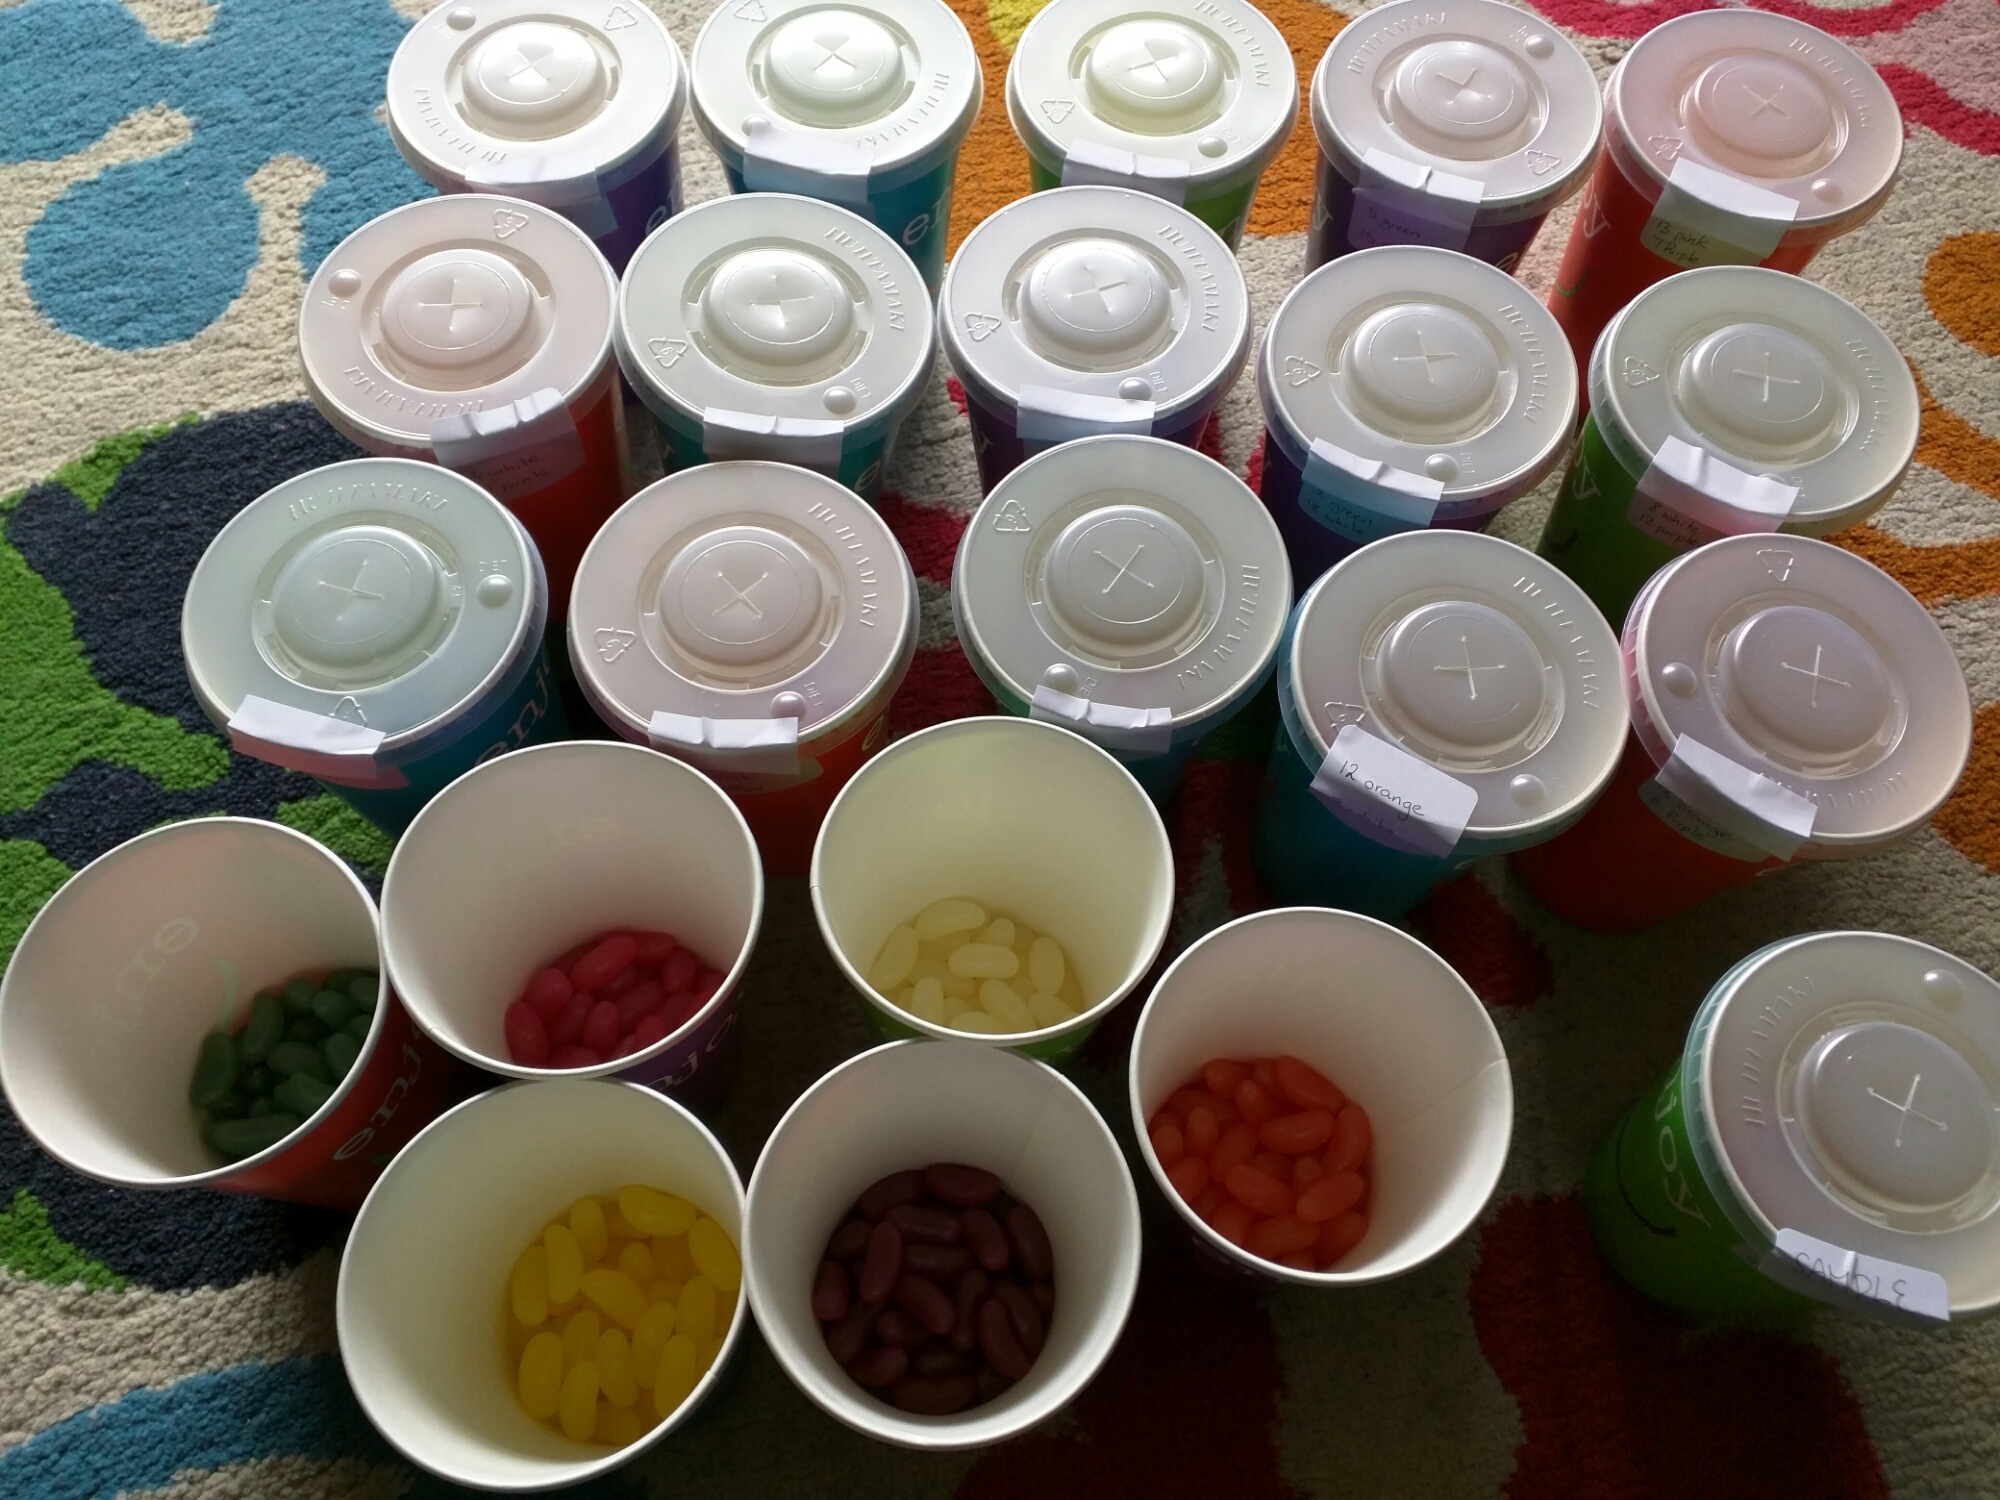
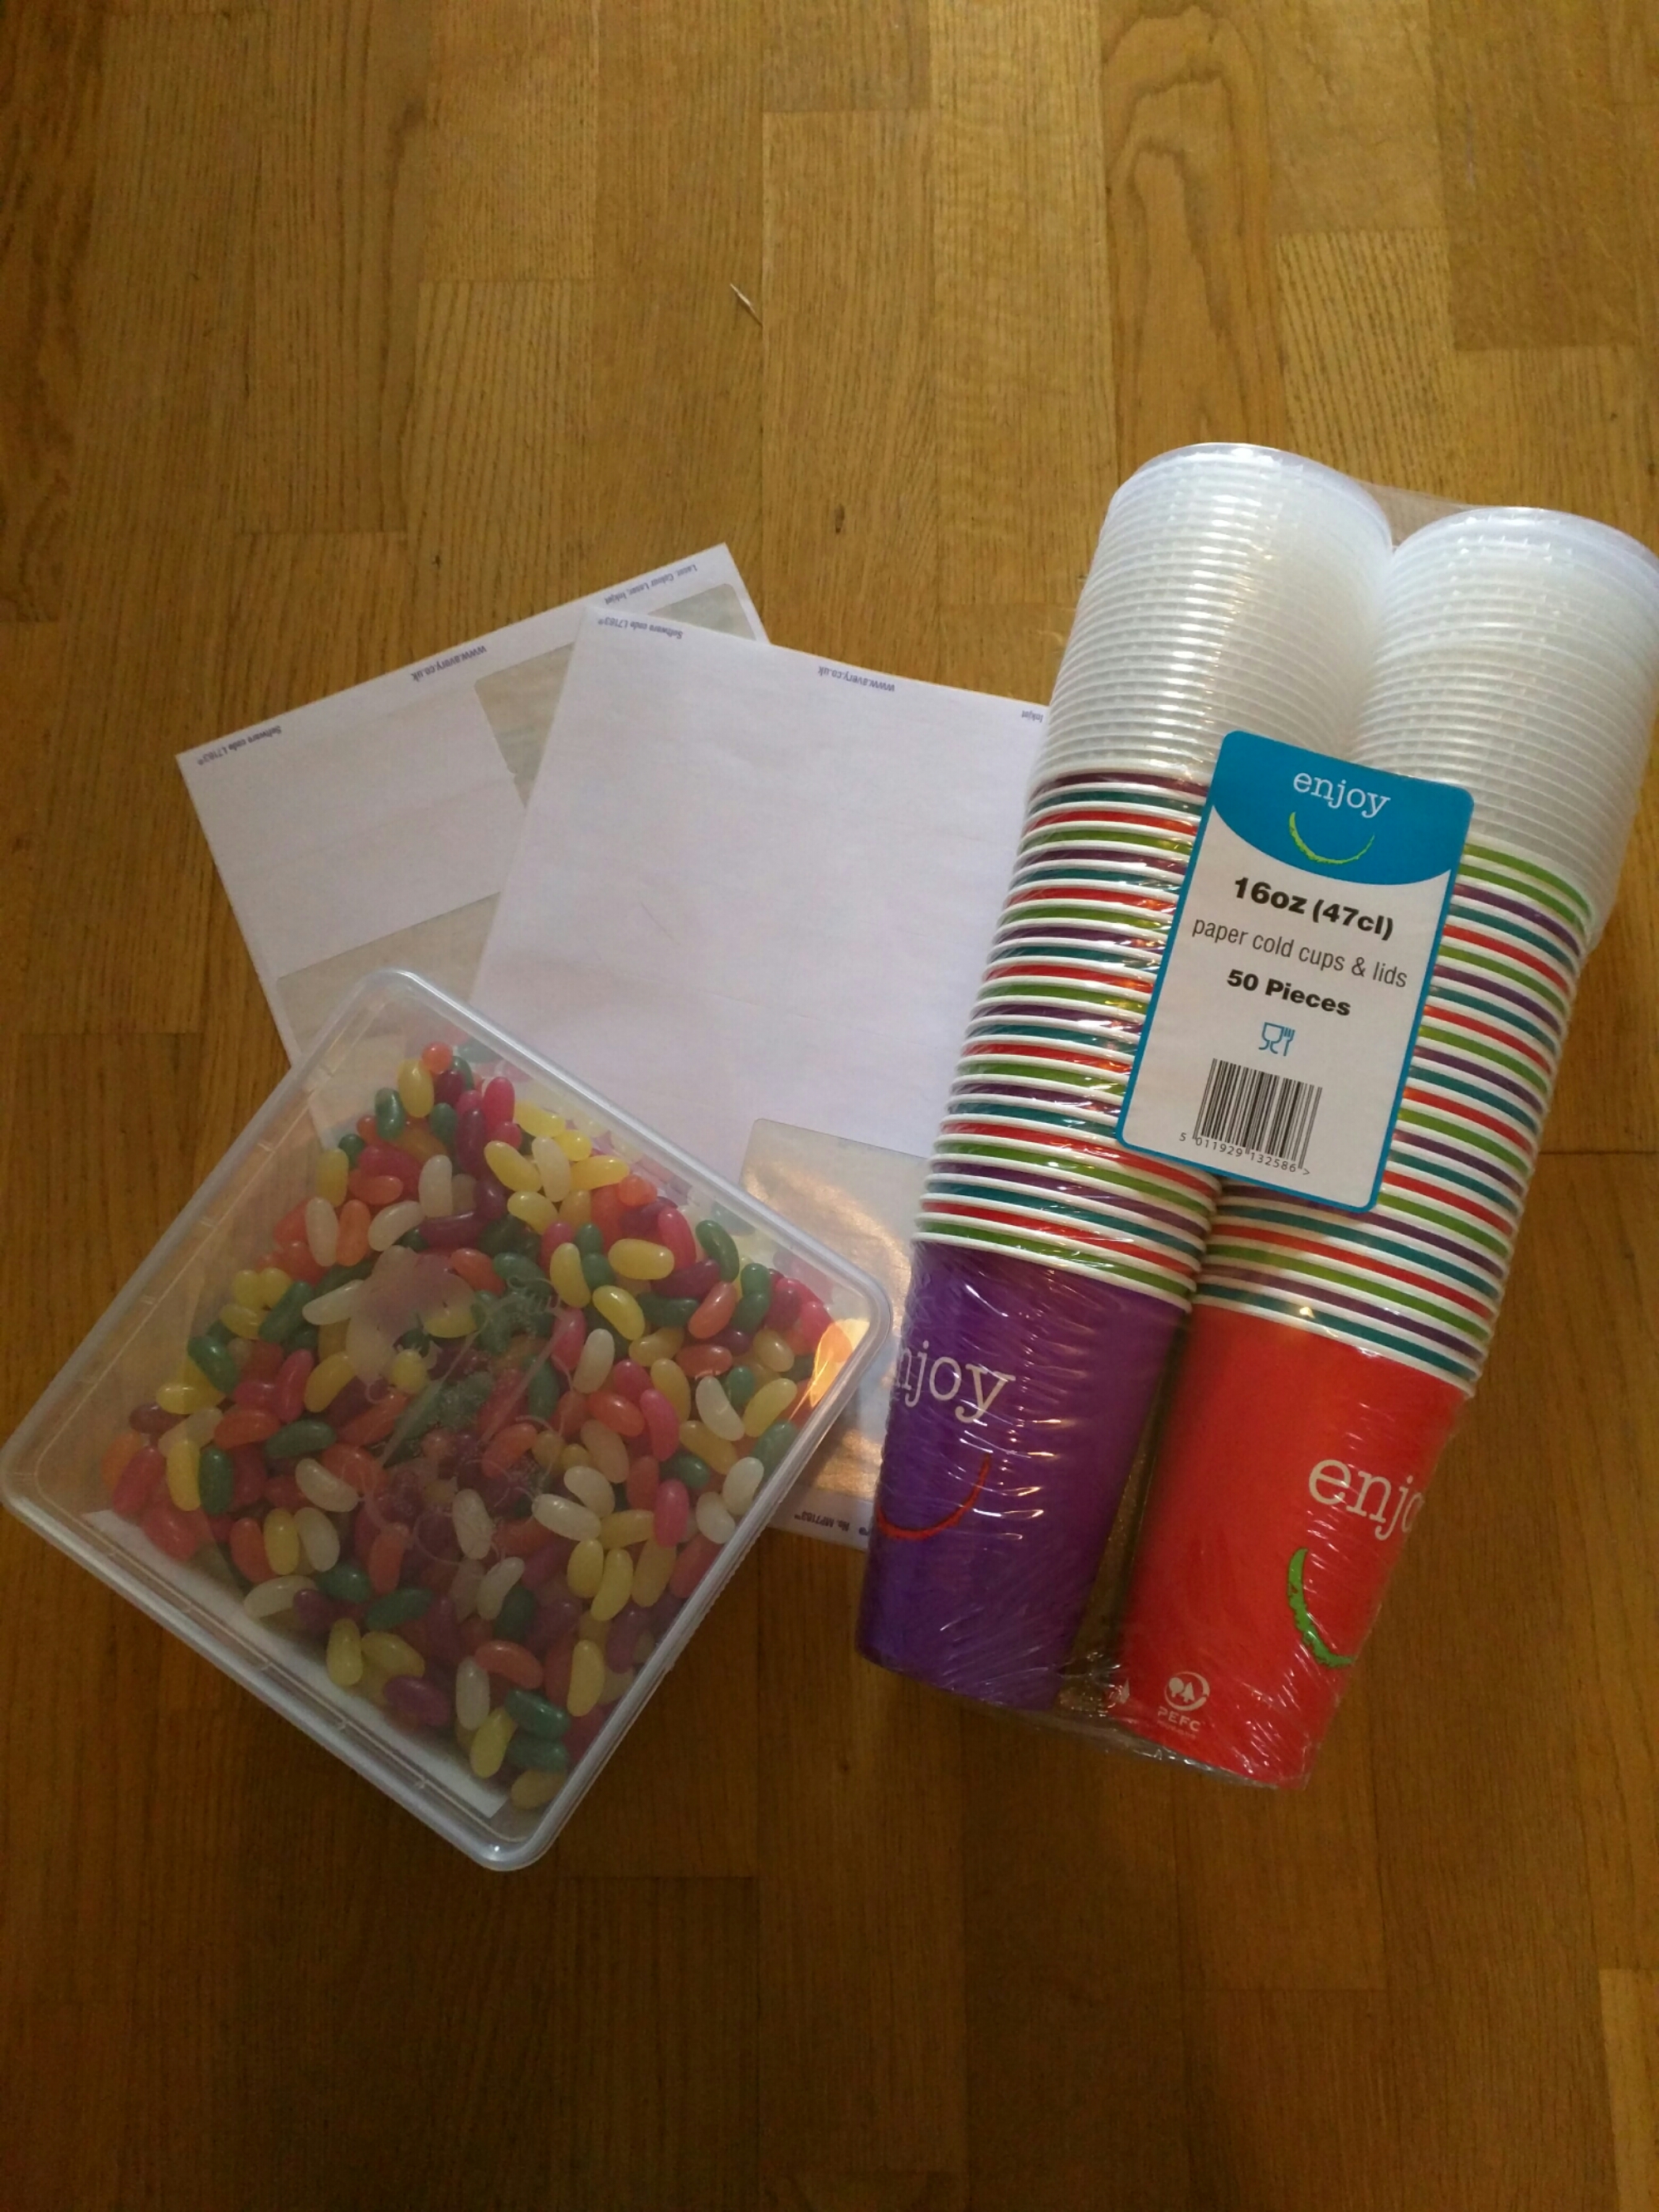
How on earth can you create a maths lesson using these items?

image

Well, first sort them into colours, then put twenty jelly beans into each cup. Make sure there are only two colours in each cup, write the contents on a sticky label and use that to seal the cup. Each cup should have slightly different numbers or colours – it prevents copying.

Note: Eat all the orange jelly beans – you’ll be doing your dignity a favour!

image

Have you figured it out yet? No? We’re doing probability tree diagrams without replacement. Now I know you could do this with one experiment at the front of the class, but getting everyone involved means it’s more hands-on and memorable.

The Experiment
I did a demonstration of this on the board first, before handing out the cups and worksheets. I told the class what was in my cup and picked out a jellybean. It was orange. I drew the first stage of the worksheet (see below) on the board: What was the experiment? How many of each colour do we have? What is the probability of each colour? Then we filled in the first stage of the tree diagram.

I ate the jellybean.

But you can’t do that – it messes up the experiment! I asked what would be the probabilities for a second jellybean now. They figured out the slight change to the probabilities. Then we went back and thought about what would have happened if my first jellybean had been lemon.

I always encourage students to work out all the possible outcomes before they even look at the rest of the questions. And this is why you need to eat all the orange – the list on the board was:

  • P(LL) =
  • P(LO) =
  • P(OL) =

Do I really need to put the last one?

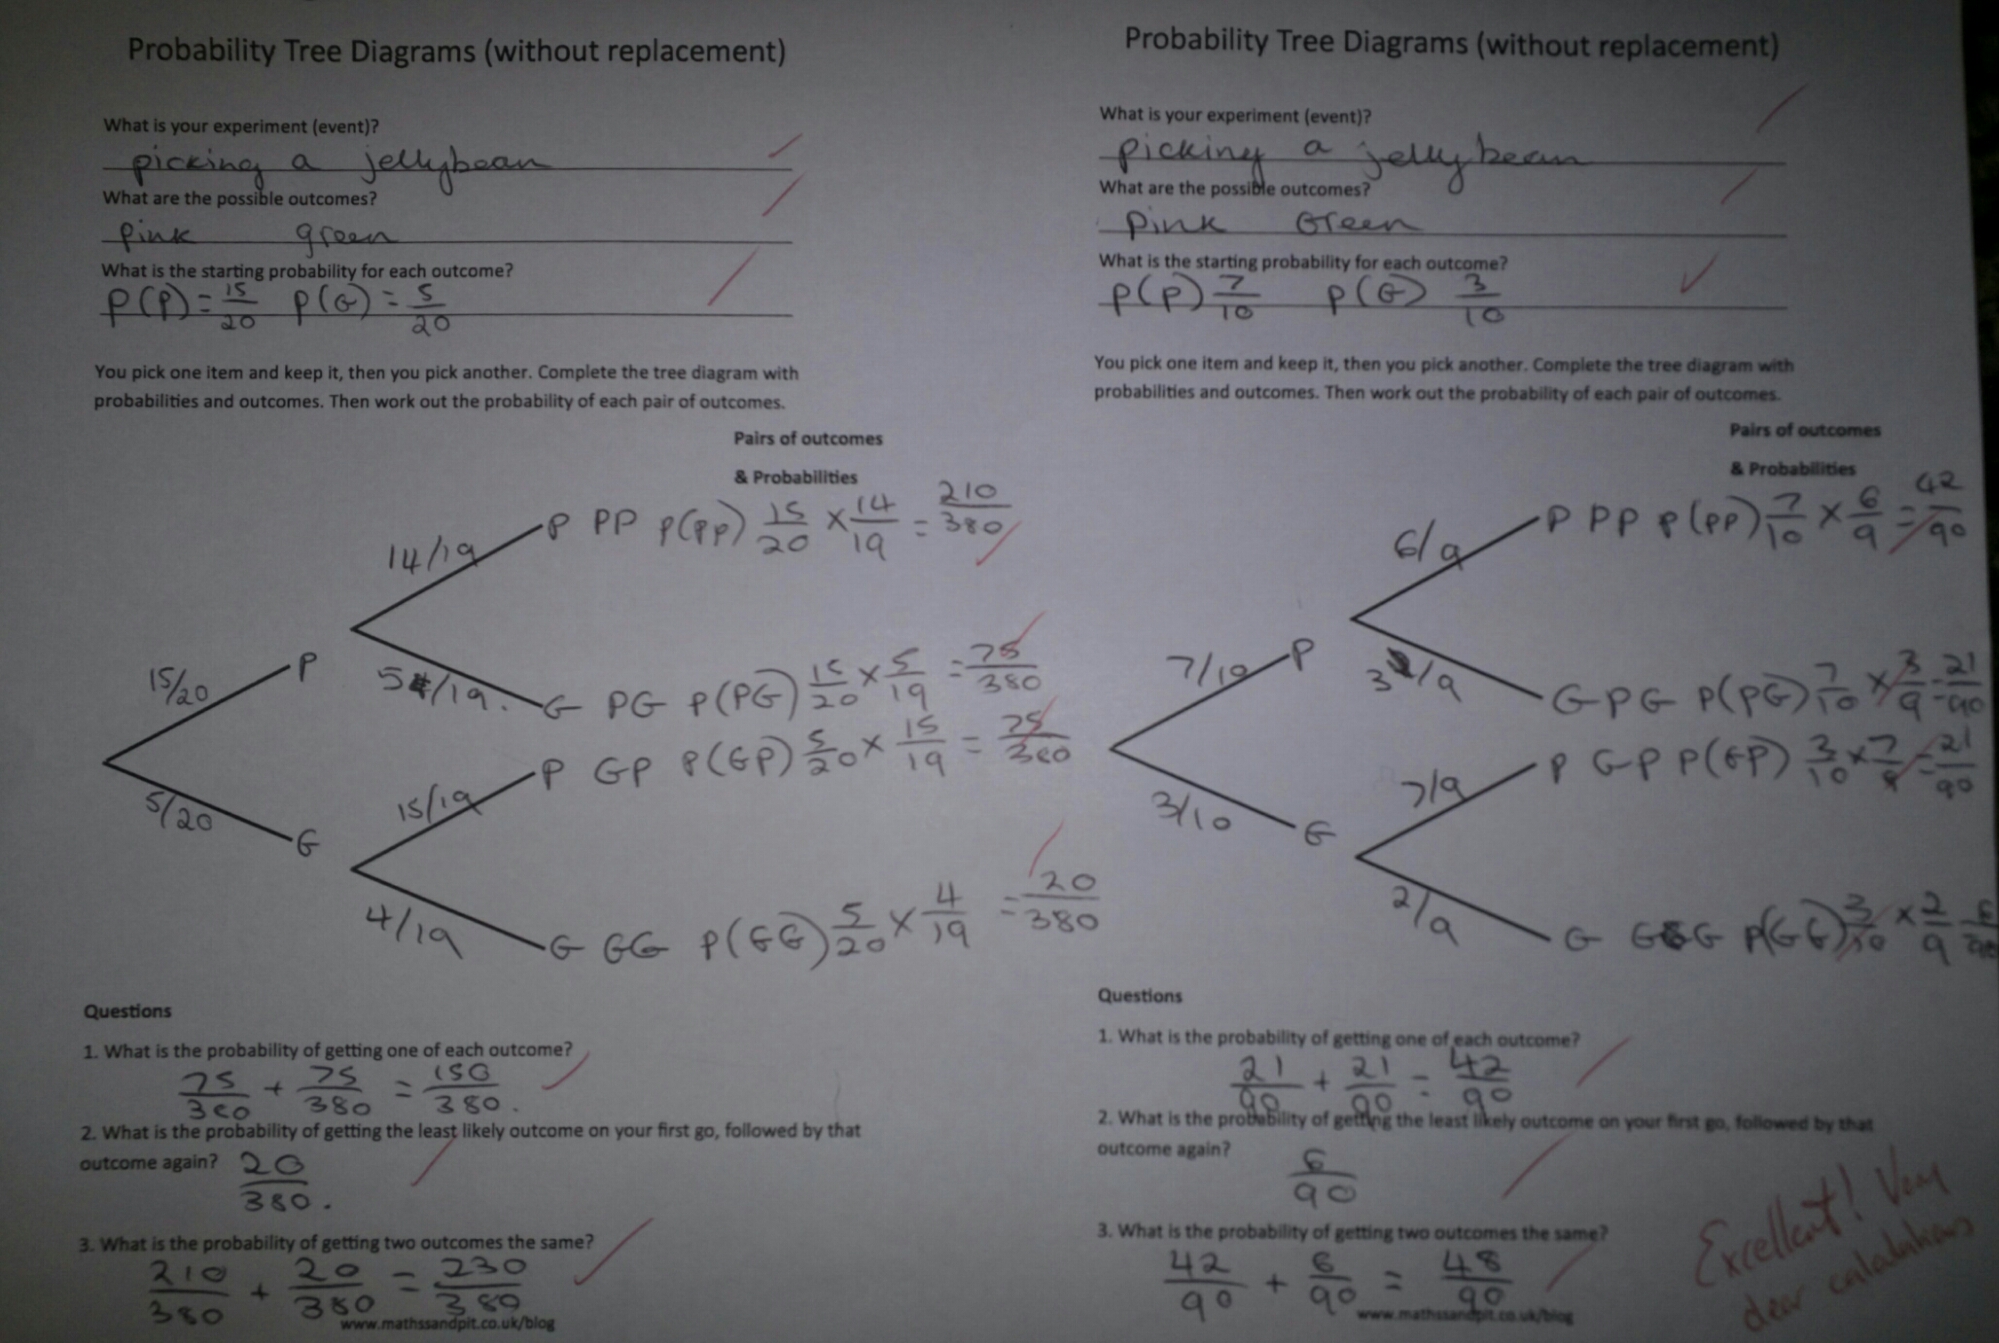
After much giggling, the class were let loose with their own cups. They did the experiment once with their standard cups and then had their work checked. They could then alter (eat) the contents of their cup so that a minimum of five beans of two colours remained. You can see an example of a student’s work here:

image

I summarised the lesson by looking at different types of probability problem where items are not replaced. I now have a nice ‘hook’ to refer to when discussing probability tree diagrams without replacement.

Download the worksheet here:
Tree diagram without replacement (pdf)
I printed out two per page as it fitted nicely in their books. The descriptions are deliberately vague to allow it to be used in different experiments.

(The usual warning regarding food allergies and beliefs stands. Some jellybeans have animal derivative gelatine – please check, you don’t want to accidentally upset a student)

291. Elves and Trees

elf-clip-art-elf1

Image credit: www.clipartpanda.com


Here is a quick festive probability resource for you covering elves, outcomes and tree diagrams. The task starts with logically listing outcomes, before looking at working with tree diagrams in the extension.

Elves outfits tree diagrams (pdf)

282. Round the Venn

My next class neighbour, Mr D, has been evangelising about venn diagrams since he did the TAM (Teach A-level Mathematics) course. His lesson on equations and graphs using venn diagrams was brilliant! Then, at MathsConf5, Craig Barton (@mrbartonmaths) shared his love of venn diagrams.

And they are on the new english GCSE Maths syllabus.

In light of all this, I introduced venn diagrams as a vehicle for probability (Y10) and rounding (Y9).

Introduction

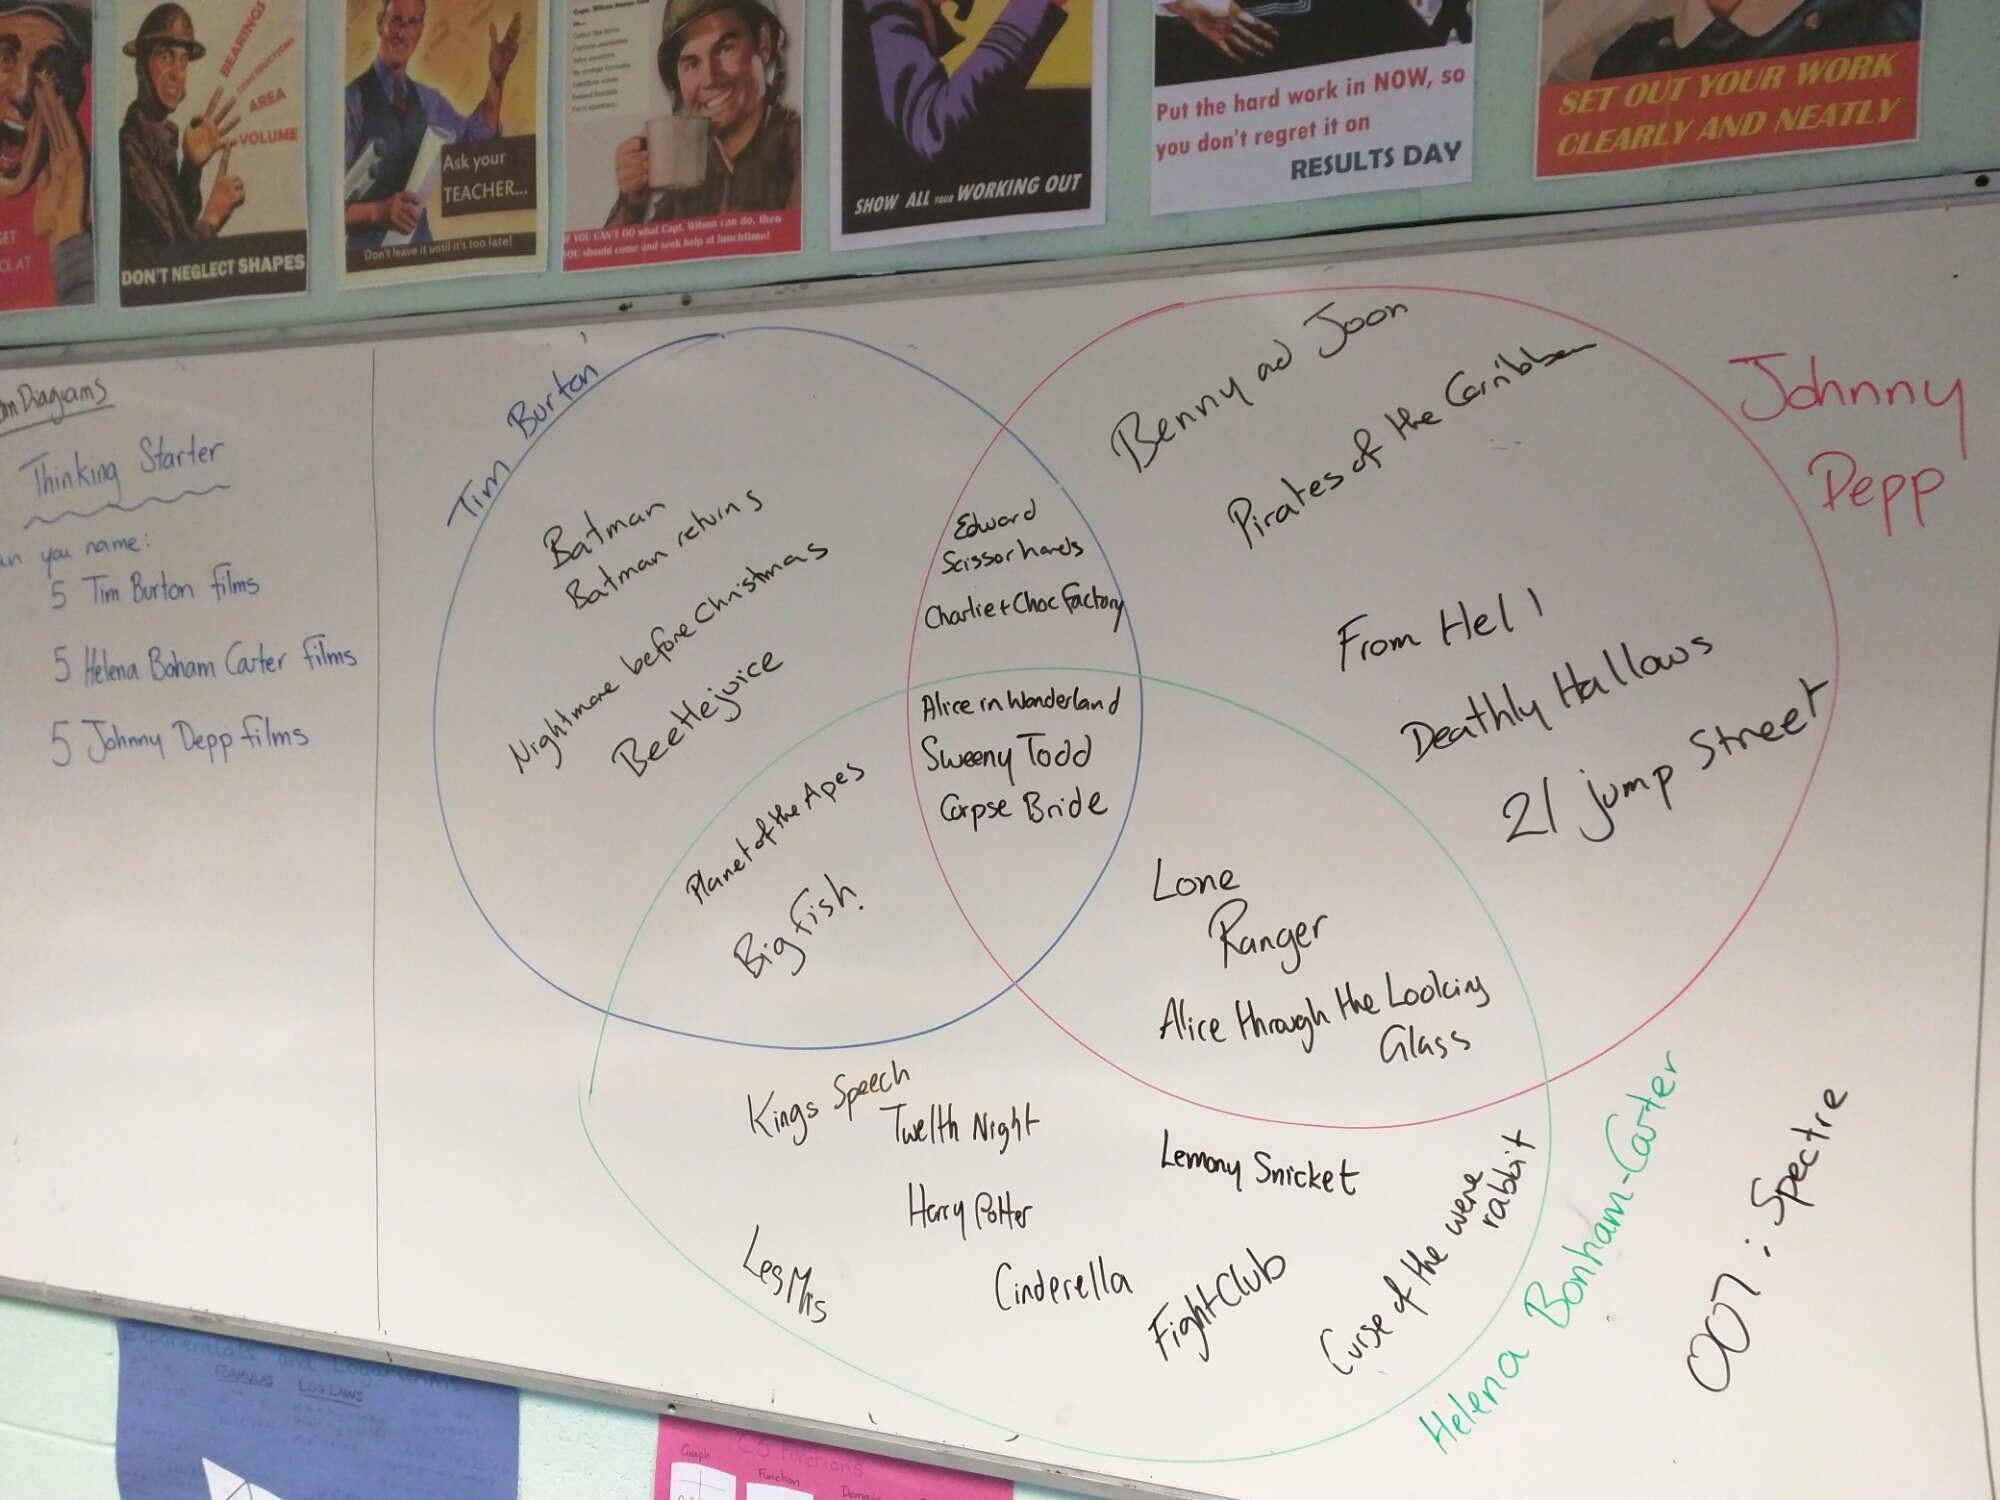
First of all I used the films of Tim Burton, Johnny Depp and Helena Bonham-Carter to introduce a triple venn diagram, with the box to represent everything – I like dropping in the proper forms or technical bits early on in all topics.

image

We had quite a lengthy conversation about films, including why the Bond film could be on the diagram. The discreet use of IMDB (with my permission) settled some arguments too!

Rounding

I wanted my Year 9s to consider the differences and similarities between different forms of rounding. I created a simple diagram for them to complete where they compare ‘nearest ten, ‘one decimal place’ and ‘two significant figures’. You can download it here:

Rounding Venn Diagram worksheet

Probability

For my probability lesson I used the probability PowerPoint by Craig Barton. You can link to his resources here:

Mr Barton’s venn diagram resources

185. I’ve lost a Dime


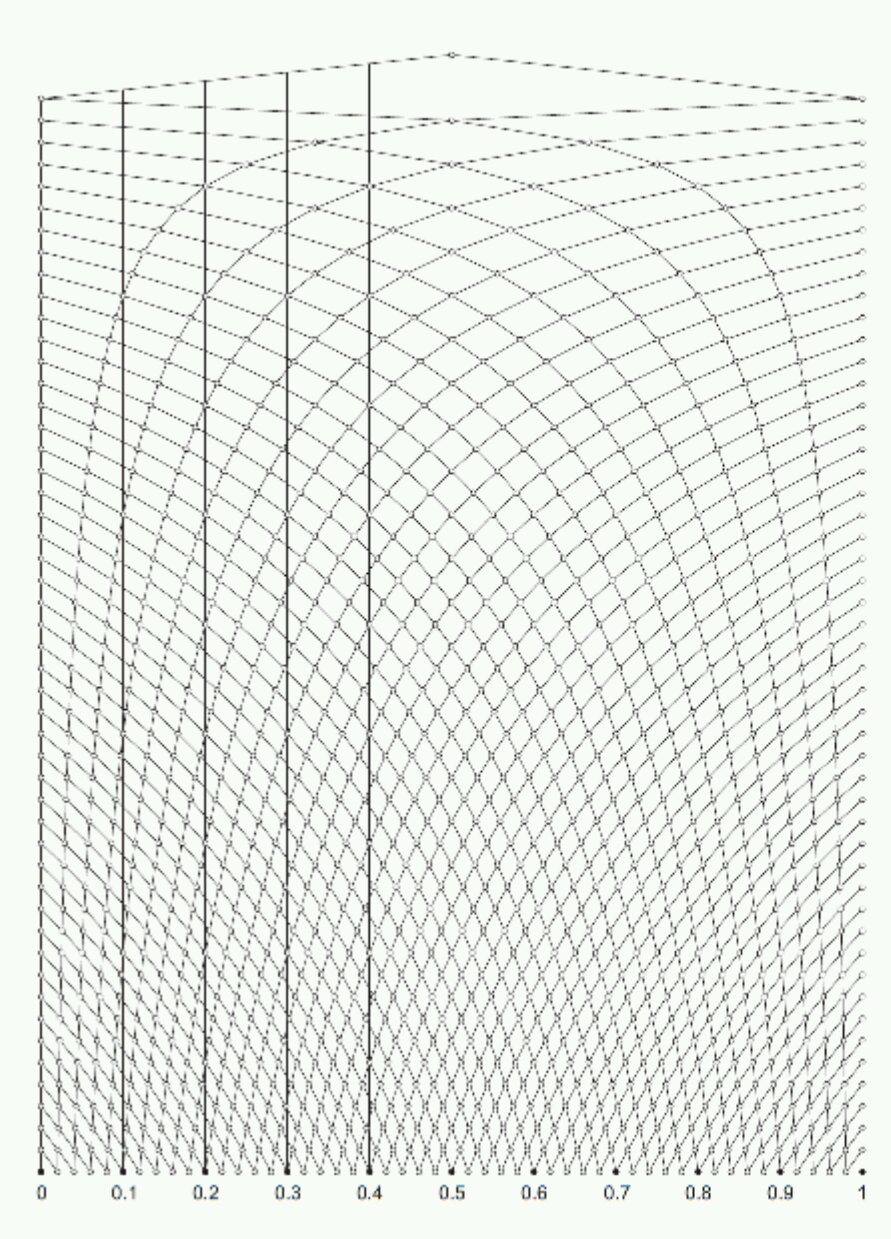
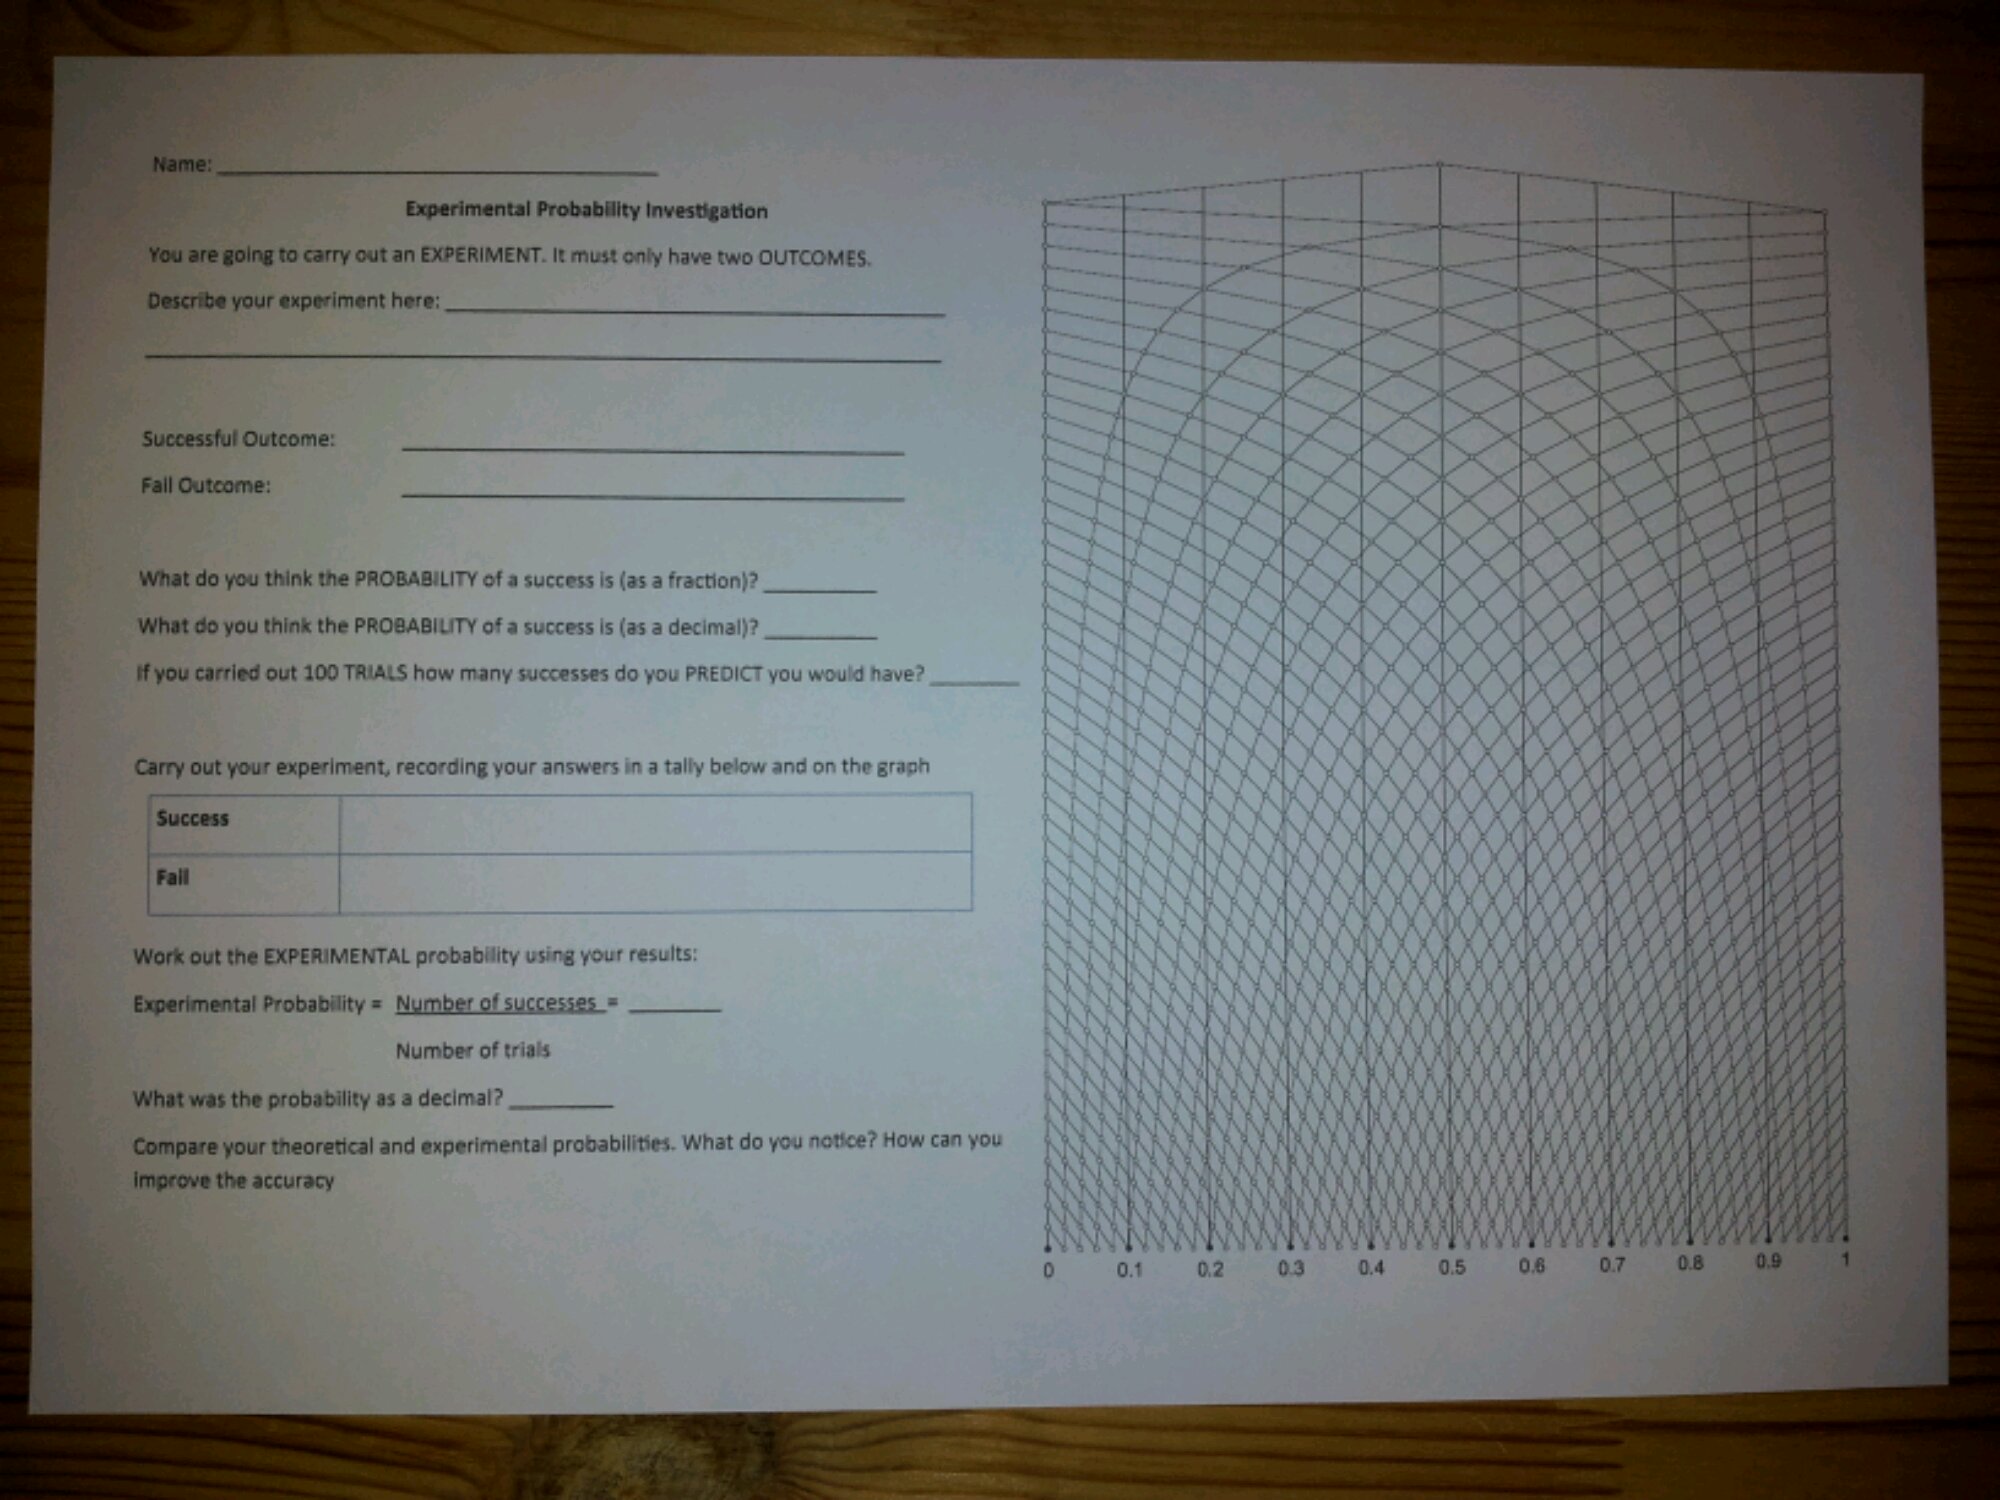
I haven’t actually lost a dime, rather I’m missing a Dime – specifically the second Dime probability pack. It was a great teaching resource for experimental probability from the first school I taught at. Unfortunately it is no longer available, although it is listed on the Tarquin archive site. Each student had a plastic tube with different coloured beads, a related experiment card and a record card. They could investigate the meanings of key vocabulary, carry out repeated trials and use this amazing graph paper, designed by Geoff Giles, to record results:

image

The graph paper works a little like a bagatelle or pinball machine. You start at the top ‘pin’. A success means move along the line to the next pin on the right, a fail means move to the left. You always move in a downwards direction. The more trials that are recorded, the further down you go. When you reach the bottom you will have carried out 50 trials and will be able to read off the experimental probability as a decimal. I found this blog (medianchoices of ict) with links to the Nrich website and interactive probability graphs. The graph paper from the Nrich site is here: RecordSheet.


Activity

I decided to recreate the old Dime investigation sheets:
image

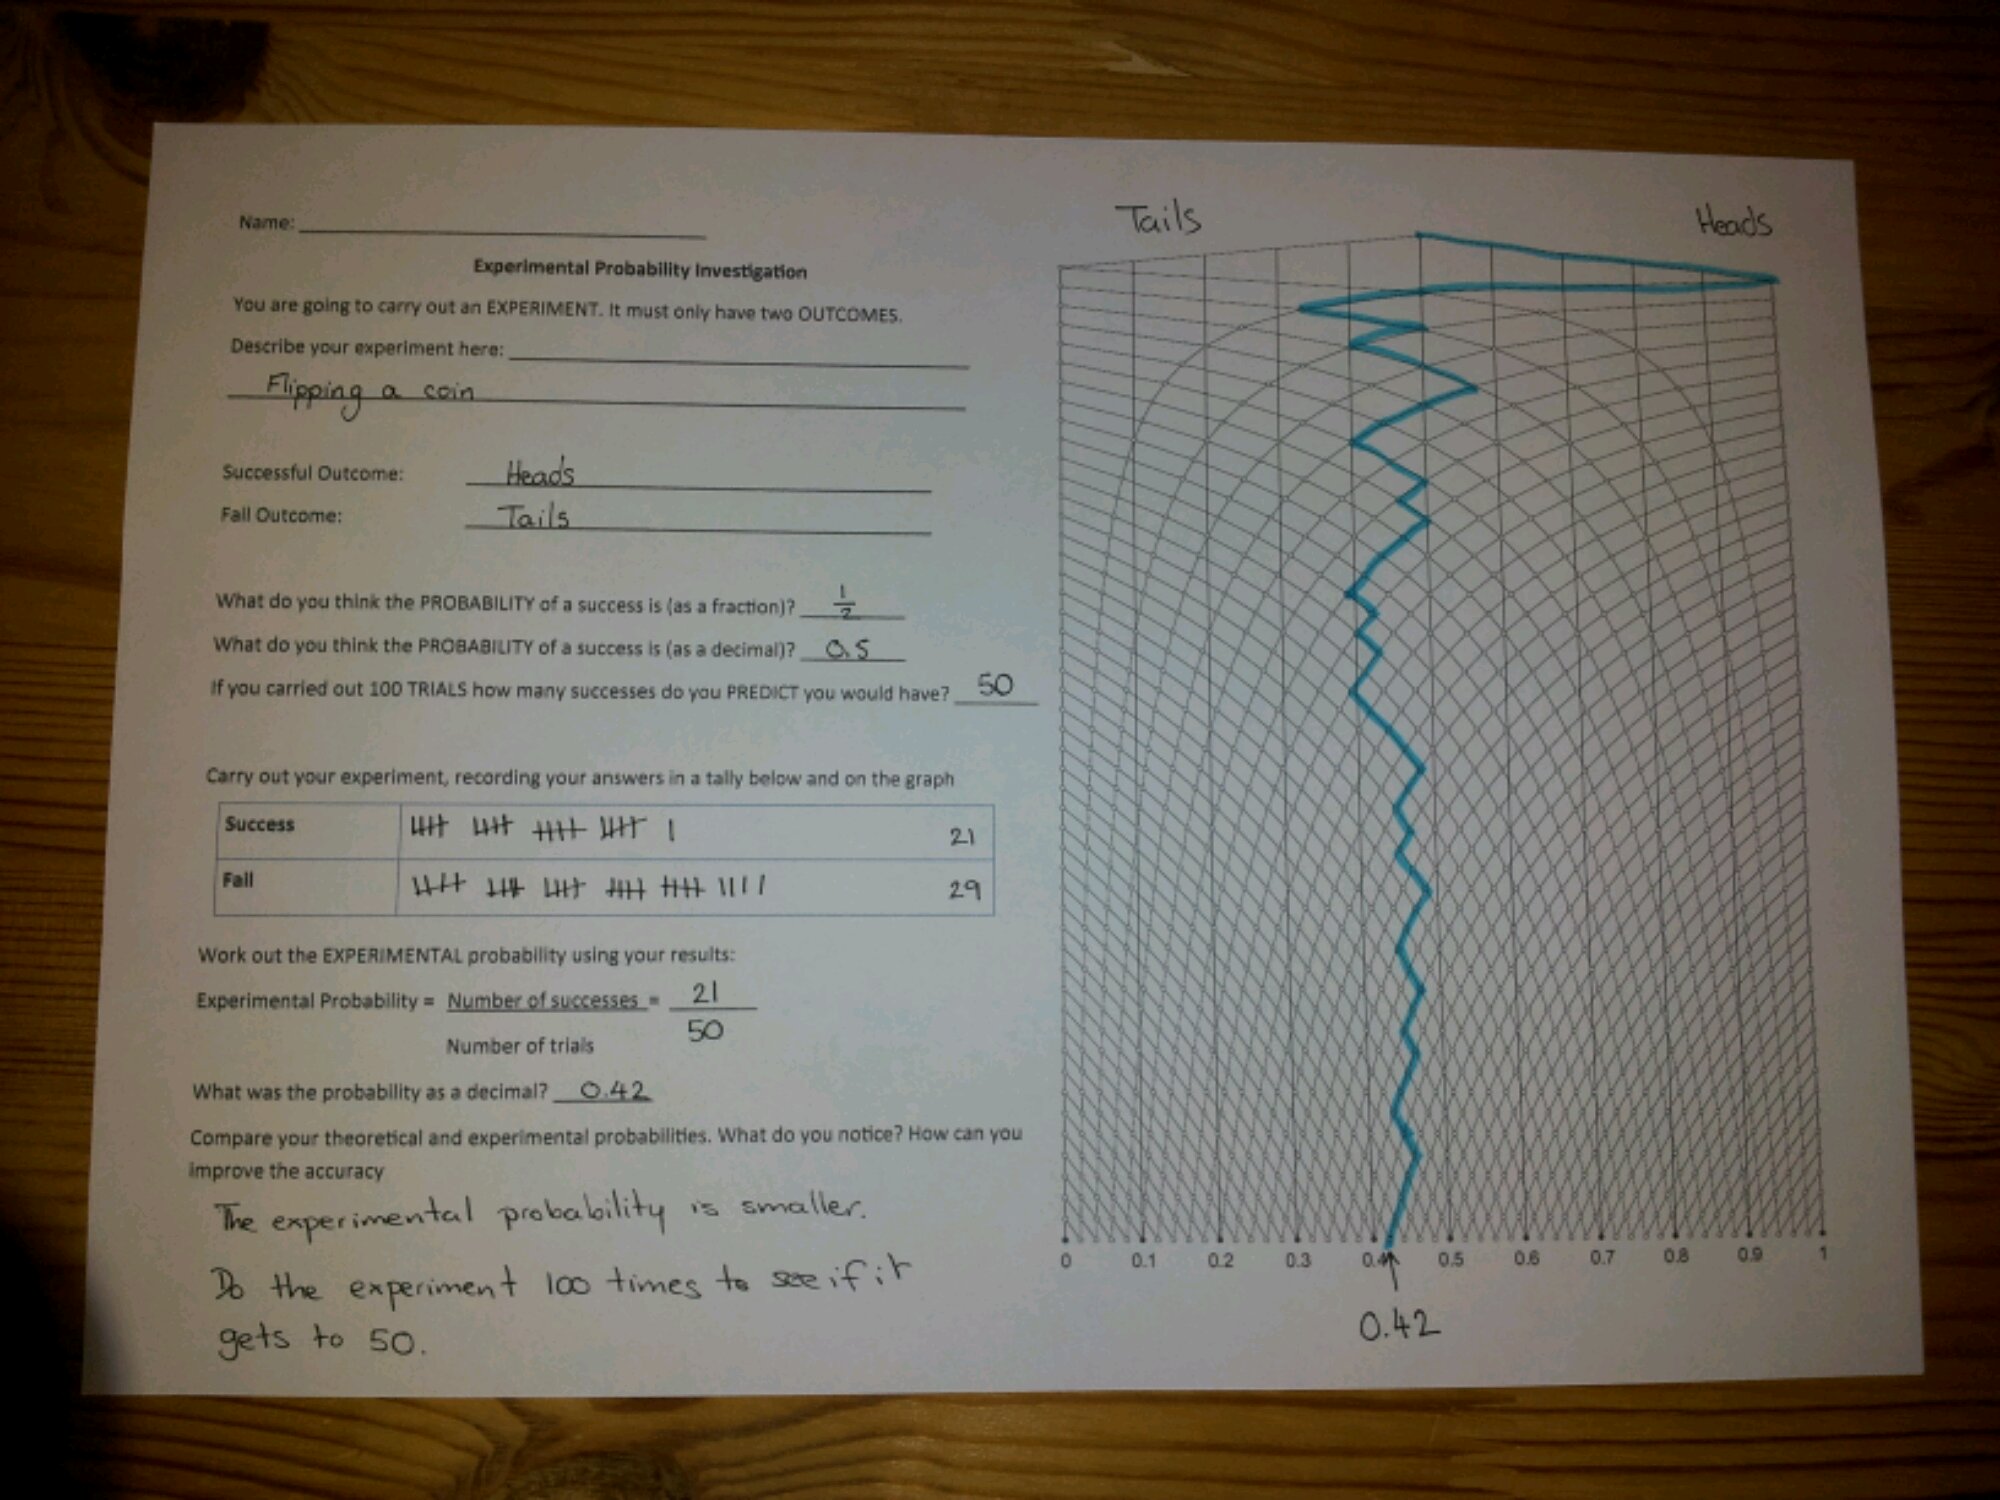
Students start by explaining what their experiment is and define what is a success/fail. They give the theoretical probability as a fraction and decimal, then predict the number of successes in 100 trials.


Students then carry out their experiment, recording their results in the tally chart and graph. After 50 trials, they write down the fractional experimental probability of success using the tally total and the decimal probability from the graph – hopefully they are the same! Students then reflect on their work and consider how to improve their results.

Download the worksheet here: Experimental Probability investigation

Sample

image

71. Algebra with a dash of probability

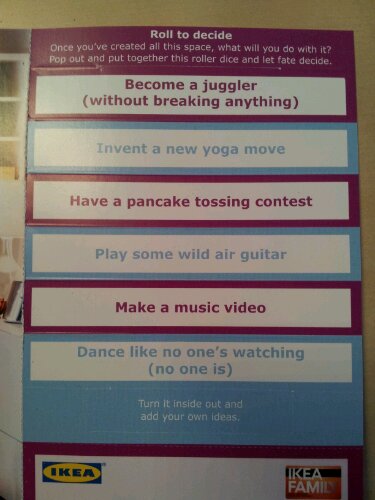
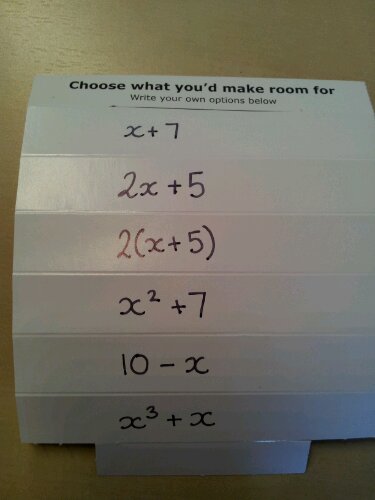
If you are on the Ikea Family mailing list you may have got a booklet with this a few months ago:

image

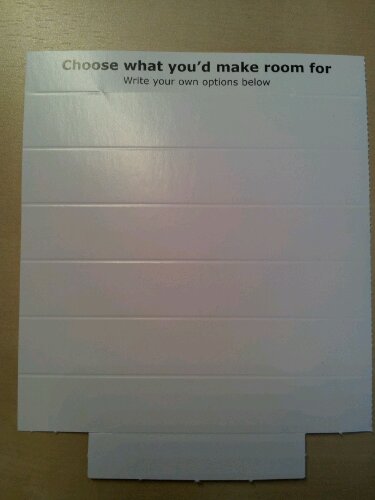
It’s basically a decision spinner in the form of a hexagonal prism. On the reverse you are asked to customise it:

image

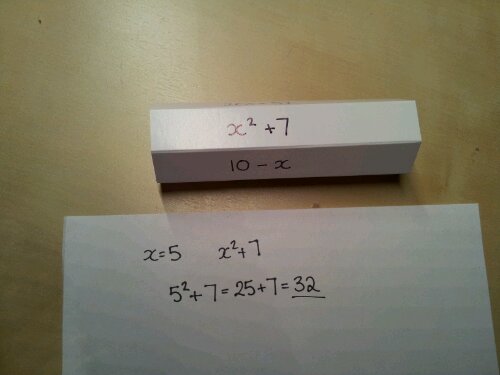
Being a maths geek I thought about writing algebraic expressions. You can customise the difficulty for individual pupils.

image

All the pupils do is roll a standard die and the prism. Then they substitute that value into the expression.

image

You can increase the difficulty by using a variety of non-standard dice.

Construction
All you need is a strip of card – say 12cm long and some tape.
Rule off every two centimetres, fill in the gaps, fold and stick.

Probability
There are two probability questions to consider:

Bias
Is the roller fair?

The Ikea one wasn’t due to the cardboard flaps weighting one side. Over-enthusiastic taping could have a similar effect.

Outcomes
How do you know when you have had all the possible combinations of number and expression?

This could be a nice way to think about listing outcomes and sample space diagrams.

Once you start thinking of ways to use these dice rollers, it is amazing how many topics you could cover.

34. The Dancing Cipher

A different way to look at data and probability is to introduce letter frequency analysis.

image

I set pupils the task of finding out the letter frequency data for the english language. Not much of a challenge for a bright student with the internet.

However …
I then gave them four A4 sheets of symbols to decode. Literally four pages of code, with no hints except they had to determine two literary works and authors from it. They had two weeks to solve it.

In hindsight, they described it as the best homework ever. I had parents contact me to see if they had solved it correctly – not to help their child, they were in competition to see who would get it first!

How to do it
Pick a text which is freely available on the internet – it saves typing out pages of text. I chose ‘Through the Looking Glass’ by Lewis Carroll – lots of interesting words!

I found a great website which gives you the Dancing man cipher amongst others. You paste in your text and select your substitution cipher. It then encodes your text for you. I chose the Dancing Man as it was the second literary work: The Adventure of the Dancing men (A Sherlock Holmes story)

I pasted this into Word and this formed the homework.

The interesting thing about this substitution cipher is that it has 52 symbols and no spaces. It is tricky to cheat as you would have to know the name of the cipher and the full cipher was not published in the book. There is more than one variation of the code as different people have tried to fill in the missing symbols.

Classics
This task ticks all the boxes for data processing, coding, independent study and literacy. In fact several pupils came back and said they had read Conan-Doyle’s classic work as a result of a maths task.