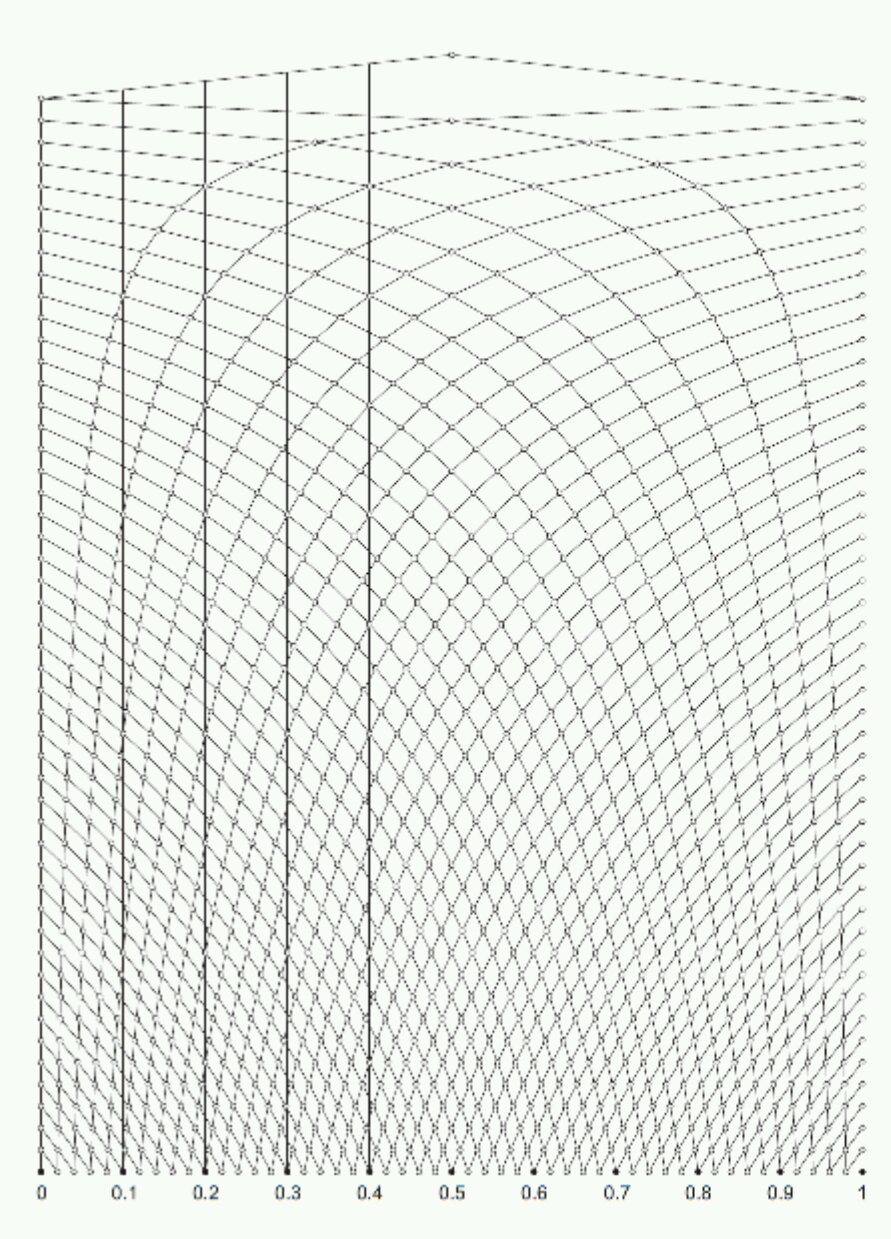
I haven’t actually lost a dime, rather I’m missing a Dime – specifically the second Dime probability pack. It was a great teaching resource for experimental probability from the first school I taught at. Unfortunately it is no longer available, although it is listed on the Tarquin archive site. Each student had a plastic tube with different coloured beads, a related experiment card and a record card. They could investigate the meanings of key vocabulary, carry out repeated trials and use this amazing graph paper, designed by Geoff Giles, to record results:
The graph paper works a little like a bagatelle or pinball machine. You start at the top ‘pin’. A success means move along the line to the next pin on the right, a fail means move to the left. You always move in a downwards direction. The more trials that are recorded, the further down you go. When you reach the bottom you will have carried out 50 trials and will be able to read off the experimental probability as a decimal. I found this blog (medianchoices of ict) with links to the Nrich website and interactive probability graphs. The graph paper from the Nrich site is here: RecordSheet.
Activity
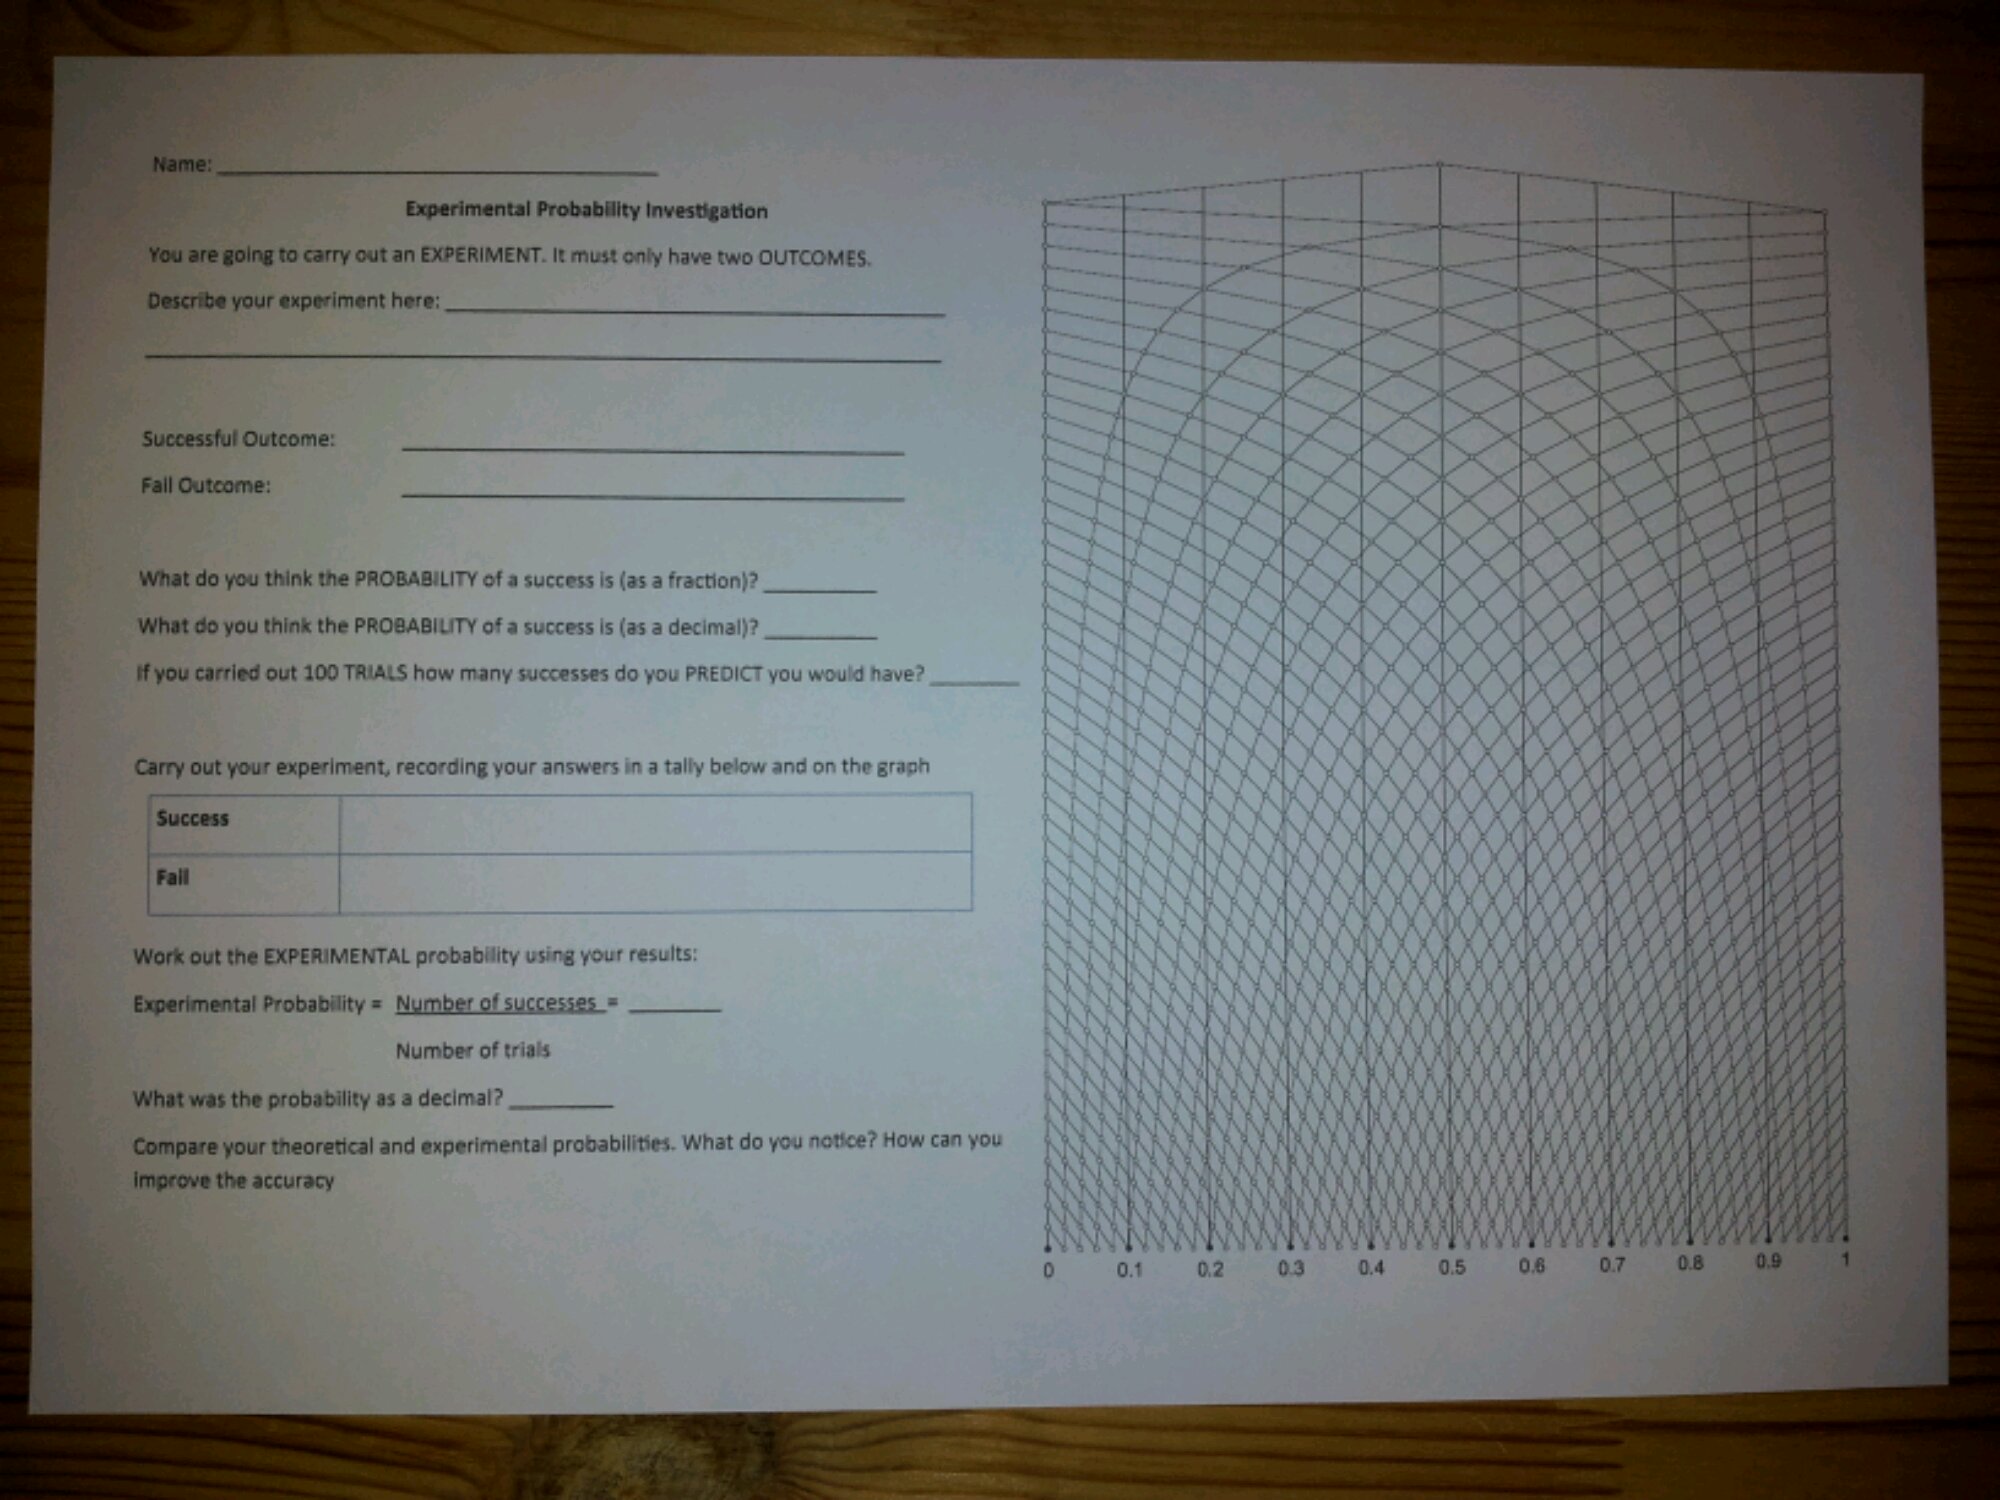
I decided to recreate the old Dime investigation sheets:

Students start by explaining what their experiment is and define what is a success/fail. They give the theoretical probability as a fraction and decimal, then predict the number of successes in 100 trials.
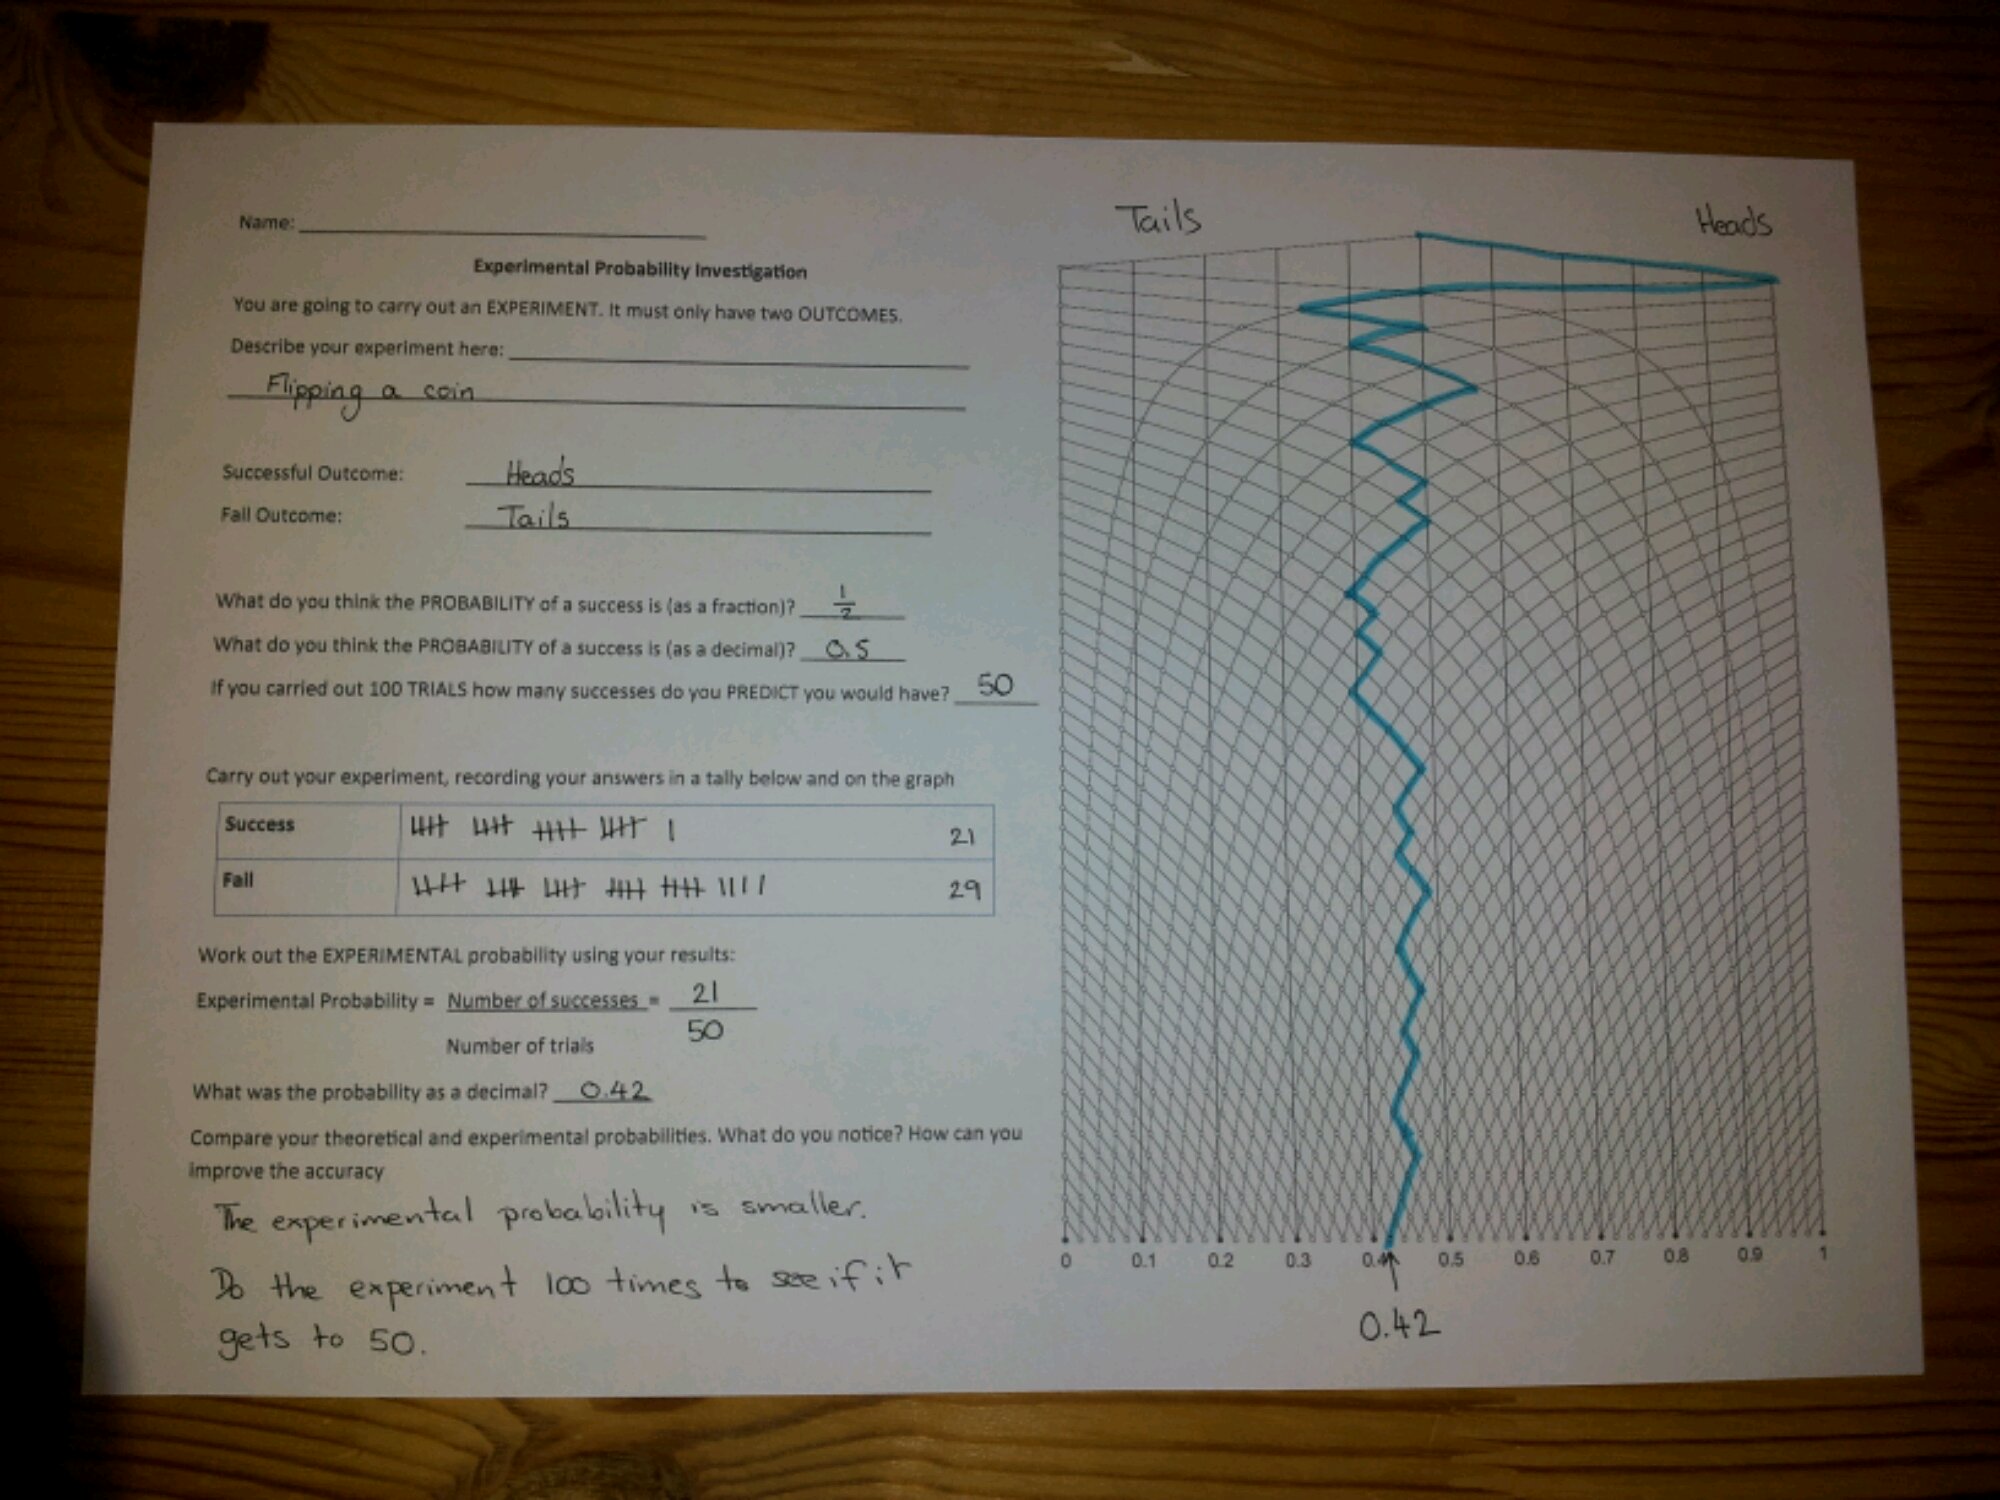
Students then carry out their experiment, recording their results in the tally chart and graph. After 50 trials, they write down the fractional experimental probability of success using the tally total and the decimal probability from the graph – hopefully they are the same! Students then reflect on their work and consider how to improve their results.
Download the worksheet here: Experimental Probability investigation
Sample


