Tag Archives: mean

308. Zombie stats

I’ve used word length analysis for years as a source of comparative statistics. The concept is easy – you take a children’s book and a grown up book and compare the word lengths of the first 20, 40, 80 words. After you collect the information in a table, you can use this data to compare averages and the range.

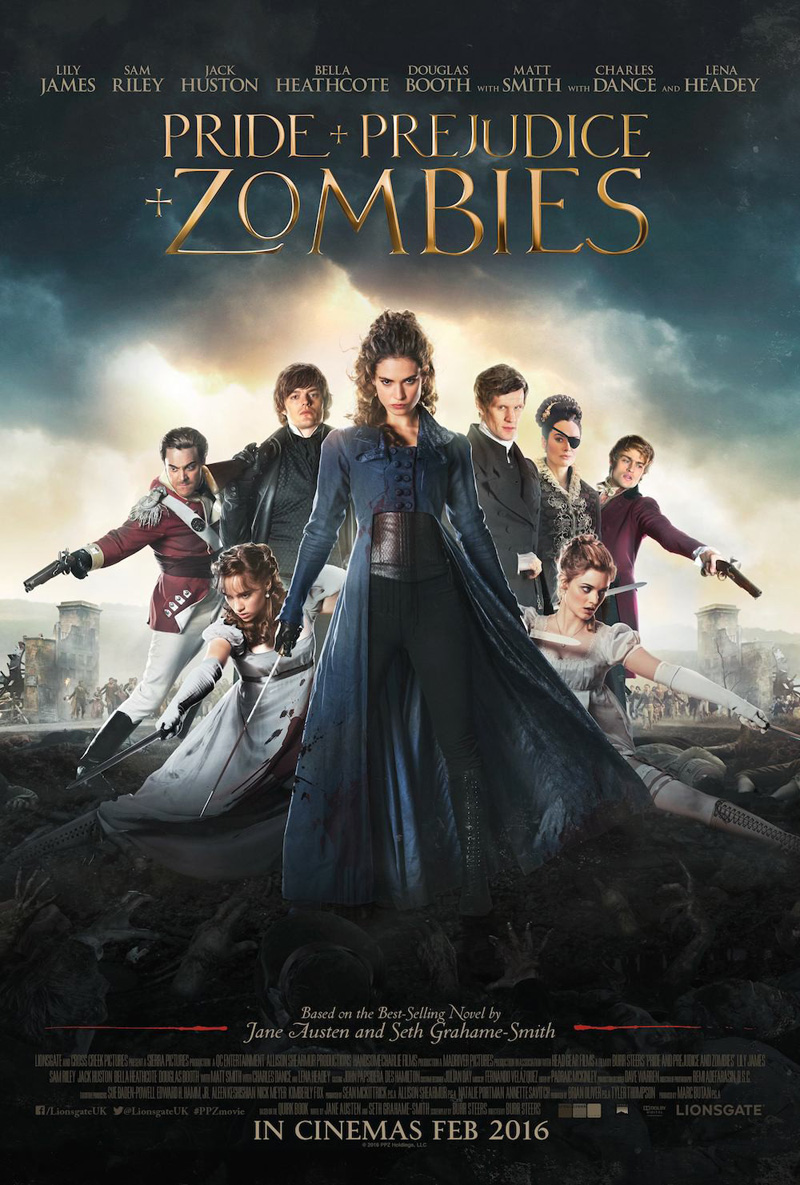
Image credit: www.comingsoon.net
But what texts to use? Well – you can’t beat a bit of Dr Seuss, but what grown up text could you use. I can highly recommend this extract from ‘Pride and Prejudice and Zombies’:

Pride and Prejudice and Zombies by Seth Grahame Smith

Not only will you be investigating mathematical concepts, but you might just be inspiring a student to pick up a book and read.
Update: If you use the first chapter (say thirty words) of ‘Pride & Prejudice & Zombies’ you get some interesting data. The range is wide, but the highest frequency word length is just two. It’s a great conversation piece – why does this happen? The language is a very precise parody of 19th prose with all the correct connectives and no contractions eg ‘it is’ not ‘it’s’.

247. The Elf Challenge

It was the month before Christmas and all through the house not a creature was stirring – except for the senior elves who were on the brink of all out war. Father Christmas had picked up some leadership strategies on his travels and decided to send his management elves on a team building day … paintballing!

Don’t be fooled – this is no simple Christmas time-filler. This task requires problem solving strategies, two-way tables, averages, data analysis and logic. In fact, you might want to have a go yourself. There is a task sheet, support sheet and solution.

The Elf Challenge (pdf)

Enjoy the puzzled faces and watch the arguments when students try to justify their answers.

243. Messy Means

I have recently been teaching lower ability Year 9 students how to calculate the mean from grouped and ungrouped data tables. I didn’t want to teach them a method to learn by rote, so I used a more investigative approach.

mr-messy-mykea

Image Credit: http://www.thisismykea.com/designs/mr-messy

Grouped Frequency tables discussion

Estimated messy mean A (pdf)

I started with a table with all the working shown, but some information blacked out. Each group had an A3 version and they filled in what was missing.

Estimated messy mean B (pdf)

The second table had more information covered up. After a discussion the groups decided there wasn’t enough information and they would have to guess what the missing numbers were.

Estimated messy mean C (pdf)

The third table had minimal information. Each group used their own method to find the missing values. Some chose the largest value in the range, some guessed what the results could have been in each group and one group decided to calculate two means – one using the largest value and one using the smallest.

We collected our results together on the board and discussed their accuracy. The class decided to use the middle of each range to calculate the estimated mean. They had gone from no understanding of estimated mean to formulating their own method.

We followed this up a Splitting the Steps estimated mean worksheet that I wrote after seeing Bruno Reddy’s presentation after #MathsConf2014 (Mr Reddy’s blog).

Follow him on Twitter: @MrReddyMaths


221. The ‘Average’ wage

Here’s a problem on averages that has been used by many teachers over the years. I like the additional ‘sting in the tail’ as it really makes pupils think about real life and it is an instant use of calculating the mean from an ungrouped frequency table.

hiring

Image Credit: www.vivcorecruitment.co.uk

The Problem
A job advert says that the average worker at OfficesRUs earns over £30 thousand pounds.

OfficesRUs Salaries:

  • Director   £100,000
  • Manager   £50,000
  • Sales Person   £35,000
  • Clerical Assistant   £22,000
  • Trainees   £15,000

Is the advert true?

The Discussion

If pupils calculate the mean they will find it is £44,400 – this makes the advert true

But why would a company have the same number of employees at each pay grade?

The Sting

OfficesRUs is a clerical agency, offering temporary clerical staff for other businesses. Their staff numbers are:

  • 1 Director   £100,000
  • 4 Managers   £50,000
  • 8 Sales People   £35,000
  • 200 Clerical Assistants   £22,000
  • 4 Trainees   £15,000

Is the advert still true?

The Result

My class worked out how much each pay grade would get and added them to find the total salary cost. Some pupils then divided by 5, but discovered that the mean would be far greater than the Director’s salary. They then realised they had to total up the employees too. The mean turned out to be less than £30,000. This then leads to a discussion of which measure of average is best in this situation.

This is the working out from my board. The original problem is in black, with the sting and working in red. We linked the individual pay grade calculations to the work we had done on means from ungrouped frequency tables. The layout of the calculations is very similar to our tables.

image

This  was a really good investigative starter to bridge between a theory and problem solving lesson. You could get pupils to see if they can find any examples of job adverts with average salaries in and make up their own problems.


197. £40.95

Today we have a discussion starter question for you, inspired by a trip to the shops.

image

My shopping cost £40.95 today. What is the smallest number of coins required to make this amount?
If I paid with two £20s and a £10 note, what is the most efficient change?
Why would someone pay £41.05, as opposed to £41?

I purchased 17 items, do you have enough information to calculate the mean?
The most expensive item was £10, the cheapest was 45p. What does this allow you to calculate?
Two luxury items cost £9 in total. If I hadn’t bought these, what would the mean have been? Does this effect the range?

When I paid I was given this voucher:

image

What would the shopping have cost somewhere else?
What would the mean cost per item be after this discount?
What percentage discount is this?

You could also use this as a discussion starter about the number skills you use when you go shopping.

3. Class Averages

This is my favourite activity for introducing different measures of average. You can do this in a corridor or outside, no special equipment required.

Set Up
Line up the class in height order

Range
Ask the shortest and tallest students to stand back to back. The difference in height is the range.

Median
Tell the first and last student to make a half turn. Ask the second and second to last student to make a half turn. Repeat until only one or two students are facing forward.
One pupil = median height.
Two pupils = halfway between their heights is the median.

Mean
Imagine everyone is the same height. Tell the students to try to be the same height by bending knees or standing on tiptoes. Explain the mean is about sharing out equally.

Mode
Ask students to put themselves into groups of the same height. The biggest group is the mode.

This activity links a numerical calculation with a physical activity, which makes it more memorable.