Monthly Archives: October 2015

286. Make them work!

I recently taught integration to my Y12 class. To make sure I hit all the misconceptions from the previous lesson, I crafted my board example from a function and differentiated it. The final integration problem had a function to integrate and a point it went through, enabling the constant of integration to be found.

The class managed really well with the problem, but I felt from their questions, that they weren’t ready for independent work. Off the cuff, I explained how I’d constructed my example. Then it struck me – get them to use the same process:

1. Think of a function f(x) – the difficulty level is up to you.
2. Pick an x value, then work out f(x), to give you a point (x,y).
3. Differentiate f(x)
4. Give your point (x,y) and f'(x) to a partner.
5. Your partner works through your problem trying to find f(x).
6. Check your partner’s method and solution.
7. If they didn’t get it right, go through their method and see if you can see if they went wrong.
8. If you can’t spot their mistake, did you go wrong?

I thought getting students to differentiate as part of an integration lesson would be a recipe for disaster, but it actually helped consolidate the links between these two processes. The functions that the students thought up were far worse than anything I’d used previously – they had brackets that needed expanding, fractional indices, negative indices, decimal constants etc. The conversations about the work and levels of engagement (competitiveness) between partners was brilliant.

I’d recommend trying this style of activity and I know I will be adapting it for other topics.

285. Circle Theorem Construction

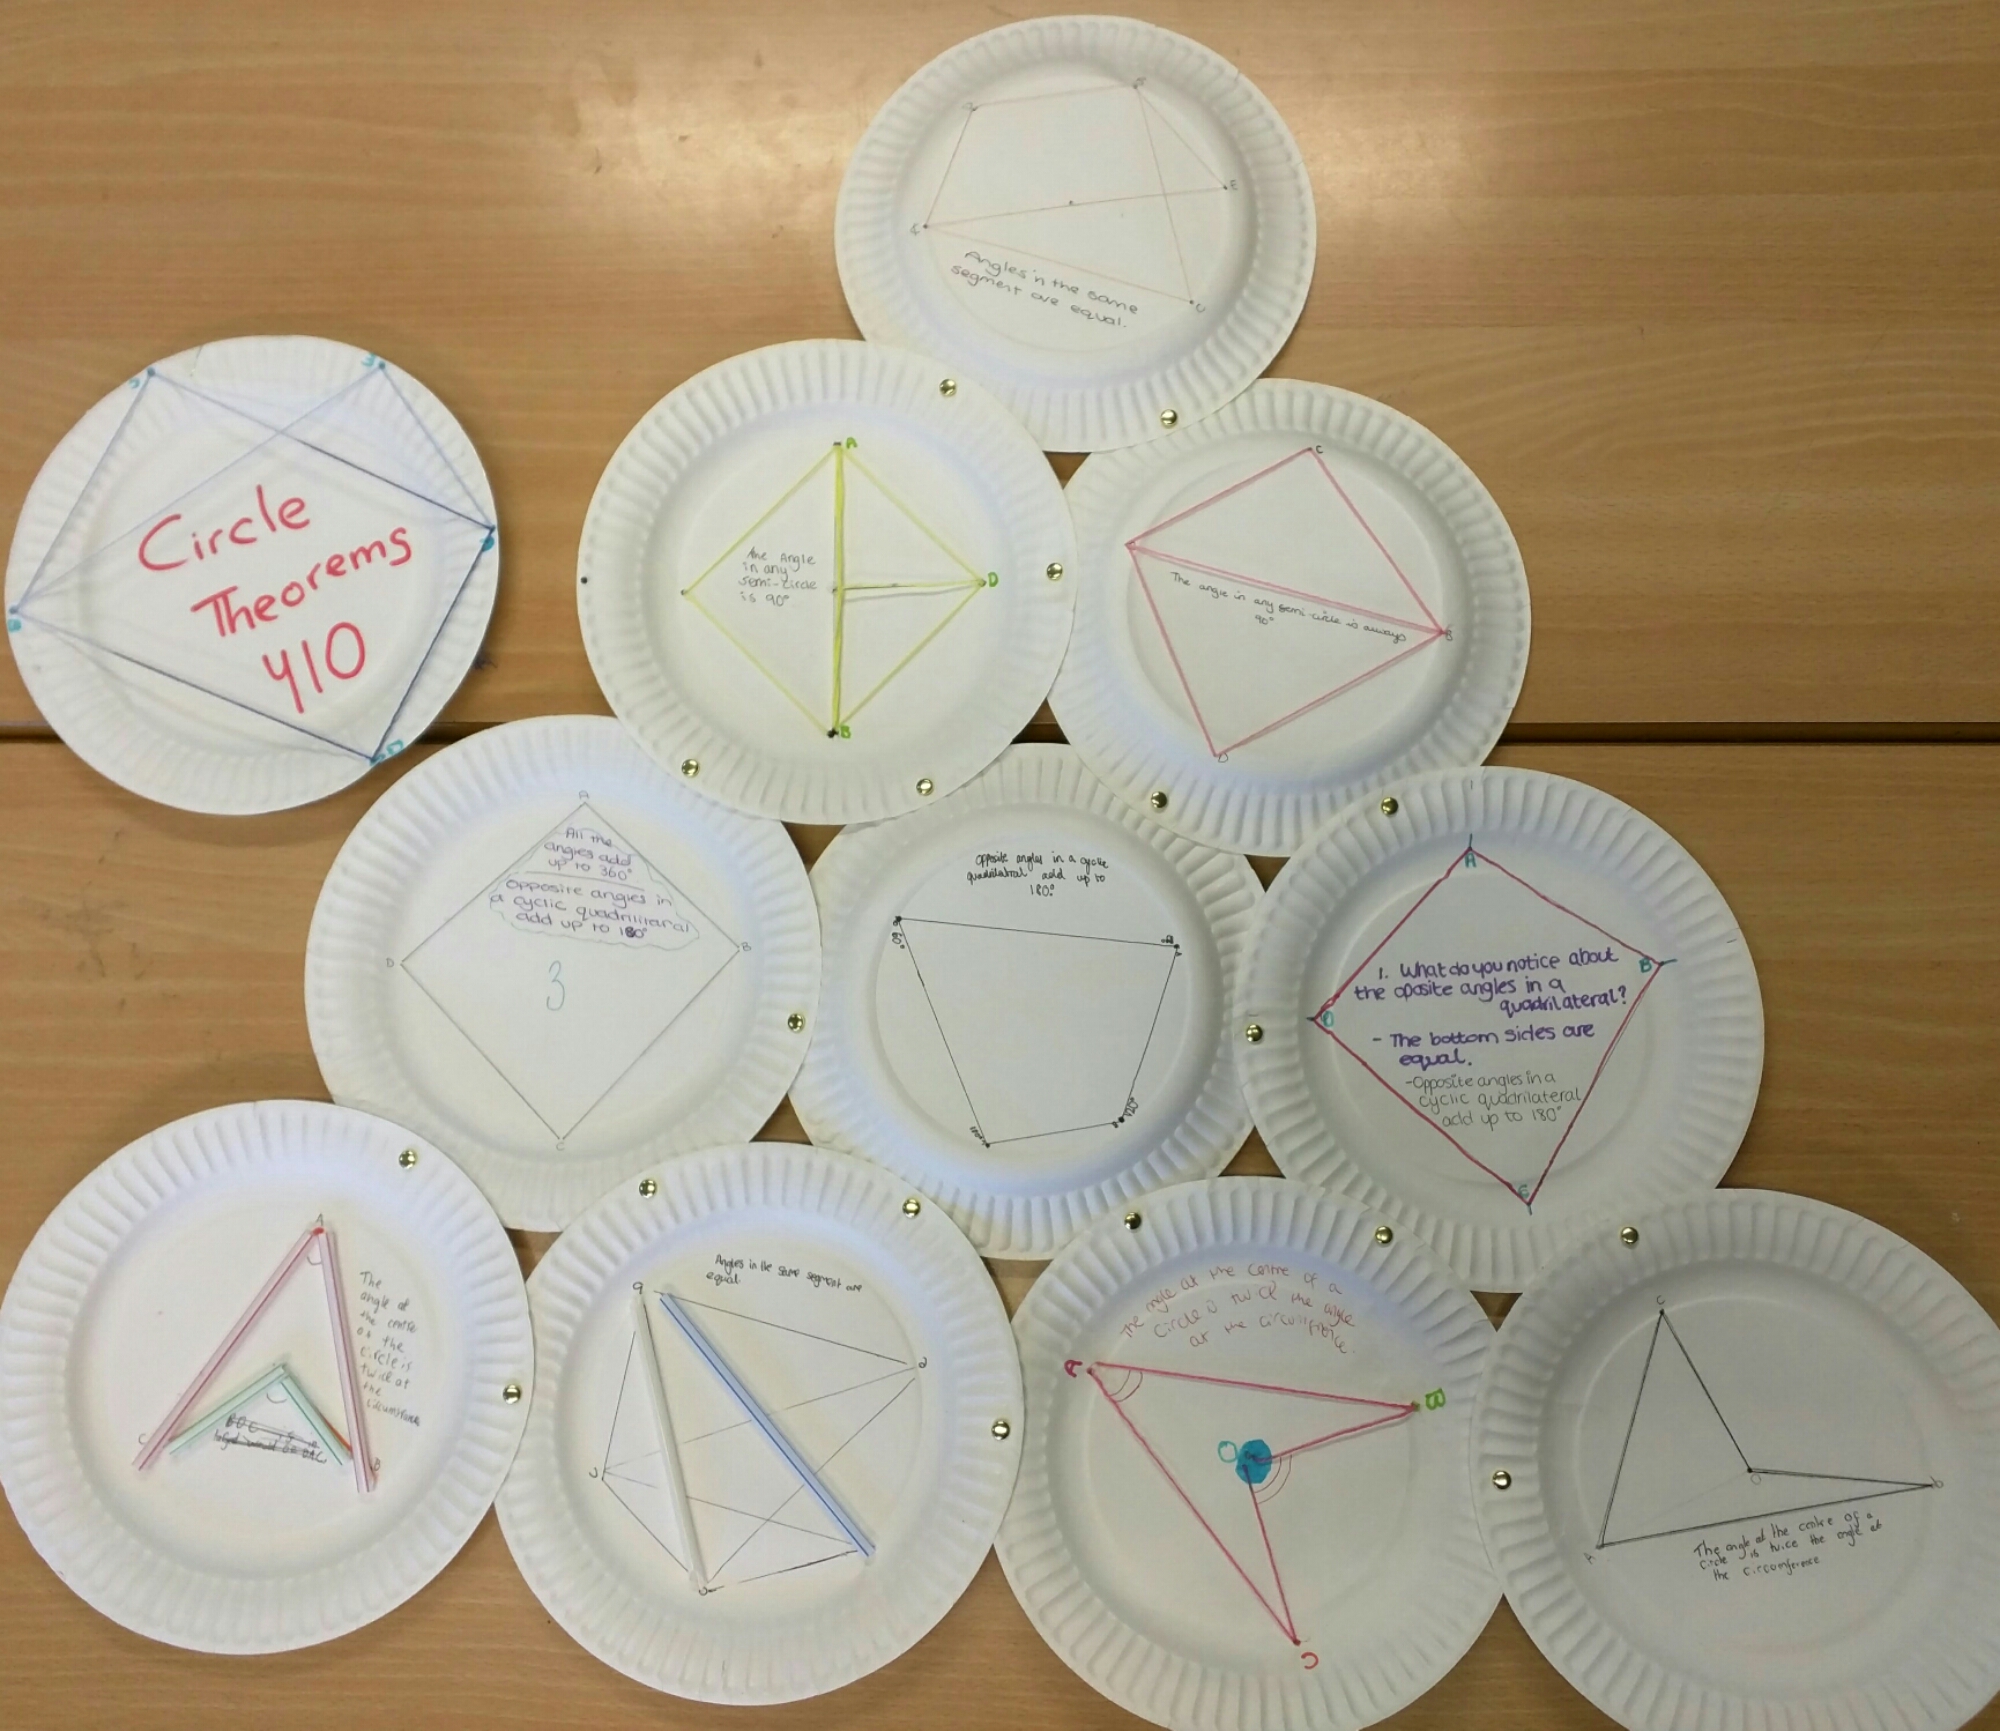
When you Google the phrase ‘Circle Theorem paper plates’ you will see some stunning work from teachers (and their pupils) from around the world. Today I tried this idea out and I can vouch for its usefulness as a revision tool.

If you are short on display space or need a stable, minimum staple solution, try this:
Use split pins to join the plates together. They are stronger than tape and more flexible than staples, which can tear.

image

Get creative – I made a triangle, but you could make a chain, other shapes or even an archway around your door frame. Once you have connected your plates, you need far less staples or sticky tack to attach them to the wall.

284. All tied up – an adventure in skewness

When you move from 2D vector equations to 3D vector equations the biggest challenge is skewness. On plain old 2D graphs if two lines aren’t parallel, they intersect and vice versa. Not so easy in three dimensions … how to explain skewness? Got some string and duct tape? Then let me explain …

Equipment
String
Scissors
Duct tape
A low ceiling
A chair/stepladder/tall student

Step 1
Tape a piece of string from the ceiling to the floor at an angle. Attach a second piece to the ceiling and ask students to position it so it is parallel with the first string. This isn’t as easy as it seems once they realise it must look correct from every angle. Secure the string to the floor with duct tape.

Step 2
Attach a third piece of string to the ceiling. Instruct students to position it so it intersects one of the strings. Secure the end.

Step 3
Attach a fourth piece of string to the wall. Ask them to position it so that it is not parallel to or intersecting any existing string.

(My ingenious bunch took the string out of the door and fastened it to the bannister, just in time for management to thankfully not be garroted)

Step 4
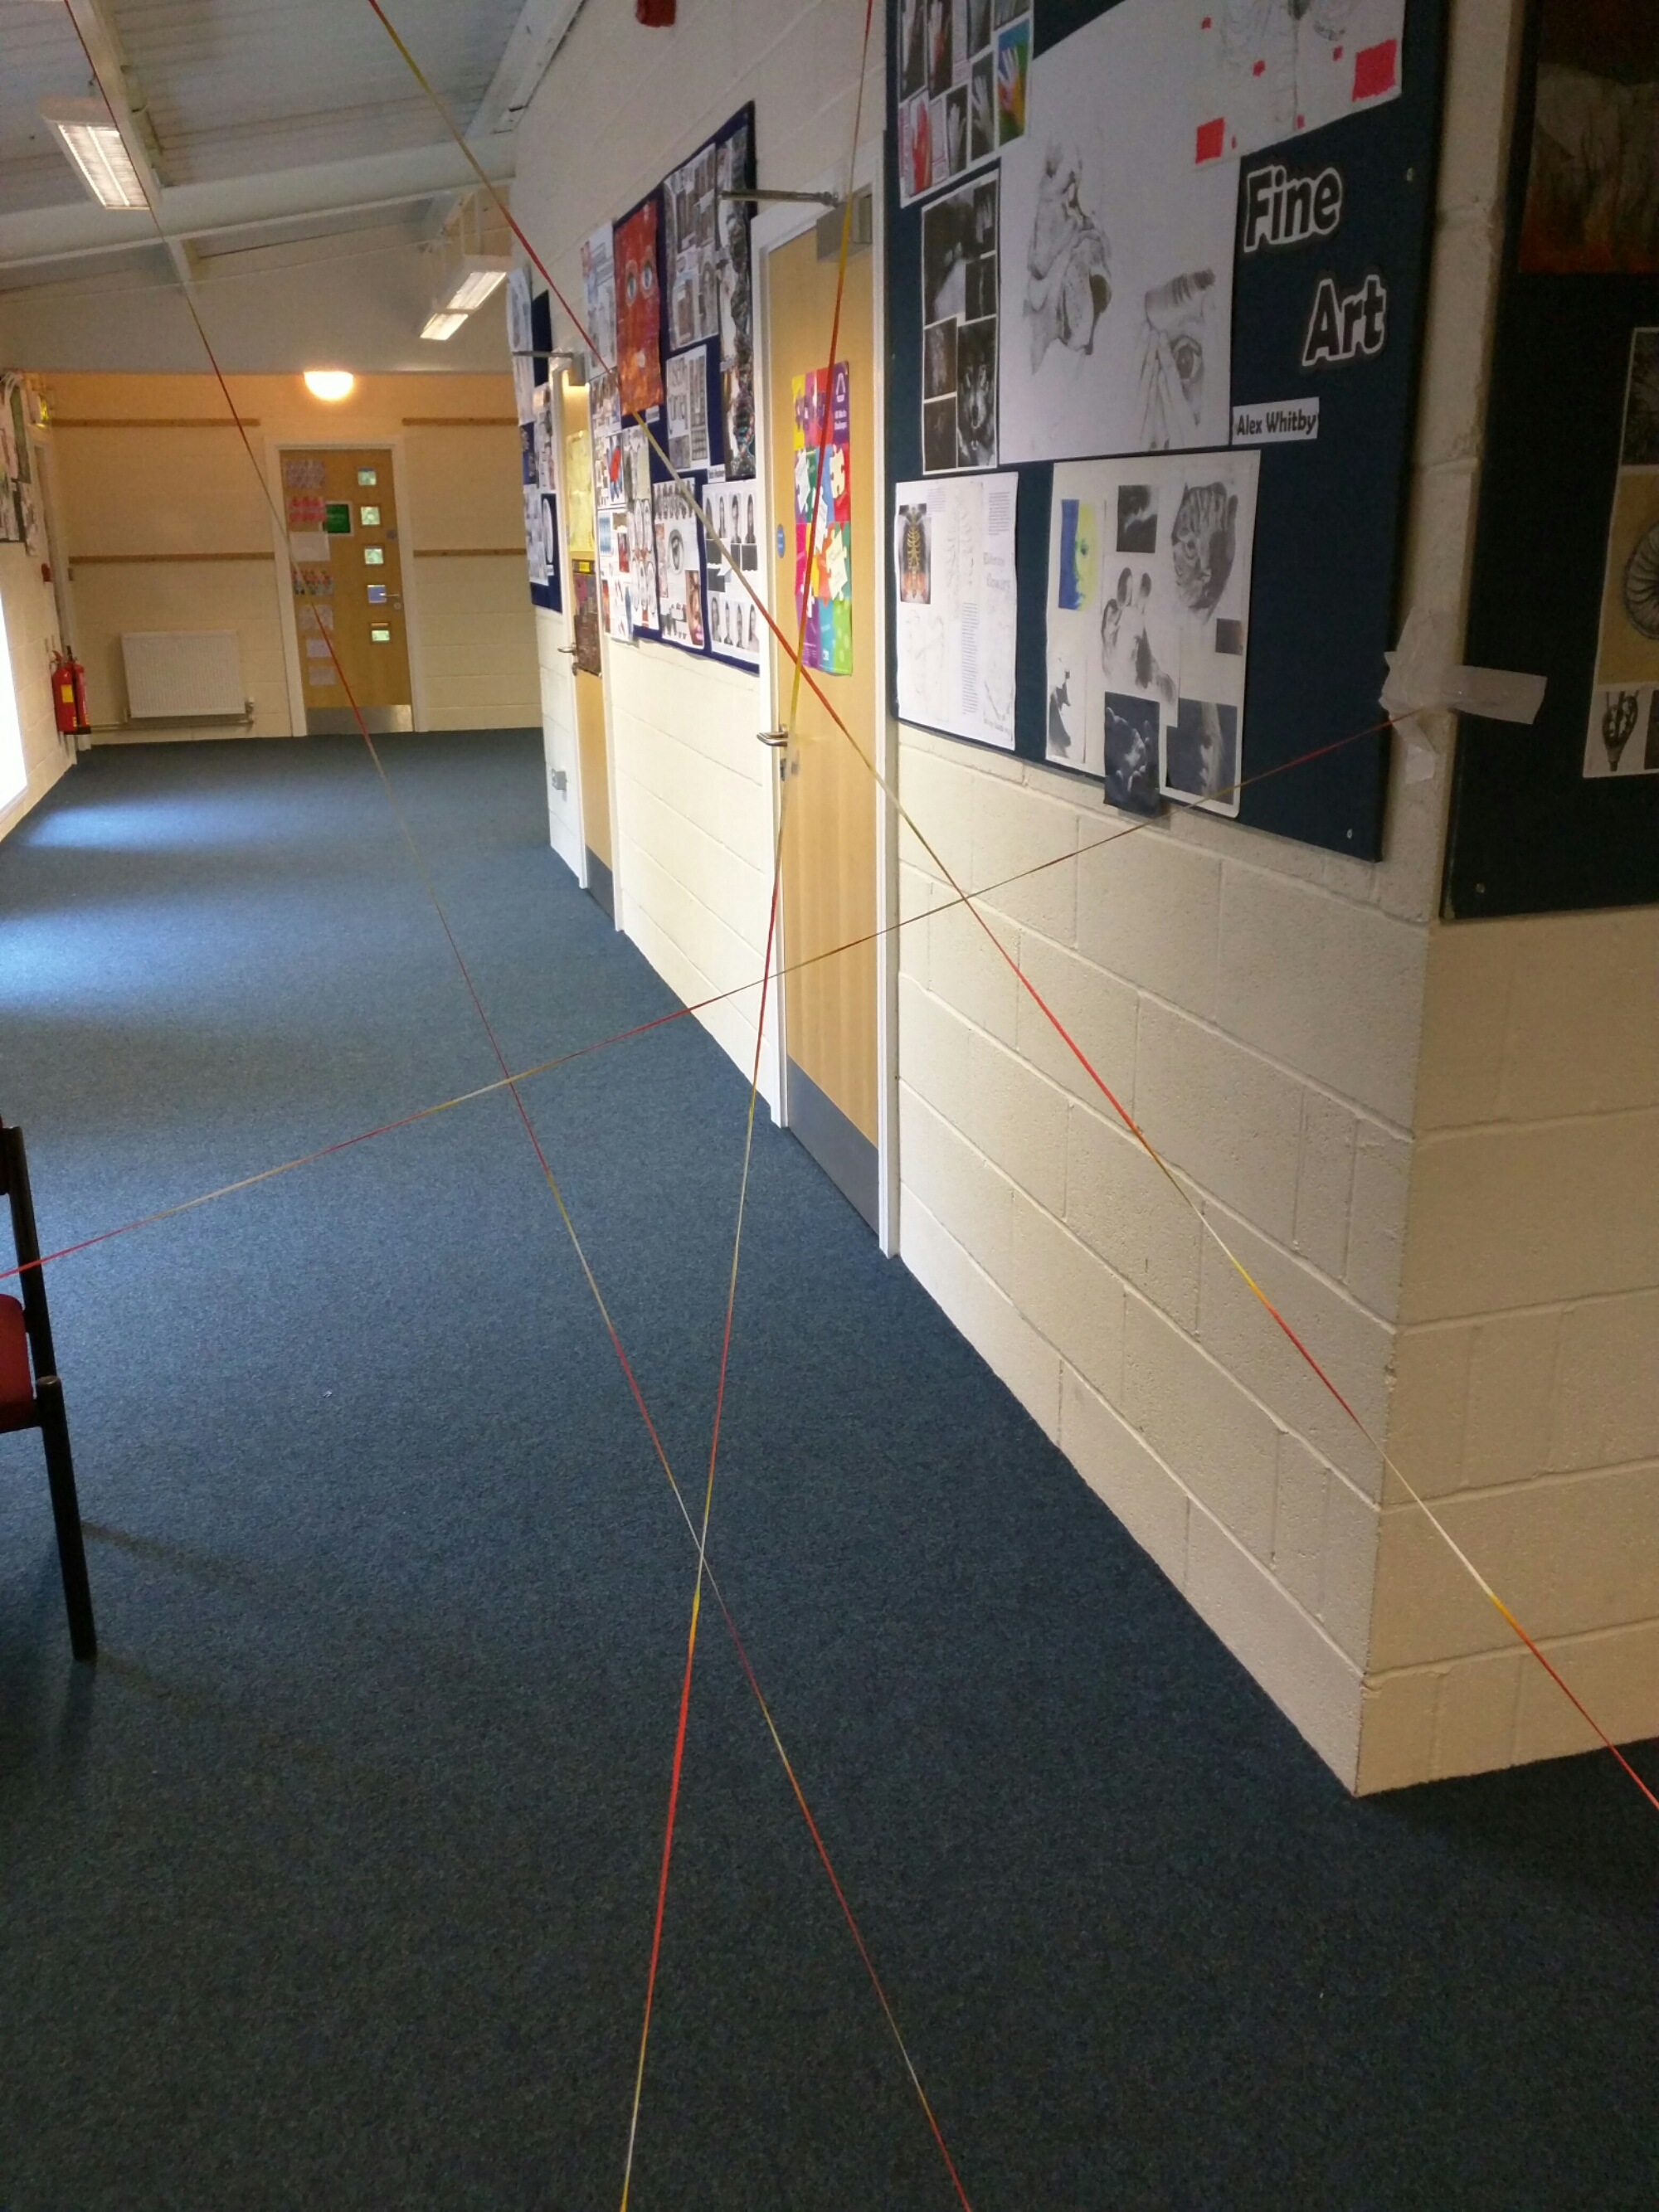
Give the students a fifth string and instruct students to make it parallel to an earlier string and intersect the fourth string. They choose both end points.

If all goes well, you’ll get something like this:

image

You can then explain the differences between parallel, intersecting and skew lines without resorting to iffy diagrams on a whiteboard or complicated geometry software. Students can walk through them and really get a feel for the geometry of the situation.

(When it comes to taking it down, I hope your students are slightly more sane than mine – one of them shouted ‘Argh, it’s a spider web’ and ran through it. Actually quite an efficient way to tidy up!)

Resources
You can download five large print 3D vectors here:
3d vector cards (pdf)
3d vector cards (docx)
The challenge is to find the parallel lines (3 lines), the skew lines and the intersecting lines (2 pairs).

There are more ideas on 3D vector equations here:
211. Hidden Rectangle Problem

283. Splitting the steps – Rearranging Equations

Last year I put together some resources using the ‘Splitting the steps’ model which was introduced to me at a talk by Bruno Reddy (@mrreddymaths). I’ve realised I didn’t upload this one at the time!

This worksheet takes you through rearranging equations through two sets of questions, plus extension. The helpful hints and structure are gradually removed. You’ll notice that the + sign is left in, even when a – is required. This was specifically done to ensure my students focussed on opposite operations and writing in negative numbers. If you’d rather not have that, there is an editable version too.

Splitting the steps Rearranging equations (PDF)

Splitting the steps Rearranging equations (Word)

If you would like a starter activity relating to this, then go to this blog post on simple rearrangements: 224. No Nonsense Negatives

If you like this splitting the steps activity, try these out:

Splitting the Steps estimated mean

Splitting the steps Rationalising the denominator V2

282. Round the Venn

My next class neighbour, Mr D, has been evangelising about venn diagrams since he did the TAM (Teach A-level Mathematics) course. His lesson on equations and graphs using venn diagrams was brilliant! Then, at MathsConf5, Craig Barton (@mrbartonmaths) shared his love of venn diagrams.

And they are on the new english GCSE Maths syllabus.

In light of all this, I introduced venn diagrams as a vehicle for probability (Y10) and rounding (Y9).

Introduction

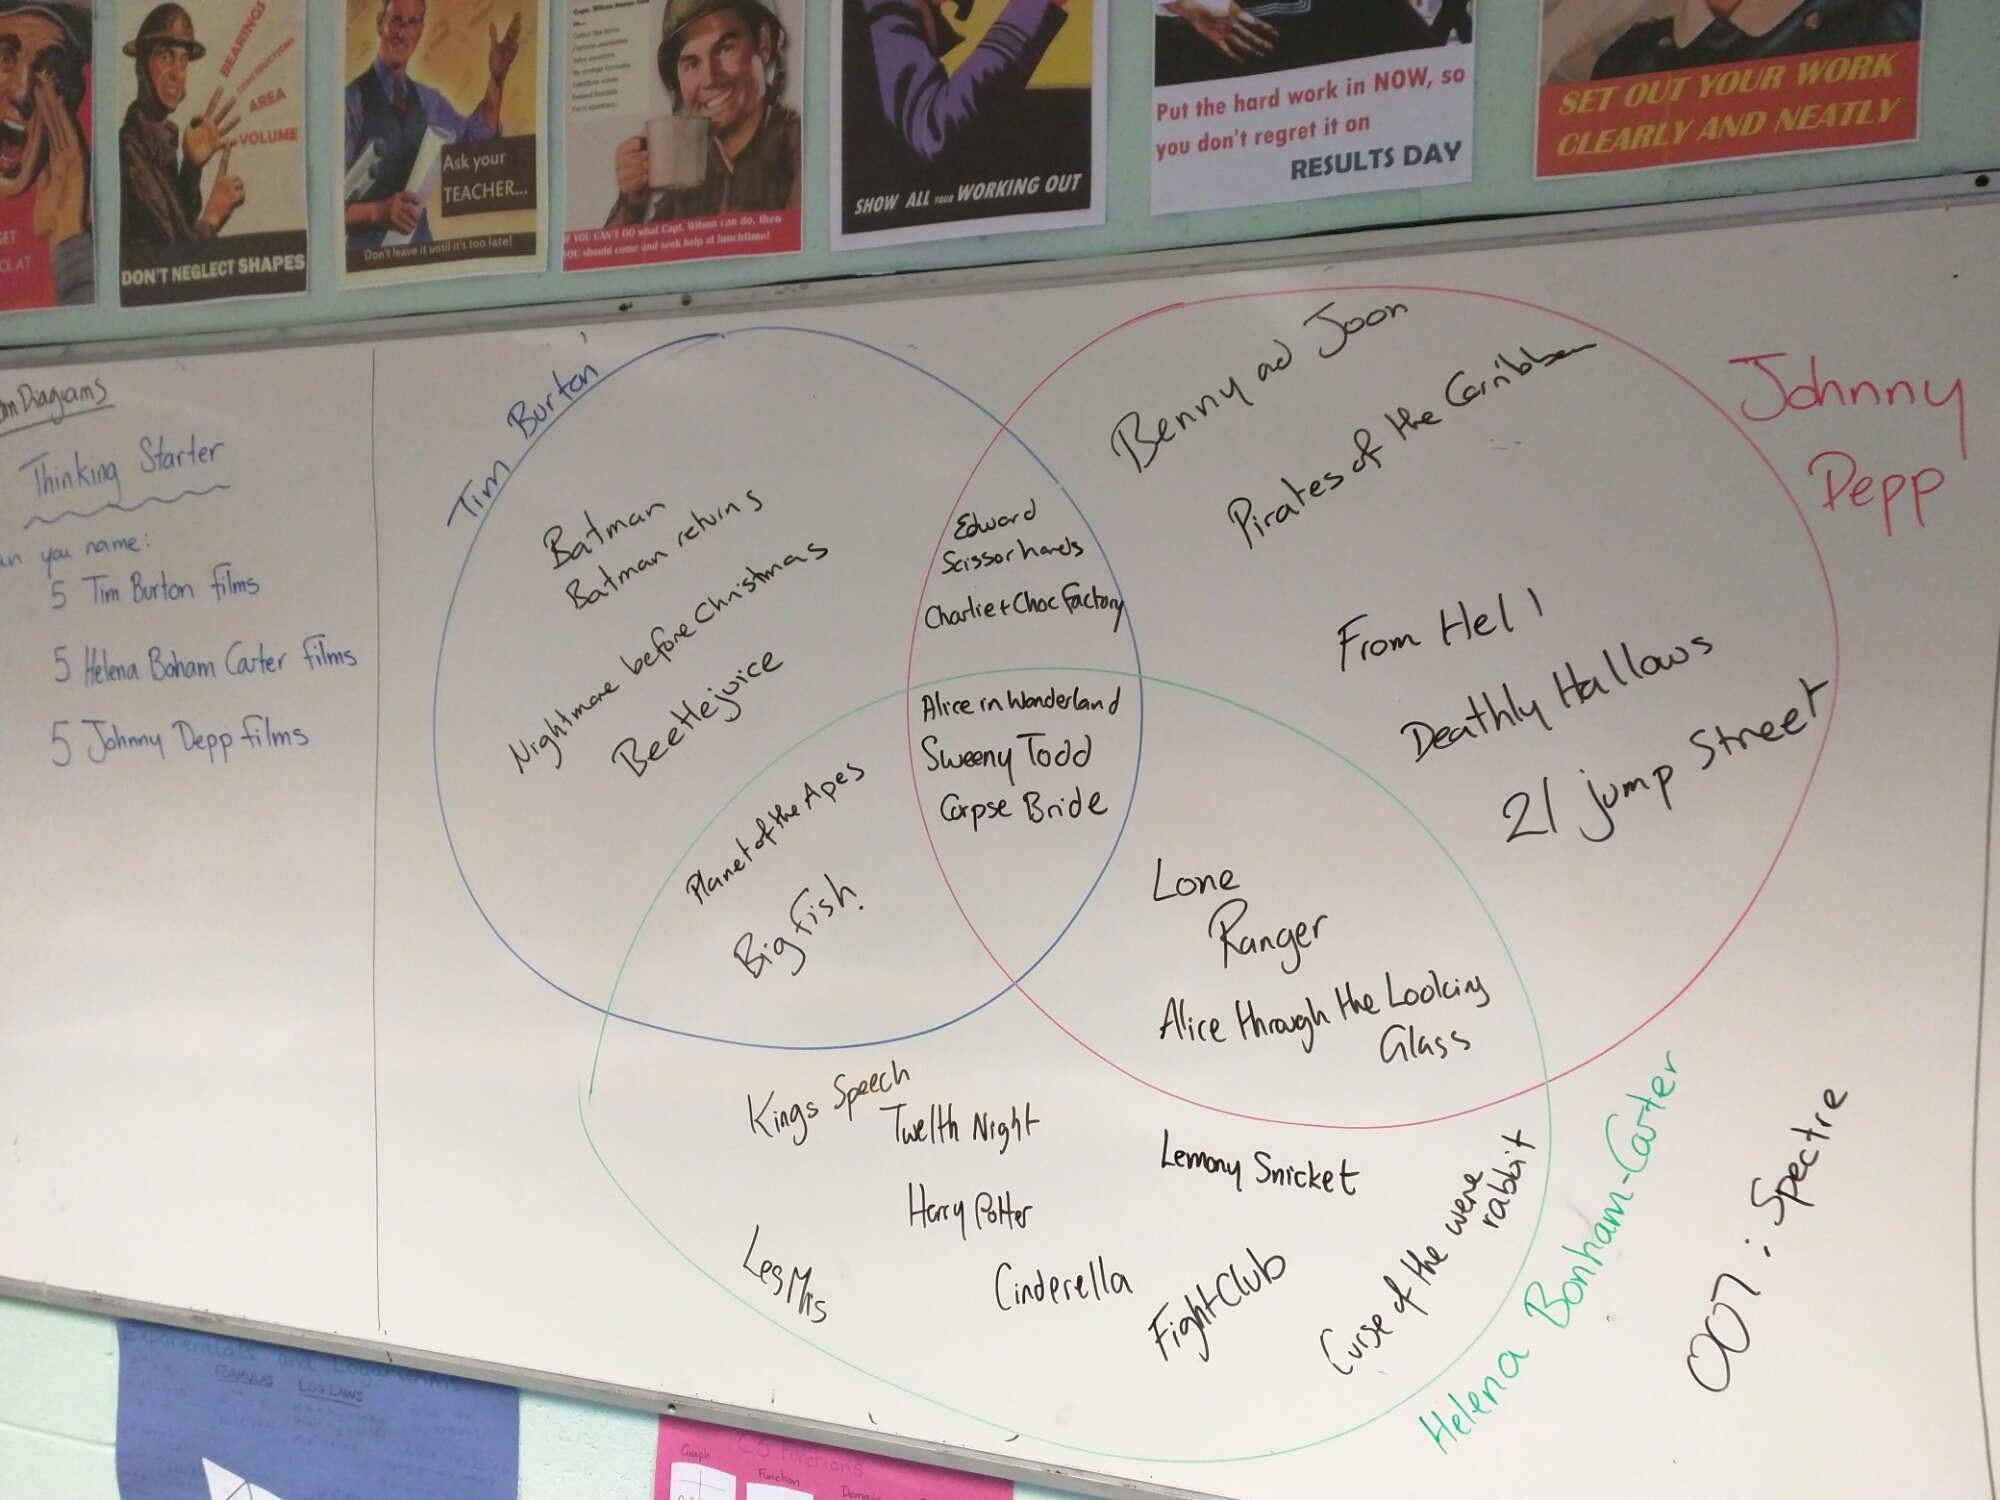
First of all I used the films of Tim Burton, Johnny Depp and Helena Bonham-Carter to introduce a triple venn diagram, with the box to represent everything – I like dropping in the proper forms or technical bits early on in all topics.

image

We had quite a lengthy conversation about films, including why the Bond film could be on the diagram. The discreet use of IMDB (with my permission) settled some arguments too!

Rounding

I wanted my Year 9s to consider the differences and similarities between different forms of rounding. I created a simple diagram for them to complete where they compare ‘nearest ten, ‘one decimal place’ and ‘two significant figures’. You can download it here:

Rounding Venn Diagram worksheet

Probability

For my probability lesson I used the probability PowerPoint by Craig Barton. You can link to his resources here:

Mr Barton’s venn diagram resources