Tag Archives: venn

282. Round the Venn

My next class neighbour, Mr D, has been evangelising about venn diagrams since he did the TAM (Teach A-level Mathematics) course. His lesson on equations and graphs using venn diagrams was brilliant! Then, at MathsConf5, Craig Barton (@mrbartonmaths) shared his love of venn diagrams.

And they are on the new english GCSE Maths syllabus.

In light of all this, I introduced venn diagrams as a vehicle for probability (Y10) and rounding (Y9).

Introduction

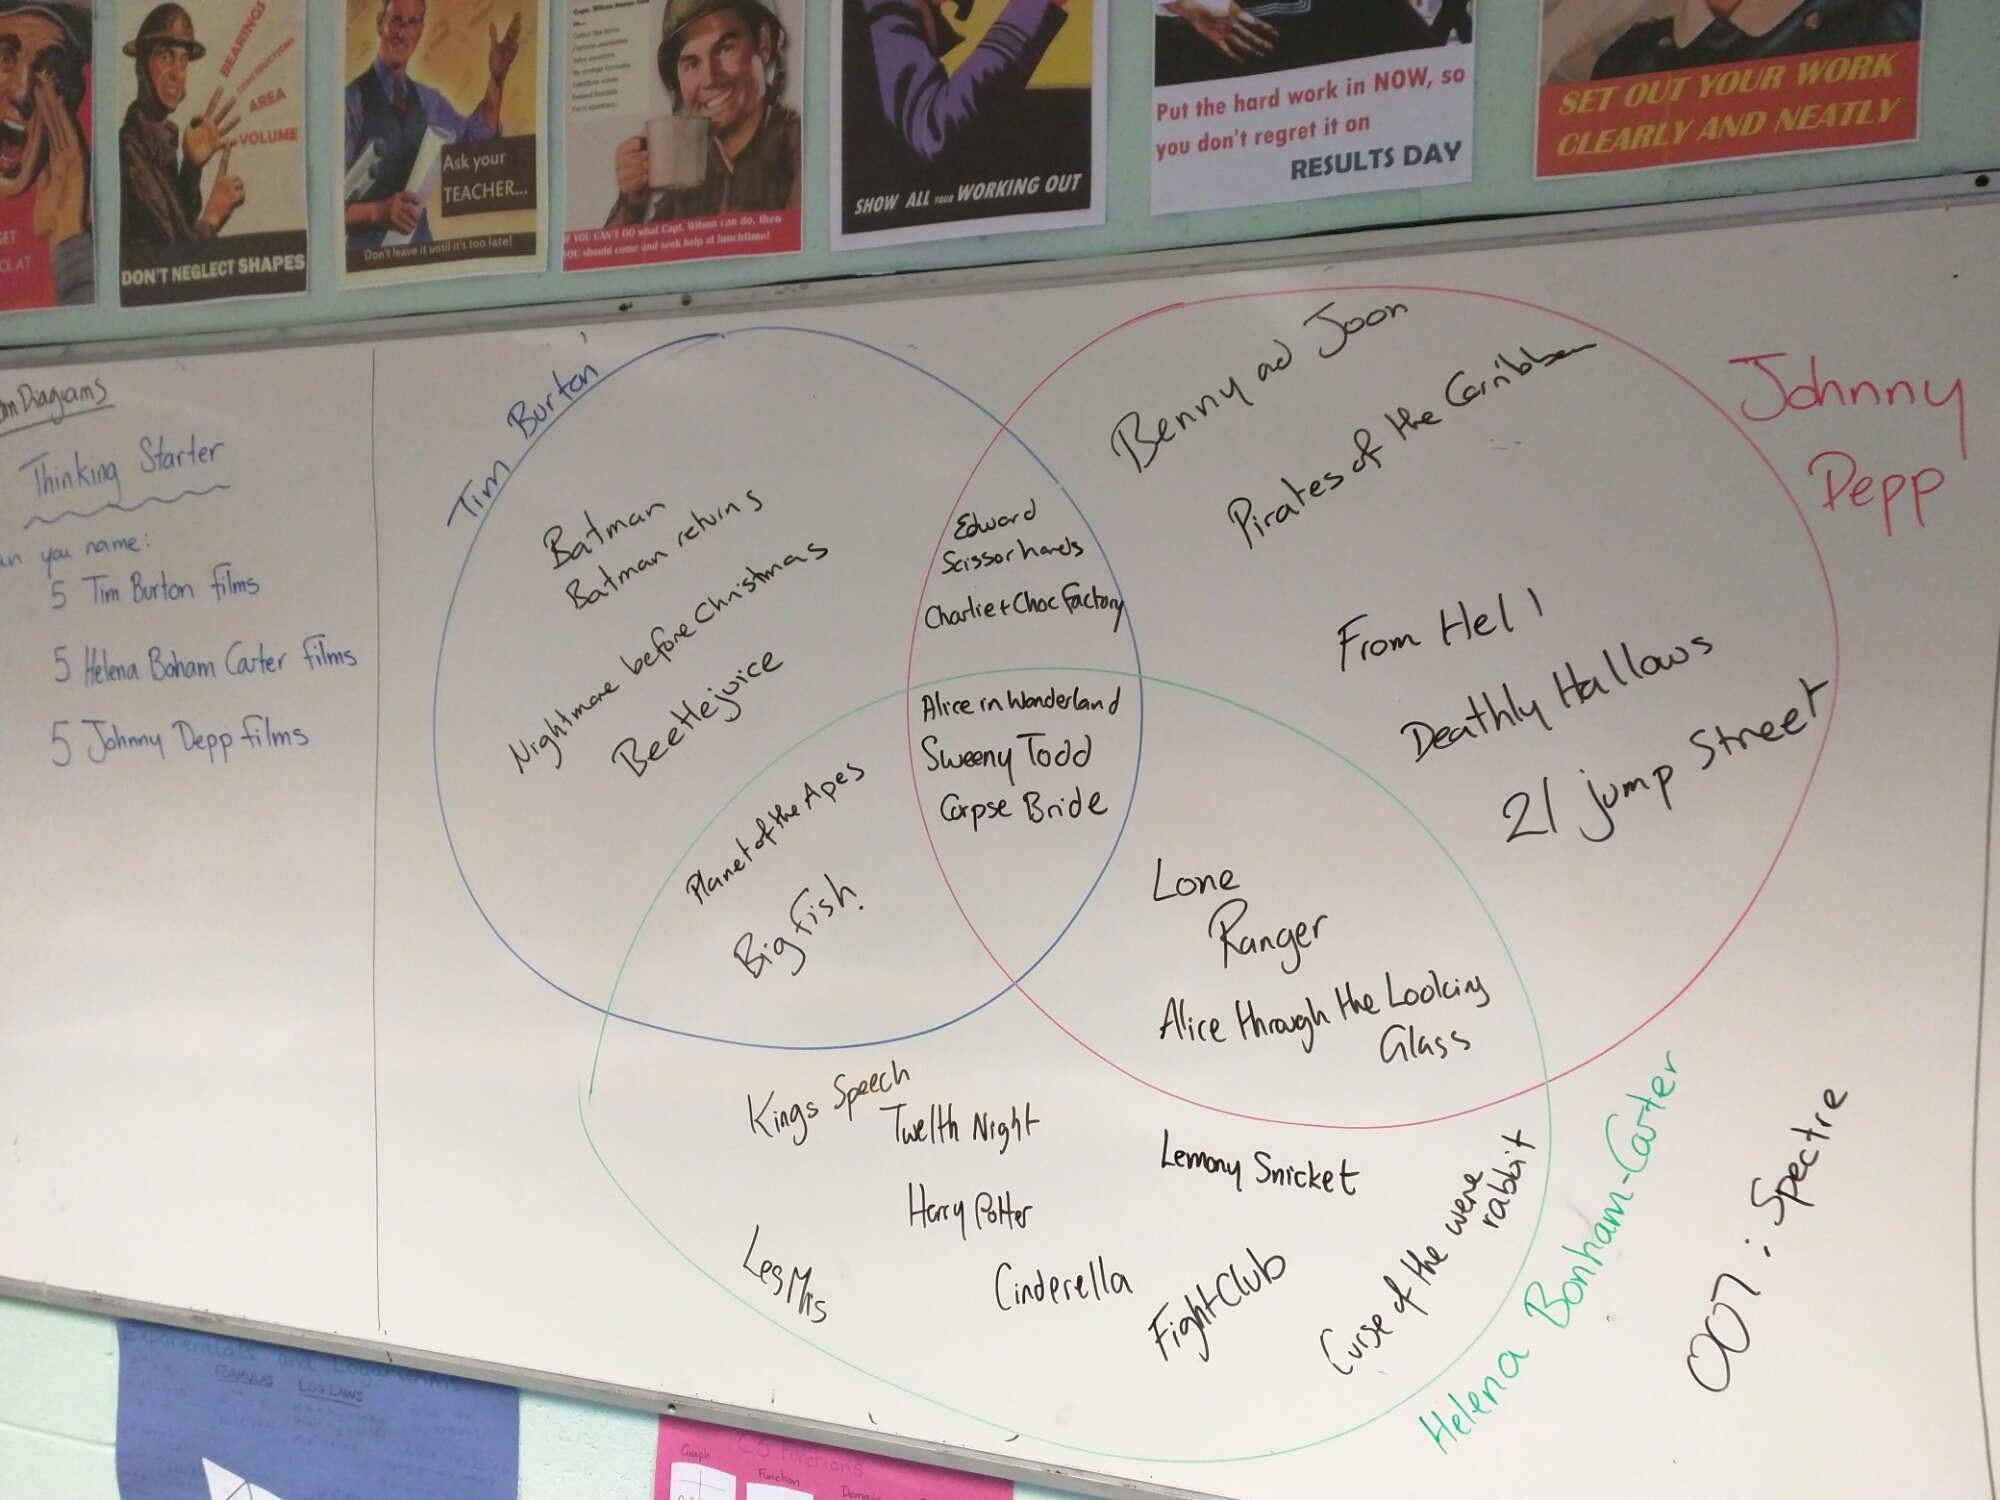
First of all I used the films of Tim Burton, Johnny Depp and Helena Bonham-Carter to introduce a triple venn diagram, with the box to represent everything – I like dropping in the proper forms or technical bits early on in all topics.

image

We had quite a lengthy conversation about films, including why the Bond film could be on the diagram. The discreet use of IMDB (with my permission) settled some arguments too!

Rounding

I wanted my Year 9s to consider the differences and similarities between different forms of rounding. I created a simple diagram for them to complete where they compare ‘nearest ten, ‘one decimal place’ and ‘two significant figures’. You can download it here:

Rounding Venn Diagram worksheet

Probability

For my probability lesson I used the probability PowerPoint by Craig Barton. You can link to his resources here:

Mr Barton’s venn diagram resources

113. Did the Little Thinkers get you thinking?

Did my Little Thinkers give you ideas for a lesson?

I hope so!

These are my little crisp people and they’ve been helping pupils learn for over a decade.

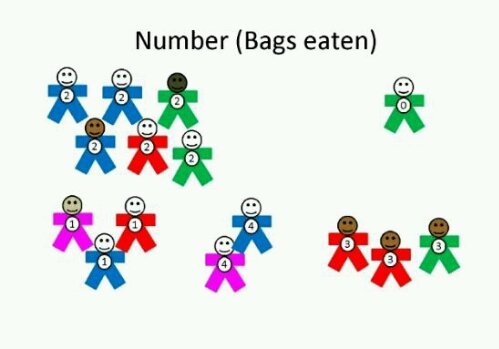
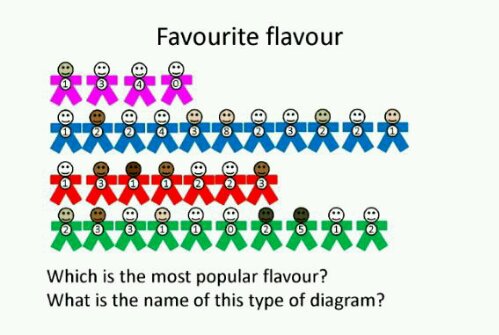
I first thought up this task when an interactive whiteboard and digital projector came in the form of an overhead projector. Using the brand new concept of colour printing onto inkjet OHP transparencies, we could move these little people around the board and investigate different problems. Each number represents the number of bags of crisps eaten in a week. Each colour represents a flavour (Blue = salt & vinegar, red = ready salted, green = cheese & onion, pink = prawn cocktail).

You can sort by number of bags eaten:

image

You can create a flavour pictogram:

image

In fact you can use this resource with KS2 & KS3 to investigate lots of topics:
Sorting by category (number/colour)
Ordering numbers
Pictograms
Venn diagrams
Carroll diagrams
Bar-charts
Averages
Questionning
Probability

And anything else you can think of.

I’ve created an editable template of figures, in three different sizes. You print them out and use them individually, in group work or on the wall. There is also a teacher guide on how to use the crisp people.

Enjoy!

Download your little people below:

Editable template  crisp-people-template-blank

Teacher guide and presentation crisp_people_guide

100. Factor Venn

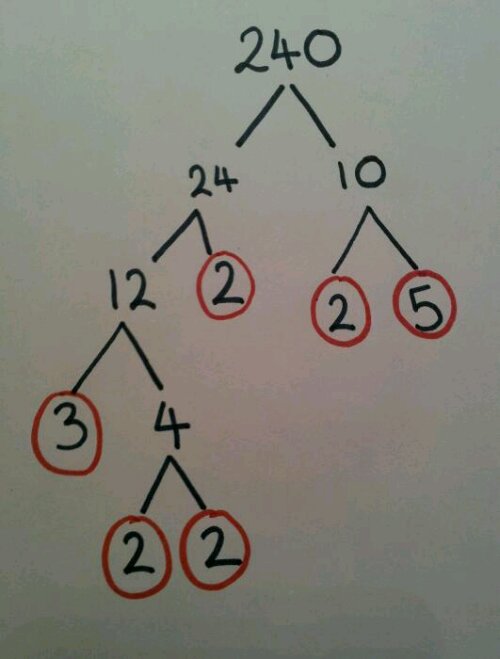
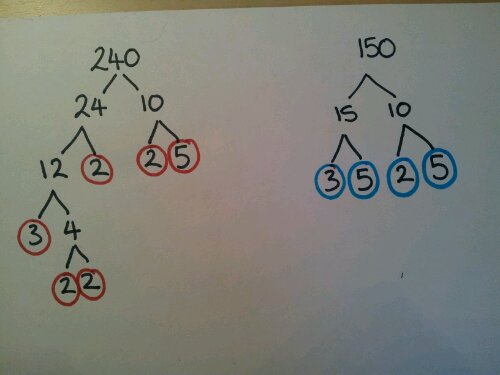
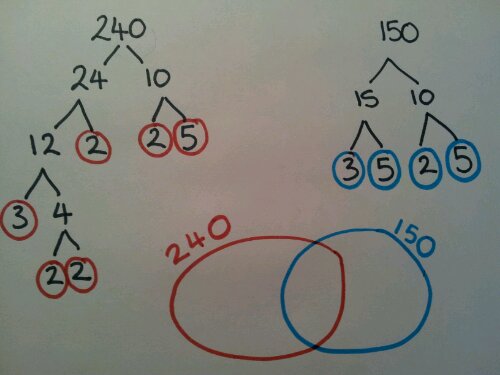
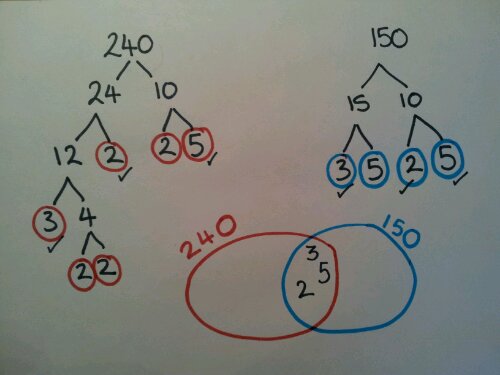
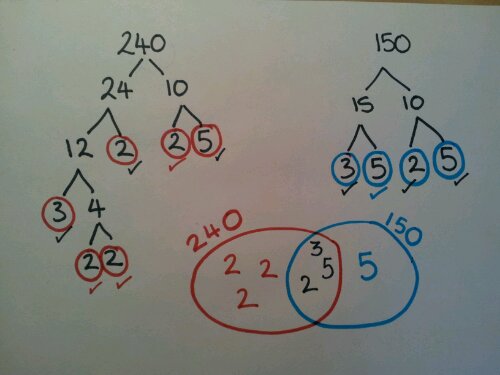
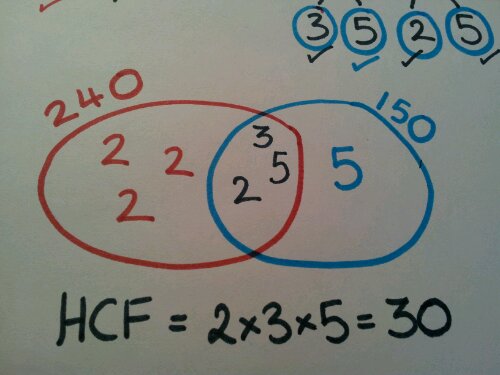
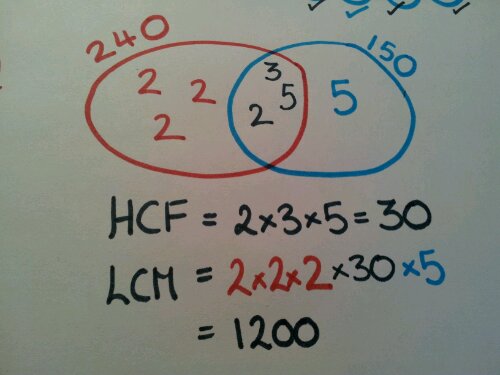
In the last post I discussed Prime Factor Decomposition, using factor trees. I also use this method for Highest Common Factor (HCF) and Lowest Common Multiple (LCM). The difference is you need two different coloured pens and a Venn diagram:

Factorise your first number

image

Factorise your second number

image

Draw and label an empty Venn diagram in appropriate colours

image

Fill in the common factors

image

Fill in the rest

image

HCF: Multiply the overlapping area

image

LCM: Multiply everything

image

Review
This method is great for visual learners who want to see where the numbers come from. You can also quickly spot where they have made a mistake in a calculation.

Challenge
This method also works for three numbers – just use three colours and three circles!