Tag Archives: integration

295. I know how to integrate, but which rule to use?

You know that point when you’ve covered the Integration content in A2, the class can do all the different forms and then you set mixed questions … it’s like it’s in a different language. All that wonderful knowledge seeps out like water in a sieve. There must be a help sheet or tool that gives students a starting point, until their confidence and experience grows?

core 4 integration flowchart

Rewind to proving an integration rule. I was discussing a textbook proof of an integration rule with a student and I just didn’t like it. It niggled in my head that I’d been shown a better method when I was first learning this stuff. After a quick dash to the stockroom and a climb up a step ladder, I found a later edition of the textbook I’d used at A-Level. I was right – the Bostock & Chandler proof was far more elegant and comprehensible. Problem solved!

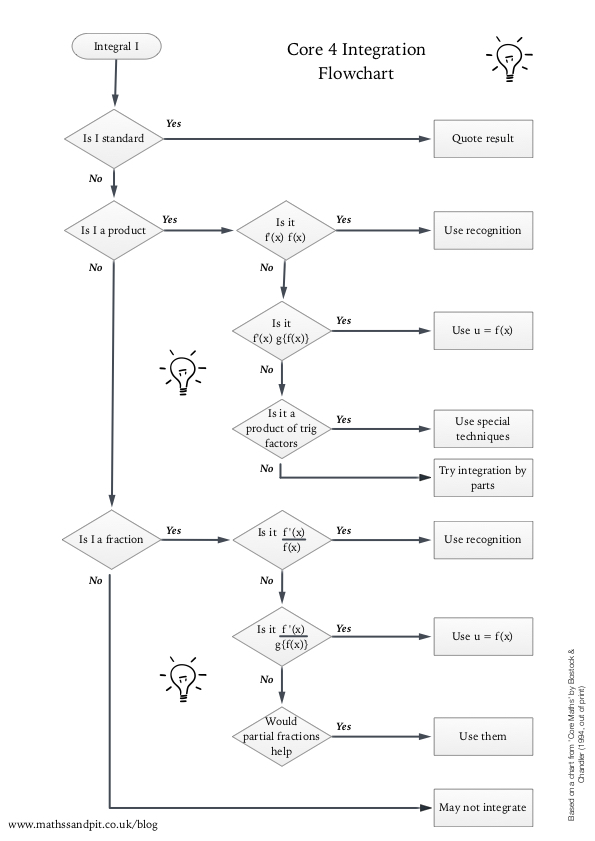
While I had this book out I had a flick through the pages. A flowchart caught my eye – not a fancy infographic, a proper ‘get the flowchart stencil out’ chart. It basically talks students through how to choose an integration strategy. I could have photocopied the page, but it was rubbish quality when I tried. I believe the book is now out of print, so I have recreated the flowchart page with full credit to it’s source. I hope it helps your students as much as it has mine.

C4 Integration flowchart (pdf)

286. Make them work!

I recently taught integration to my Y12 class. To make sure I hit all the misconceptions from the previous lesson, I crafted my board example from a function and differentiated it. The final integration problem had a function to integrate and a point it went through, enabling the constant of integration to be found.

The class managed really well with the problem, but I felt from their questions, that they weren’t ready for independent work. Off the cuff, I explained how I’d constructed my example. Then it struck me – get them to use the same process:

1. Think of a function f(x) – the difficulty level is up to you.
2. Pick an x value, then work out f(x), to give you a point (x,y).
3. Differentiate f(x)
4. Give your point (x,y) and f'(x) to a partner.
5. Your partner works through your problem trying to find f(x).
6. Check your partner’s method and solution.
7. If they didn’t get it right, go through their method and see if you can see if they went wrong.
8. If you can’t spot their mistake, did you go wrong?

I thought getting students to differentiate as part of an integration lesson would be a recipe for disaster, but it actually helped consolidate the links between these two processes. The functions that the students thought up were far worse than anything I’d used previously – they had brackets that needed expanding, fractional indices, negative indices, decimal constants etc. The conversations about the work and levels of engagement (competitiveness) between partners was brilliant.

I’d recommend trying this style of activity and I know I will be adapting it for other topics.

207. Is it on the formula sheet?

In the Autumn term I put together a booklet of all the Trigonometry and Differentiation rules that you need for the Core 3 (Edexcel) exam. It was a summary of key facts and highlighted what you need to learn vs what is on the formula sheet. The original post was 155.Trigonometry&Differention including links to the booklet.

One term on, at the request of students, I’ve produced the same kind of booklet for Core 4 Integration and Differentiation. Even if you don’t do the Edexcel exams, they are still helpful revision tools.

You can download the booklets here:

C4 Differentiation & Integration (docx)

C4 Differentiation & Integration(PDF)


204. Revolution in Volume

Most elements of Core Maths can be visualised with a good diagram, but volume of revolution can be tricky if your technical drawing skills leave something to be desired. My colleague JA came up with a visualisation which is simple and elegant, yet also fun and memorable.

Step 1
Start with a curve. Introduce the limits a and b. Discuss what shape a thin strip would make: a disc.

image

Step 2
What would several discs make?
Now this is the cool bit:

image

This innocent looking shape is a pop up gift tag:

image

You can demonstrate what happens if the curve rotates 180 degrees around the x-axis.

Step 3
Now the really fun bit: dig out those interesting honeycomb christmas decorations, a metre stick and some tape:
image

The metre stick represents the scale on the x axis. The decoration represents the full 360 degree revolution about the axis.

Hint
Since these decorations are made from paper and card. You can use a sturdy craft knife to cut them into other curves. They also make great wall displays.