Tag Archives: percent

345. Practical percentage skills

It’s perfectly obvious that fluency in the use of multiplication tables directly impacts students ability to divide. This grows into confidence with algebra and reverse operations. Students are able to see the links between the concepts. Our understanding of the importance of such skills is part of the success of programmes such as TTRockstars and Numeracy Ninjas.

Why is it then that so many textbooks, websites and resource banks keep the manipulation of percentages as separate skills sets? Percentage increase / Percentage change / Reverse percentages. We know that when concepts overlap, fluency increases when these links are pursued. So that’s what I set out to do.

I have a bright Year 8 class and started working on percentages with them. It didn’t take much to have them confident using equivalent decimal multipliers to find percentages of amounts. Using a multiplier for increase/decrease was a walk in the park. Then finding percentage change came up. Over the years I’ve seen a lot of students get very confused with half remembered methods:

“Which do I take away?”

“What number do I divide by?”

“Is this calculation the right way around?”

I tend to teach new value divided by old value and interpret the answer. It got me thinking – why am I teaching them this? They can increase by a percentage using a multiplier, why can’t they rearrange their working to find the actual percentage? Same goes for reversing a percentage.

After a good discussion, I used this worksheet to recap and develop their skills:

Percentages Linking concepts questions

Percentages Linking concepts answers

Warning: “Original Amount” section, question (d) is a tricky one.

As with all new approaches, it’s always good to see if it worked. I set the following task from Don Steward’s website:

MEDIAN percent problems

I have GCSE students who wouldn’t know where to start on those questions, yet my Year 8 with their ‘have a go’ attitude were absolutely awesome. I’m definitely using this method again!

43. Visualising percentages

Percentages are all to do with proportion, but this seems to escape the understanding of some. If you calculate 20% of £15, this is different to 20% of £25. The 20% is not a fixed quantity. How can you explain this to visual learners?

Visual Percentages/Proportion

Equipment
Pencil
Ruler
Paper – squared makes the task easier
Coloured pencils (optional)

Calculations
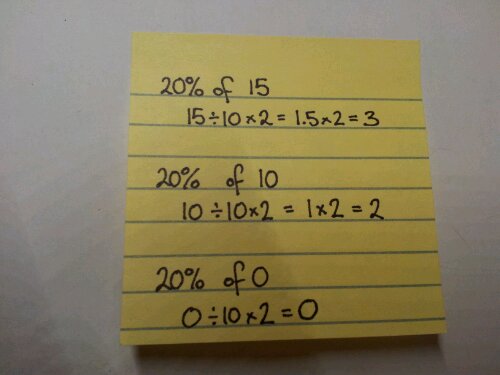
Find 20% of 15, 10 and 0.

image

Construction
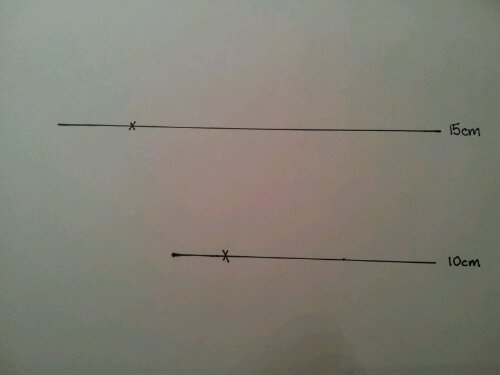
Draw a 15cm line, mark 3cm along it.
Move down 5cm.
Draw a line, mark 2cm along it.

image

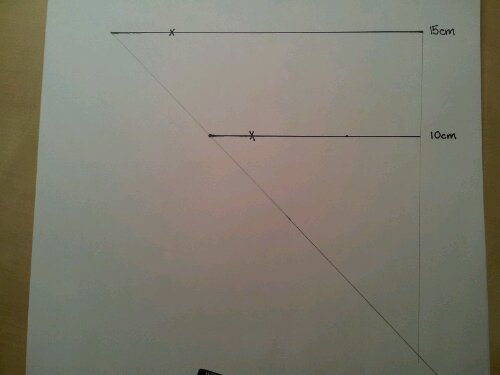
Join the ends of the lines with a ruler and indicate this with a cross.
image

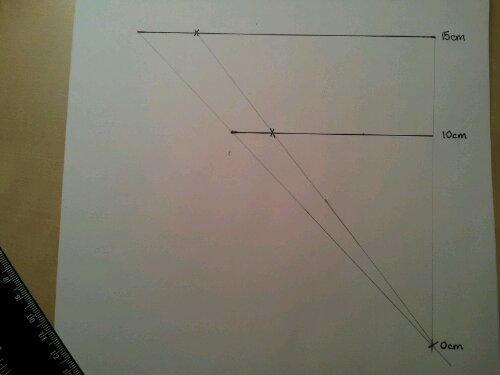
This should be 10cm lower than the bottom line.
Repeat, joining the 3cm and 2cm points.
image

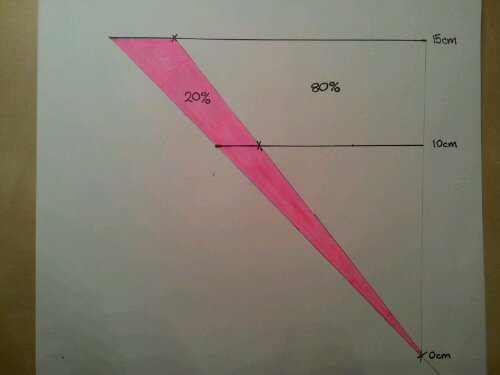
Shade in the smaller triangle.
Label the lines.
image

The Maths bit
The width of the triangle indicates the whole amount (100%).
The shaded width represents 20%.
The unshaded width represents 80% (Ask students if they know why).

The whole diagram represents 20% of any number from 0 to 15.
This can be adapted for any number and percent. It visually shows that as a number gets bigger the percent increases proportionally.

You can also use this to investigate fractions.

Note: This is for comparing widths. You can challenge your students to prove whether it is also true for the areas of the triangles.

26. FDP Pyramid

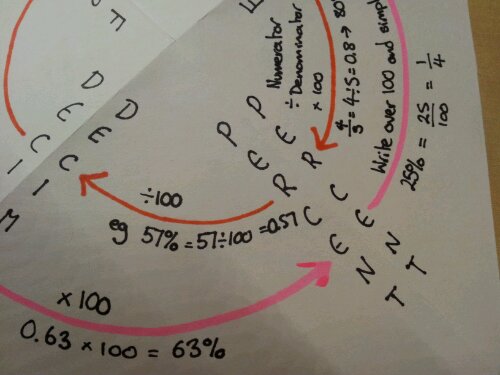
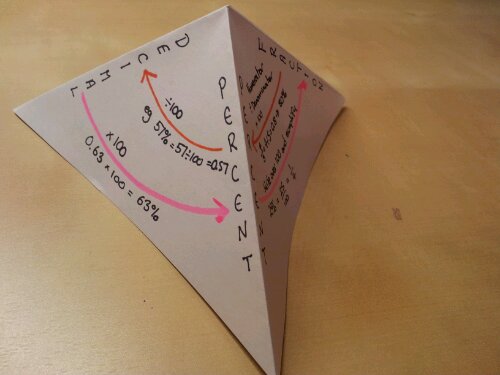
This nifty little pyramid summarises how to convert between fractions, decimals and percentages.

Equipment
A5 paper or lightweight card
Scissors
Pens
Glue/tape
Compasses & pencil

Make a square
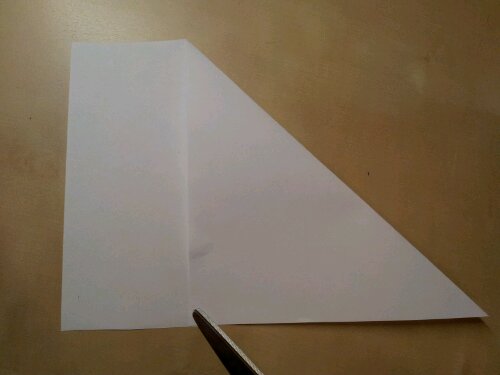
Fold the paper over to make a perfect 45 degree angle. Cut off the excess paper to make a square.

image

Fold & Cut
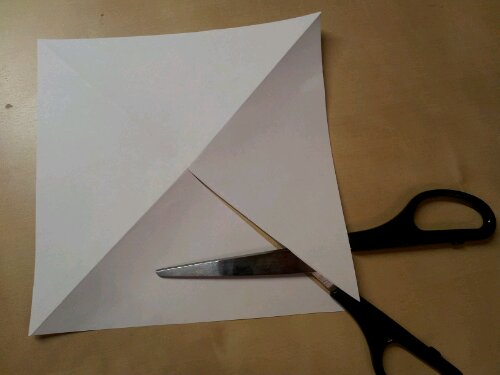
Unfold the square and fold the opposite diagonal. Cut from one corner to the middle along the fold.

image

Label
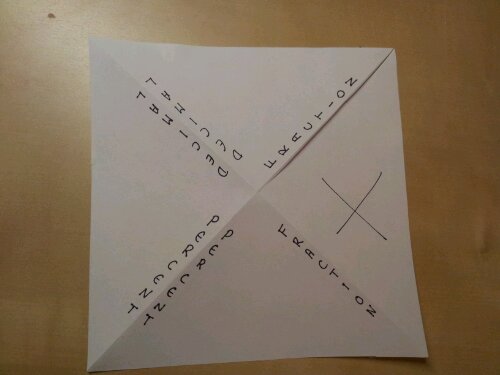
Draw an X on one of the quarters next to the cut. You will glue this piece later.

Either side of each fold label ‘Fraction’, ‘Percent’, ‘Decimal’.

image

Arrows
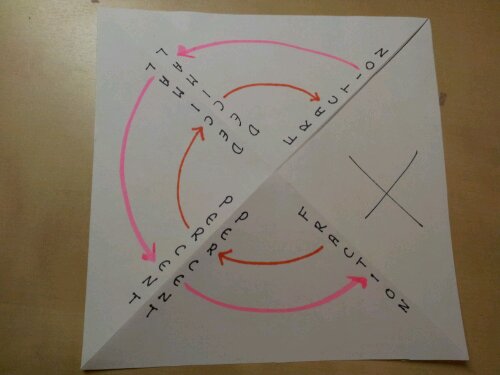
Using compasses and pencil, lightly draw two circles. Go over these lines with a pen to create one set of arrows going clockwise and one set anti-clockwise.

image

Facts
Label each arrow with the correct conversion fact and example.

image

Stick
Fold the X flap behind the next section and glue in place.

image

Summary
This is a tactile activity which could be used on a wall display. It can also be collapsed down flat where it can be taped on one side into a book and ‘pop up’ when required.