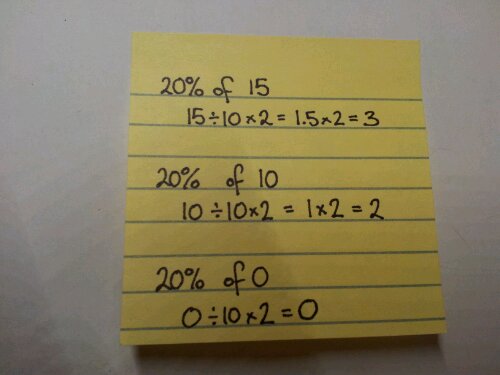
Percentages are all to do with proportion, but this seems to escape the understanding of some. If you calculate 20% of £15, this is different to 20% of £25. The 20% is not a fixed quantity. How can you explain this to visual learners?
Visual Percentages/Proportion
Equipment
Pencil
Ruler
Paper – squared makes the task easier
Coloured pencils (optional)
Calculations
Find 20% of 15, 10 and 0.
Construction
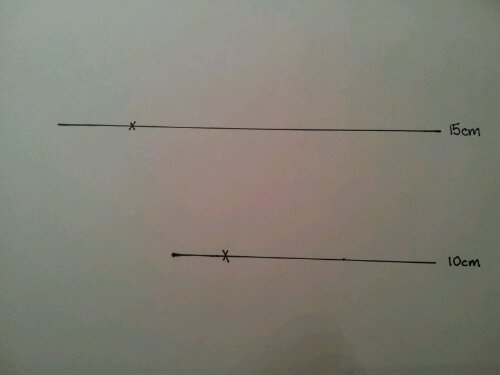
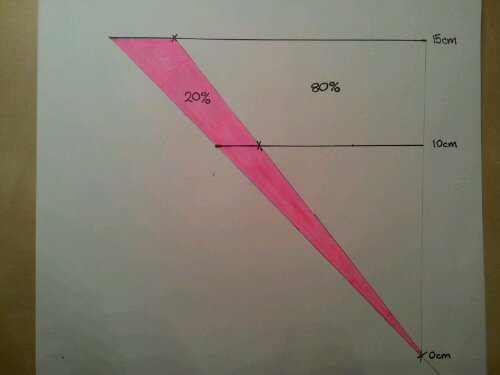
Draw a 15cm line, mark 3cm along it.
Move down 5cm.
Draw a line, mark 2cm along it.
Join the ends of the lines with a ruler and indicate this with a cross.
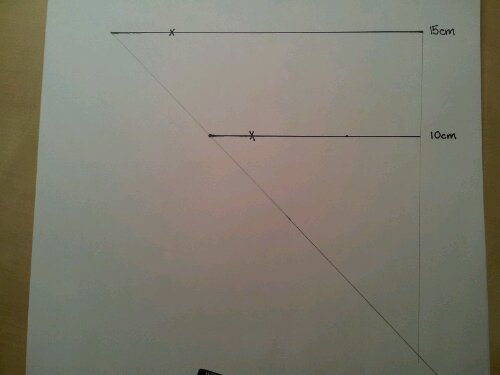
This should be 10cm lower than the bottom line.
Repeat, joining the 3cm and 2cm points.
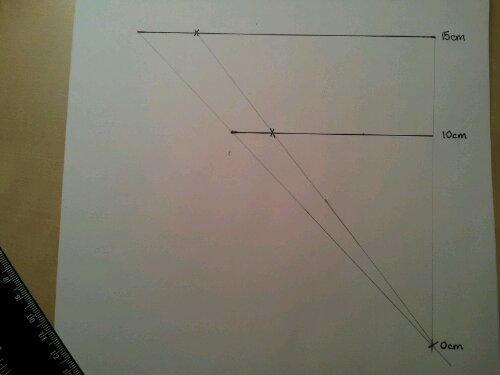
Shade in the smaller triangle.
Label the lines.
The Maths bit
The width of the triangle indicates the whole amount (100%).
The shaded width represents 20%.
The unshaded width represents 80% (Ask students if they know why).
The whole diagram represents 20% of any number from 0 to 15.
This can be adapted for any number and percent. It visually shows that as a number gets bigger the percent increases proportionally.
You can also use this to investigate fractions.
Note: This is for comparing widths. You can challenge your students to prove whether it is also true for the areas of the triangles.

