Tag Archives: distance

298. The Mensuration Challenge

Here is a fun little activity, including task sheet, for recapping measuring distance, time and angles.

Image credit: freepik.com

It’s simply a set of mini-challenges designed to familiarise students with practical equipment and get them out of their seats. We had lots of fun measuring all sorts of things – width of a smile, length of a tongue, angle of a nose, time spent on one leg – the limit was their creativity!

Mensuration Challenges (pdf)

Mensuration Challenges (docx – editable)

264. Distance-Time Drama

*HEALTH WARNING*
You may require nerves of steel to complete this dramatic construction of a distance-time graph. A mental swear box may also be handy for everytime you resist the urge to say what you are thinking. Strong coffee is not advisable as you want to be the image of serenity, not a jittery wreck.

Ready? We shall begin …

Aim
To construct distance-time graphs from collected data and interpret the speed from a graph.

Equipment
Metre sticks or tape measure
Open area outside
Pencils
Paper (squared/graph etc)
Ruler
Calculator
Stopwatch (or mobile phone app)
Chalk (optional)
Spreadsheet (optional)

Activity – in theory

  1. Group your students in threes. They will rotate roles between runner, timer and recorder.
  2. Pick four points in your school yard that are a reasonable distance apart. Chalk X’s and A to D next to them. Your graph will start at A and end at D. If you have the space you can create more than just four points.
  3. Students are responsible for measuring the distance between A & B, B & C and C & D. These are the three activity stations.
  4. Students take it in turns in their groups to run (walk, hop, dance etc) between two points. The time for each student at each station is recorded.
  5. Once the data is collected, students gather the information in a table – cumulative time & distance columns will be helpful for plotting a distance time graph.
  6. Each student draws three graphs, on the same axes, to represent the speeds of their group.
  7. Each student then calculates their speed for each station. They can compare their calculations with their group and what is going on in the graph. Hopefully they will deduce that the gradient of the graph represents the speed.

Activity – in practice

Where to start?

Please … don’t be disheartened if your activity starts like mine did! We got organised and went outside. I designated groups to stations and they started measuring, moving onto the next station when they were done.

One group came up to me and complained that the distances were all the same. Rather than hold onto the end of the tape measure at the start, then measure, this group put the end on the ground, spooled out the tape measure and walked to the next station – trailing the end of the tape along the floor.

A second group complained that the other groups were spending too long on measuring when they were waiting for a tape measure. I’d counted them out one per group – where was it?

‘Oh, we left that in the classroom’.
Mental gnashing of teeth.
‘Would that be the locked classroom?’ I ask
‘Yeah … we’ll get it’ off run two students
They come back complaining the classroom is locked!

Okay … we get the measuring done. Then they start running and timing. I check on one group and notice they are merrily taking all of their times away from ten minutes. They explain the mobile phone is counting down from ten minutes. Although I was impressed by their ingenuity, maybe changing the phone mode would have been more appropriate.

And let’s not mention the student who, on the final station, accidentally wiped all the results off the mini-whiteboard …

Then a miracle happened!

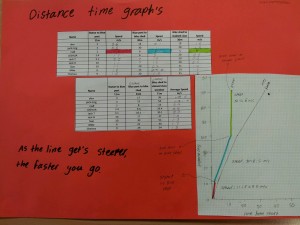
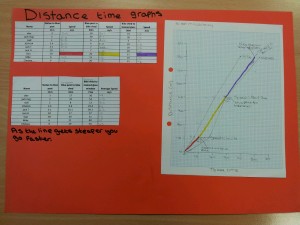
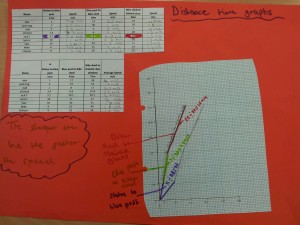
I collected their data together on a spreadsheet and projected it on the board. We discussed any anomalies and how we would progress. We decided neat printouts would help. They drew their graphs, colour coded their data and observed the gradient link to speed. I was very impressed by the speed at which they grasped this concept and proud of their (eventual) independent work.

Here is a sample of their work:
wpid-2015-03-02-14.23.33.jpg.jpeg

Example 2:

wpid-2015-03-02-14.24.12.jpg.jpeg

Example 3:wpid-2015-03-02-14.24.45.jpg.jpeg

255. Resource of the Week

I can’t wait to share the resource I stumbled across this week. I had planned a lesson on distance-time graphs, for my Foundation GCSE class, at home and went into school to print out my resources, only to discover the photocopier was broken!  I went to the TES website and found this brilliant set of resources on distance-time graphs. They required a small amount of printing, but engaged a ‘bouncy’ class very effectively!

Hare-and-The-Tortoise-Distance-time-graphs by lttmaths.

  • The PowerPoint presentation takes you through interpreting graphs. It also supports my teaching method of ‘every graph tells a story’.
  • The Disney cartoon (from 1934) entertained the class and introduced the idea that graphs are not just A to B in the fastest time. Although they were a little concerned about the age gap between the Hare and the schoolgirl bunnies he was flirting with.
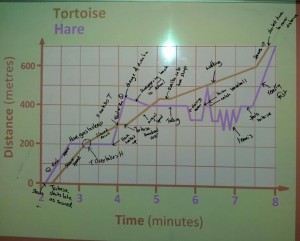
  • My usually less than enthusiastic class did an outstanding job explaining what the graphs showed, as shown by all these annotations:

distance time graphs

  • The activities and plenaries are a perfect fit.

Go and try out these resources next time you are working with distance-time graphs!

229. Speed Camera Maths

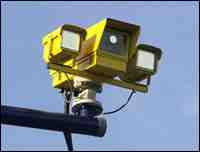
Speed Cameras are so last century: discerning law enforcement agencies favour the Average Speed Camera!

image

These motorway delights timestamp when you go through certain checkpoints and calculate your speed between them. No complicated laser guns required, just number plate recognition and a little distance/time calculation. This already sounds like a KS3/4 class activity or a Mechanics A-Level starter.

Equipment
Squared paper
Pencil
Ruler
Coloured pens
Calculator (optional)

Question
Can you find three different (safe) strategies for staying on the right side of the law through extended roadworks? You must average 40mph over 12 miles (original speed limit 60mph).

Visual Prompt
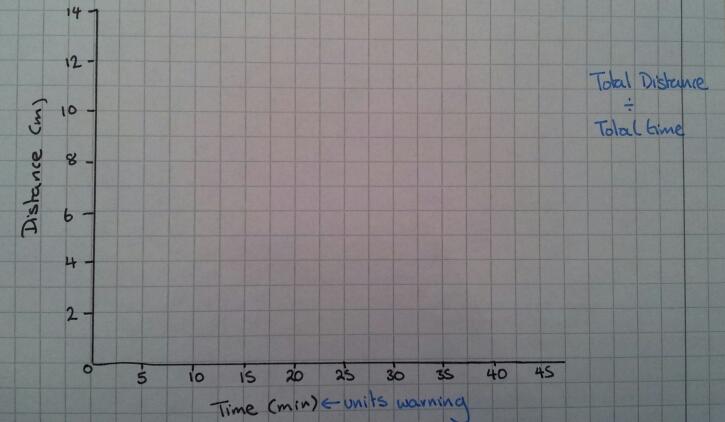
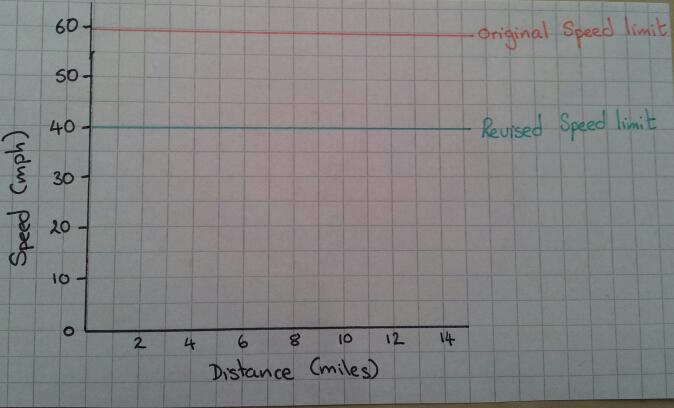
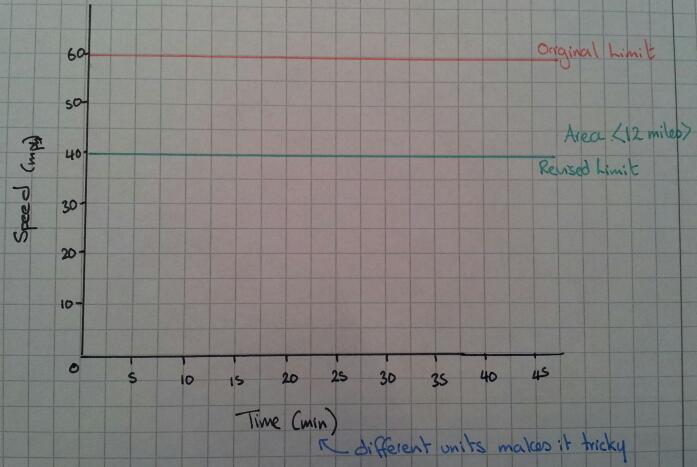
To start off with just draw out blank axes and discuss how you could visually represent this problem.

Idea 1
A distance-time graph

image

Idea 2
A speed-distance graph

image

Idea 3
A speed-time graph

image

The straightforward option
How long should it take you to get through the roadworks if you stick to exactly 40mph? What does this look like on a graph? Which type of graph shows this information best?

Top Gear Alert
The boy racer wants to go fast, but avoid a ticket – what could he do?

Hint
What does ‘Average Speed’ actually mean?
Can you instantly jump between speeds?
Is acceleration going to effect your calculations?
What assumptions should you make about acceleration?
Do you need to work out the area under the graph or the gradient at all? How will you do this?
Can you describe what is going on?
Is it safe/legal?

Outcome
Your students should be able to produce many different graphs of how to stay on the right side of an average speed zone. They should be able discuss their findings with each other. However the morality or safety of their driving ideas may be a topic of discussion for a later PSE lesson …

85. App of the day: Smart Tools

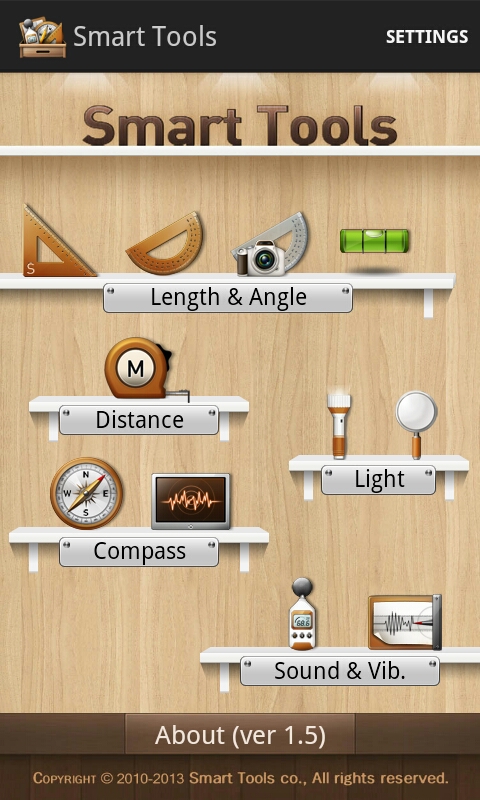
Smart tools was described by one reviewer as the ‘swiss army knife’ of apps. I think I agree!

image

You can measure distance, angles, direction, height, sound, vibration, bearings and even turn your phone into a torch, spirit level or a magnifying glass! It’s very handy for practical activities outside. The set up for different measuring elements gives you the maths behind the result too.

I’ve used it to do bearings activities and treasure hunts. I’ve also used the height measuring mode as an introduction to pythagoras.

Official demo video

Individual elements can be purchased separately for free or 65p (correct at time of publishing) each. Or you can download everything in one go. Search for ‘smart tools’ on the Play store or go to: Smart tools website