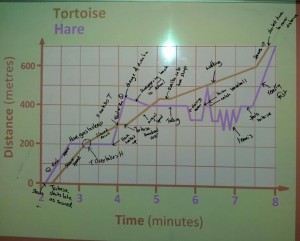
I can’t wait to share the resource I stumbled across this week. I had planned a lesson on distance-time graphs, for my Foundation GCSE class, at home and went into school to print out my resources, only to discover the photocopier was broken! I went to the TES website and found this brilliant set of resources on distance-time graphs. They required a small amount of printing, but engaged a ‘bouncy’ class very effectively!
Hare-and-The-Tortoise-Distance-time-graphs by lttmaths.
- The PowerPoint presentation takes you through interpreting graphs. It also supports my teaching method of ‘every graph tells a story’.
- The Disney cartoon (from 1934) entertained the class and introduced the idea that graphs are not just A to B in the fastest time. Although they were a little concerned about the age gap between the Hare and the schoolgirl bunnies he was flirting with.
- My usually less than enthusiastic class did an outstanding job explaining what the graphs showed, as shown by all these annotations:
- The activities and plenaries are a perfect fit.
Go and try out these resources next time you are working with distance-time graphs!


Pingback: 272. Mr Men Maths Mobiles | Maths Sandpit