Designing good survey questions is an excellent way to discuss bias and structure, however carrying out the survey is always the tricky bit.
- Do you ask the class next door? Always seems more of a social exercise than work
- Do you set it as homework? Bit hit and miss: mum, dad, nan, dog & a couple of fictional people
- Do you survey your form? Will they take it seriously?
No matter how you do it, the results are always sparse and barely useable for a data processing task. How can you get a reasonable data set, generated by pupils, for pupils to use?
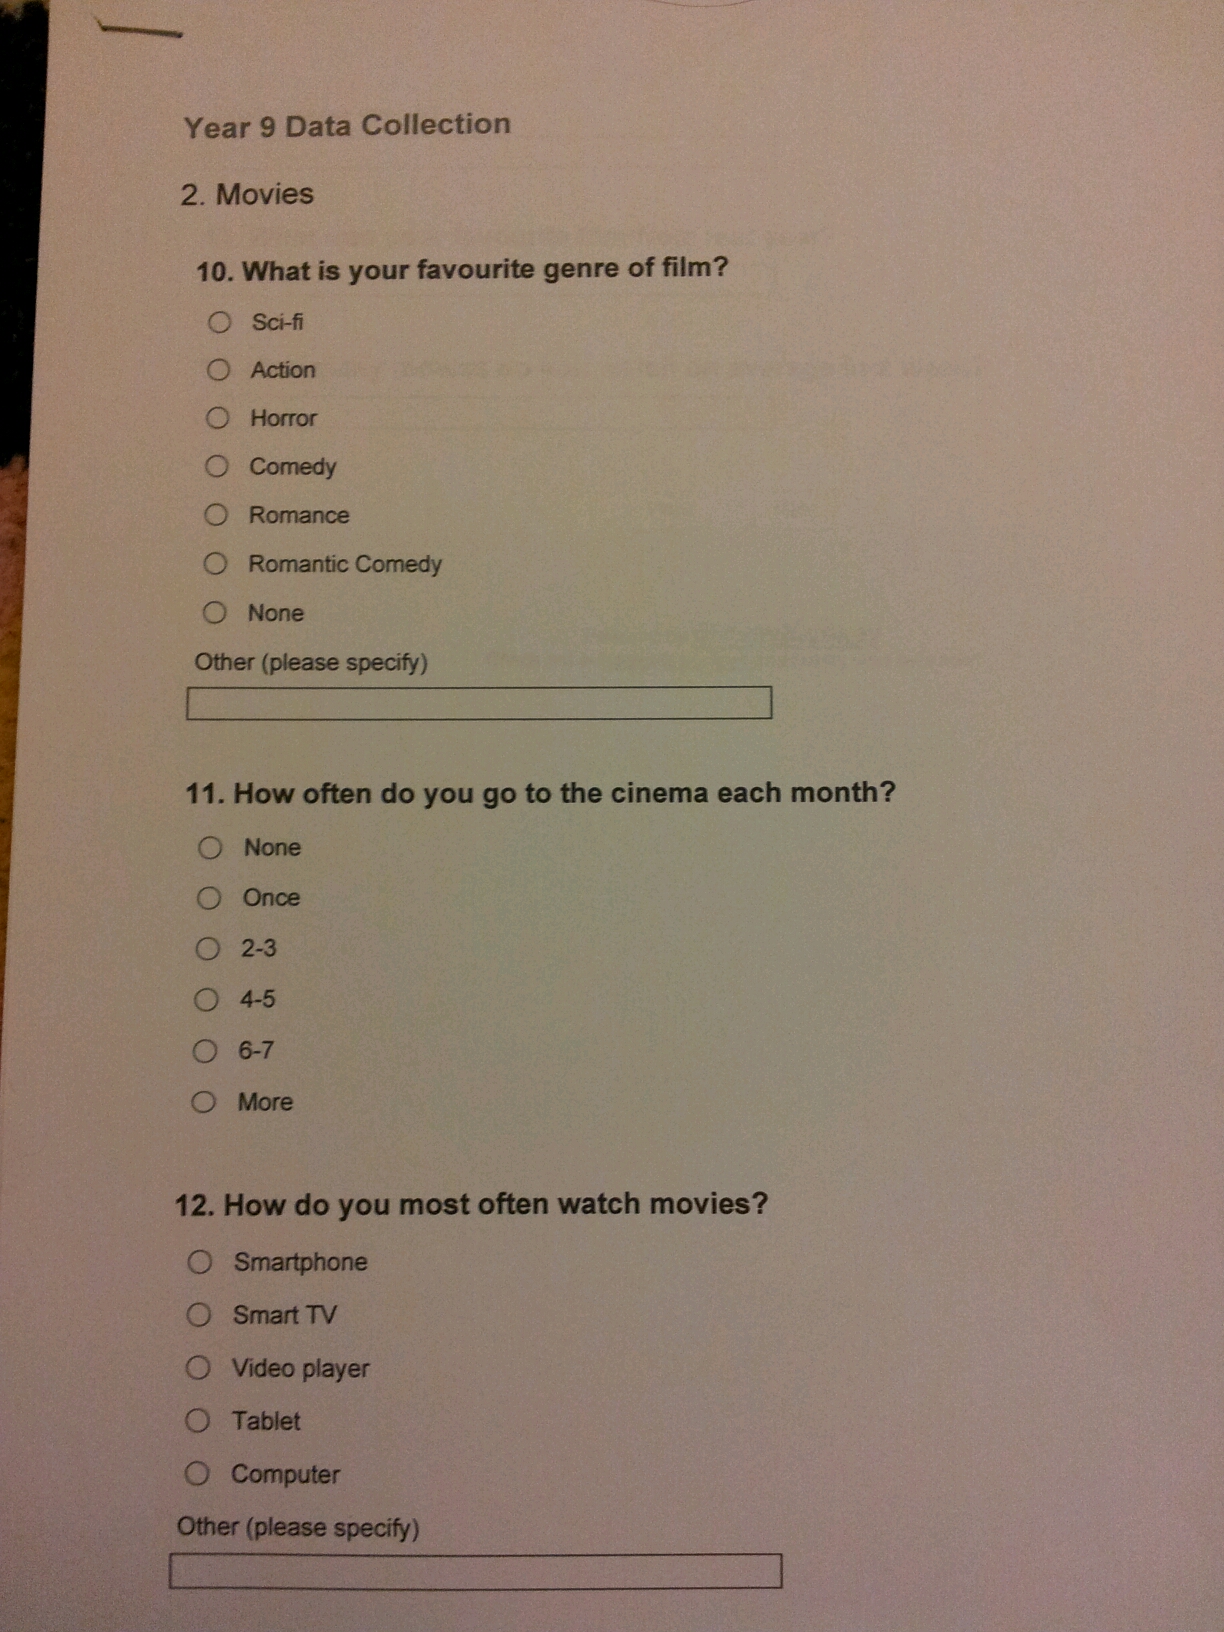
I’ve mentioned SurveyMonkey in a previous blog post. It is an online data collection tool with free and subscription services. I asked my Year 9 pupils to write five themed questions, which I then typed into SurveyMonkey. Each set of questions was on a separate page.
I then used our home/school communication system to email a link to the survey to every pupil in their year group, with a covering email. You could distribute the link by asking your fellow maths teachers to tell their classes.
I set the first page of the survey as a list of maths teachers. When my class did the survey they were taken to a class list which they ticked off their name and then did the survey. All other classes were taken straight to the survey. In this way the survey results are anonymous, but I know whether my class have completed it (this was their homework). After two weeks we had 100 completed surveys, out of about 200 pupils. This is an amazing completion rate!
While the data was being collected we looked at data processing skills that would be necessary to collate and process the results. The image below is a sample of the collected data printed from Excel.
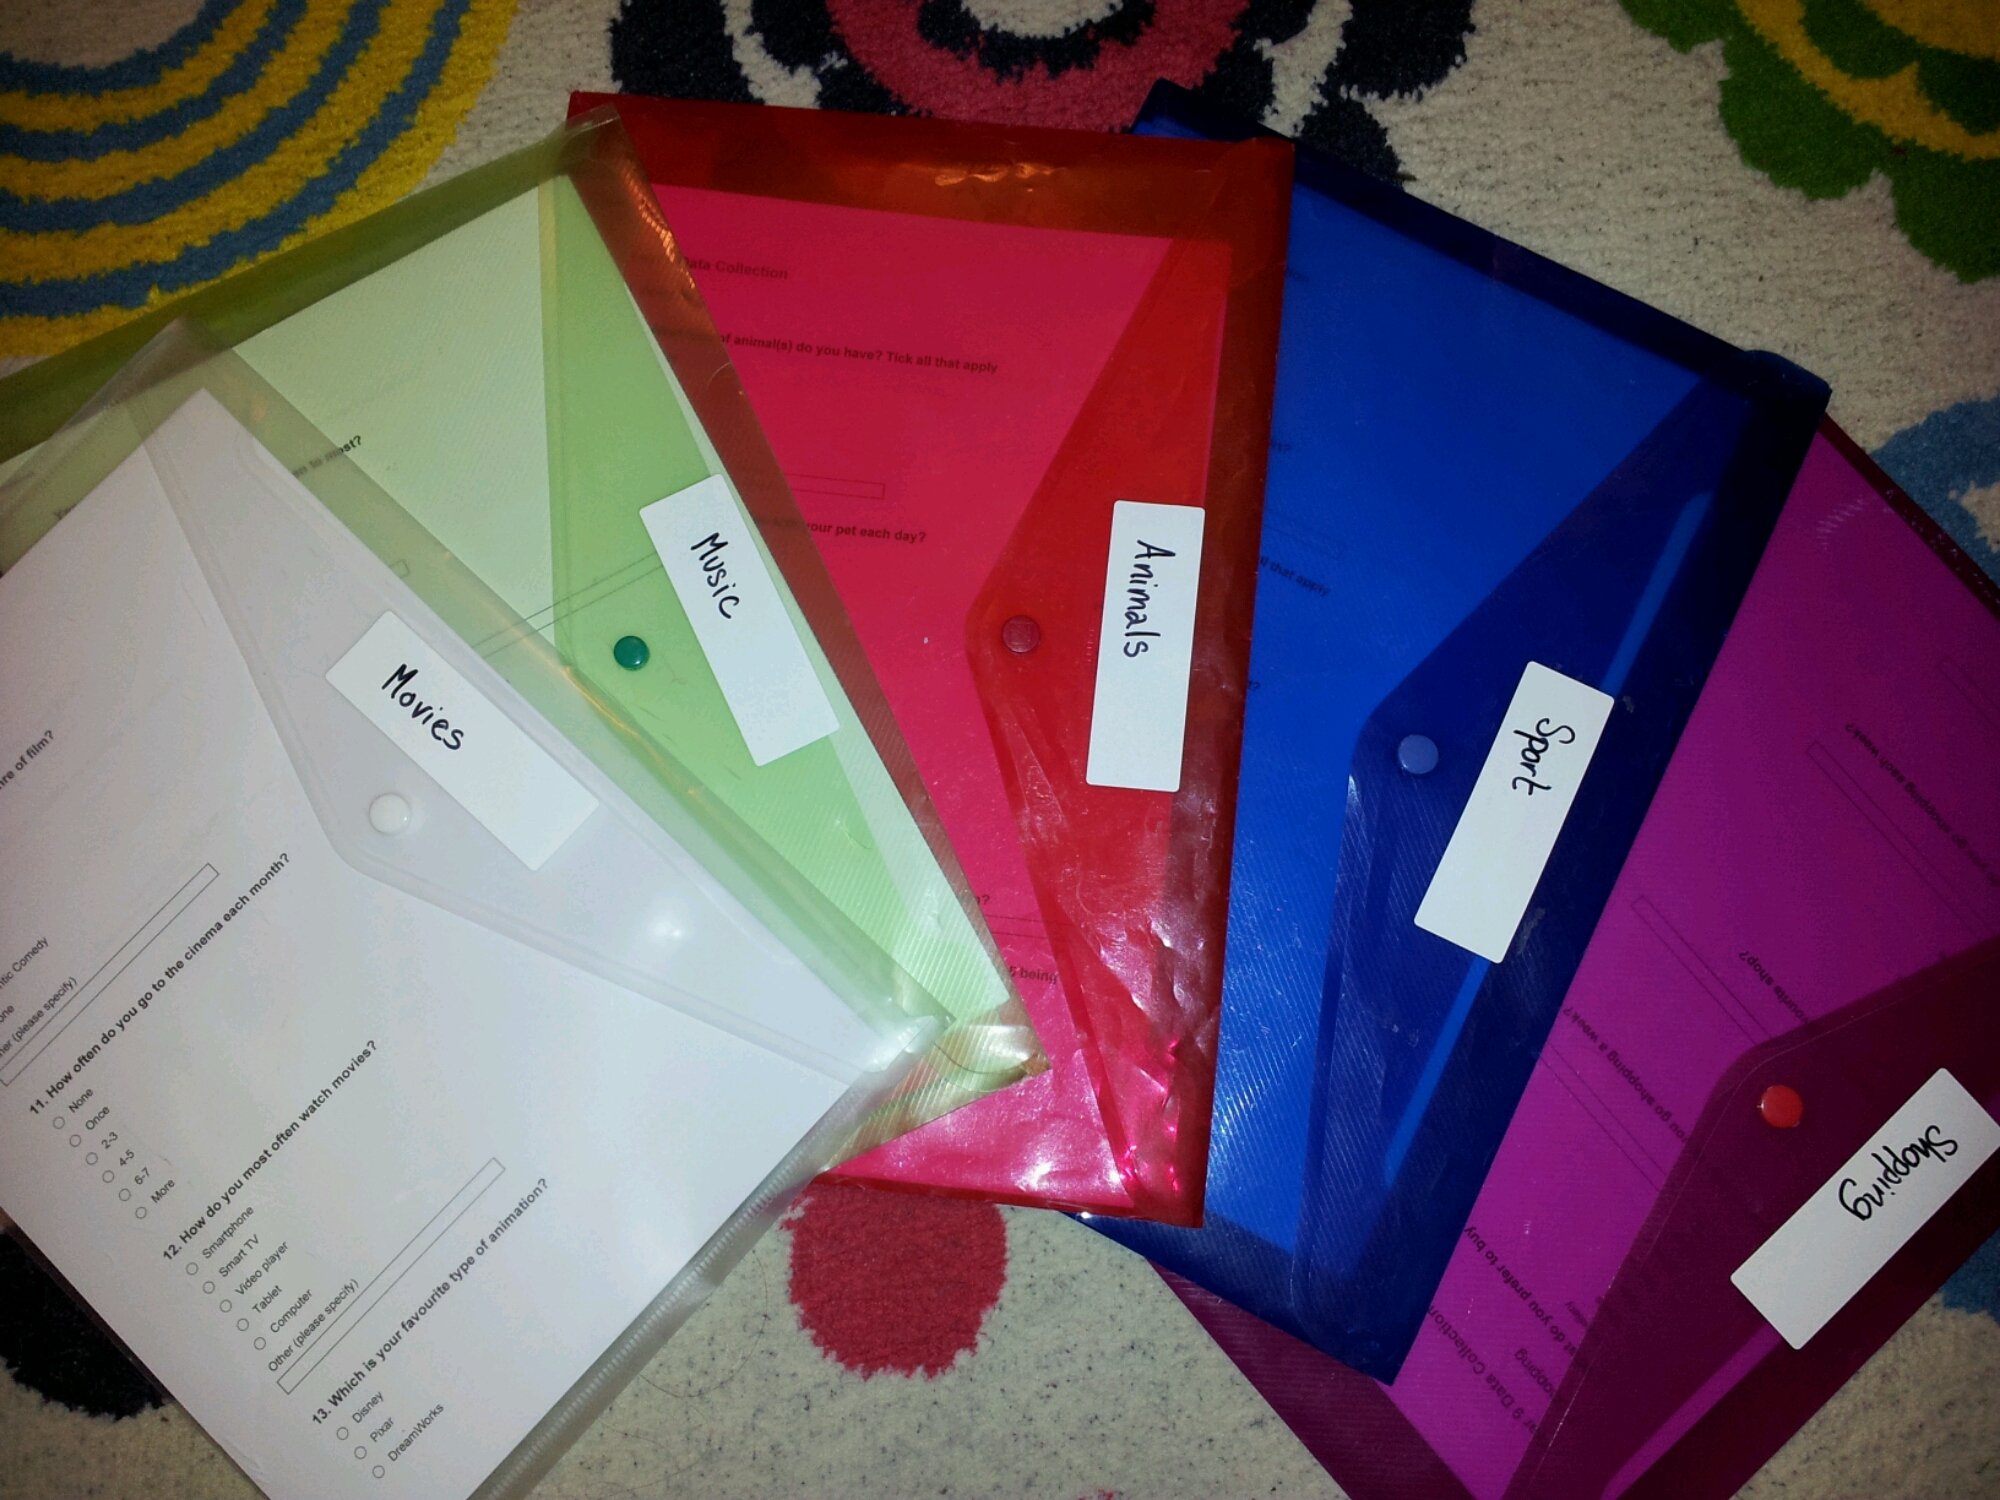
After the results were in I printed out a copy of each set of questions and an Excel spreadsheet of their survey results for each group. The themes chosen were: Movies, Music, Shopping, Animals & Sport.
It’s now time for my class to report back on their theme, after dealing with a large data set with anomalies and relate it to their year group. When they have finished I will add a picture of their wall displays. I’m looking forward to seeing how they develop their ideas.


