Category Archives: Shape, Space & Measures

190. Visual Compound interest

So you’ve reached that bit of the Number curriculum at the end of Percentages – Simple and Compound interest. The theory is straight forward enough:

  • Simple interest is calculated on the original balance.
  • Compound interest is calculated fresh every year on the current balance.

This shouldn’t be a tricky concept, yet it is frequently  glossed over or partially taught to lower ability students. This is the maths they’ll need to get their head around at the bank in a few years time. So why not replace the scary calculations and rote learning with diagrams, which embed understanding.

Equipment

  • Coloured pens
  • Whiteboard
  • Squared paper
  • Ruler
  • Calculator (Optional)

Simple Interest: Step 1

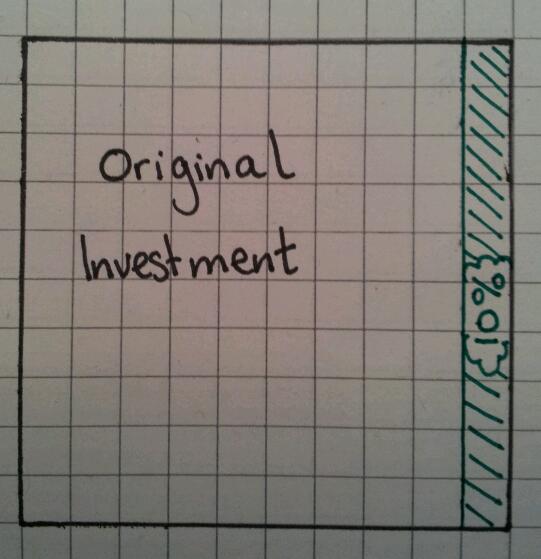
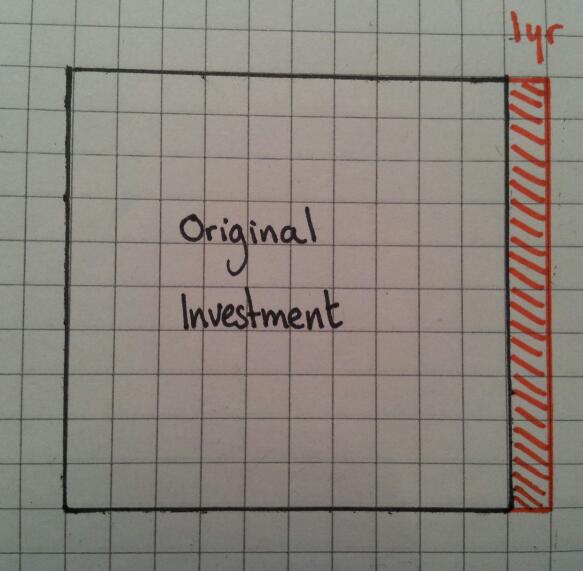
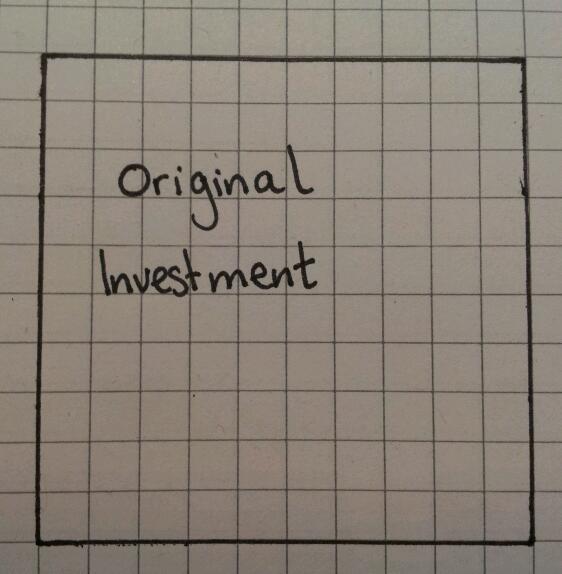
Draw a square which has sides which are a multiple of ten (I used 10×10). This area represents the original investment.

image

Step 2

Assume the interest rate is 10%. Calculate 10% of the area and shade it in lightly. Basically one column, since it’s a 10×10 grid.

image

Step 3

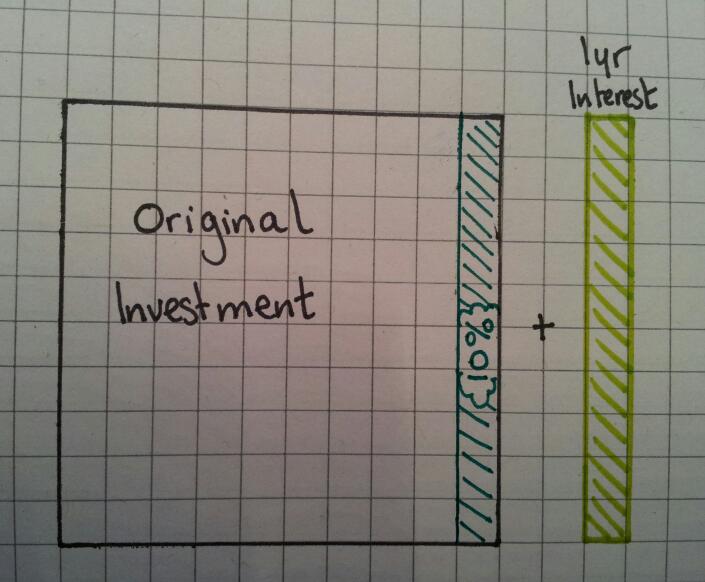
Add on 10% by drawing the shaded area again. This is the 1st interest payment.

image

Step 4

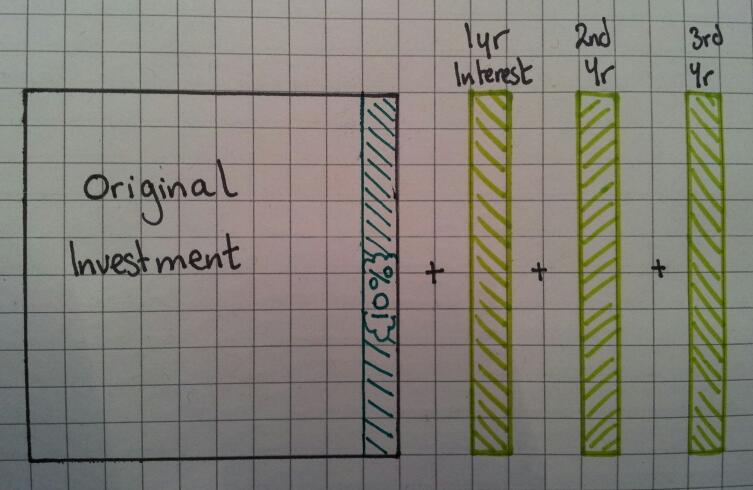
Repeat Step 3 for the 2nd and 3rd years.

image

Step 5

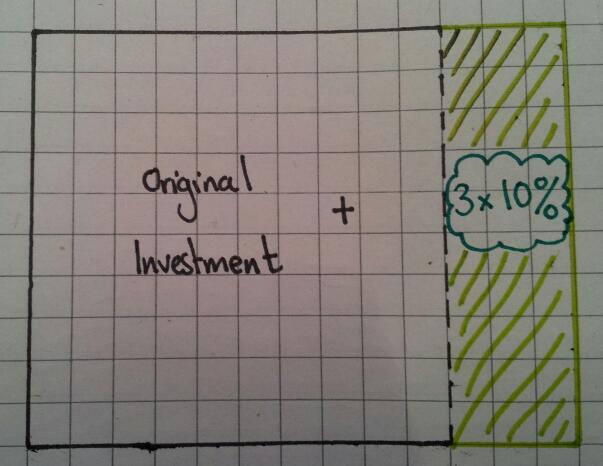
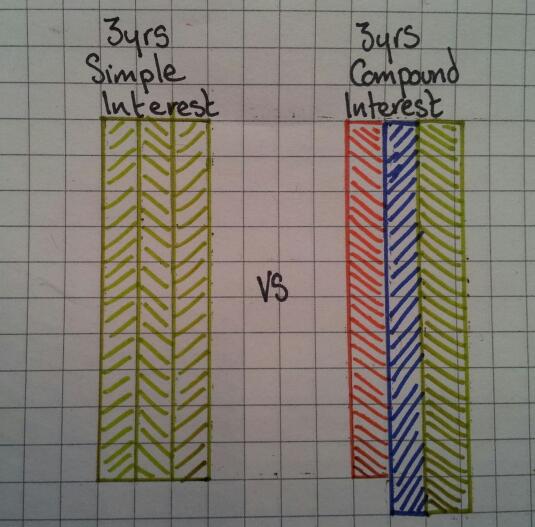
In summary, a simple interest (10%) investment over 3 years is the same as adding on 30%.

image


Compound Interest: Step 1

Repeat steps 1 -3 of simple interest

image

Step 2

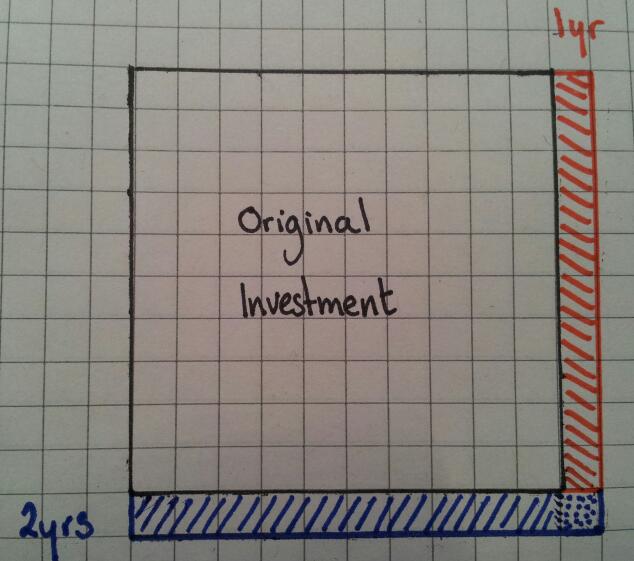
Work out 10% of the height and draw a new row – since the grid is 10 squares high, it’s simply one square high.

image

Notice that the row is wider than the original square – the dotted area indicates the extra interest earned on the previous years interest. This starts the discussion that you are not adding on the same amount each time.

Step 3

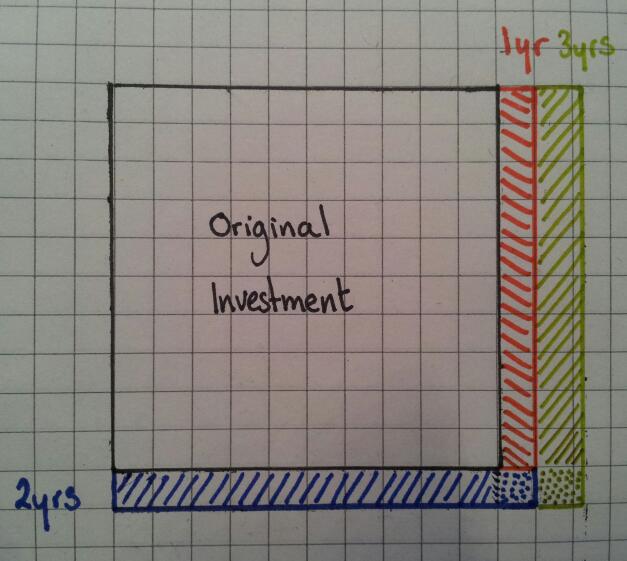
Using the same concept as Step 2, work out 10% of the width of the diagram. This time the width is a little more than one square wide.

image

Once again it’s clear to see that you are adding on more than the last year.


Comparison: Simple vs Compound interest

Which is the better investment? It’s pretty clear to see:

image

You can compare these two types of interest using area calculations, rather than long lists of percentage calculations and you can actually ‘see’ the different methods.



188. Ducks, chalk and gravity

So how did TeachMeet result in me standing in a supermarket one evening doing a price comparison of duct tape?

Let us go back in time to #mathsmeetnorthwest. Dave Usher did a brilliant presentation on ‘Big Maths’, including the use of gaffer (duct) tape in lessons. I thought this was a genius idea – sticky, sturdy and temporary. I didn’t get a chance to buy any at the weekend, so I ended up in the supermarket on a weeknight.

But what to buy?

Cheap own brand duct tape at £2.95 for 15m or branded ‘Duck’ tape at £3.95 for 25m?

I started school the next day with one idea on how to use it, which quickly developed into three..

Lesson 1: Averages

Equipment: Duct tape, liquid chalk marker

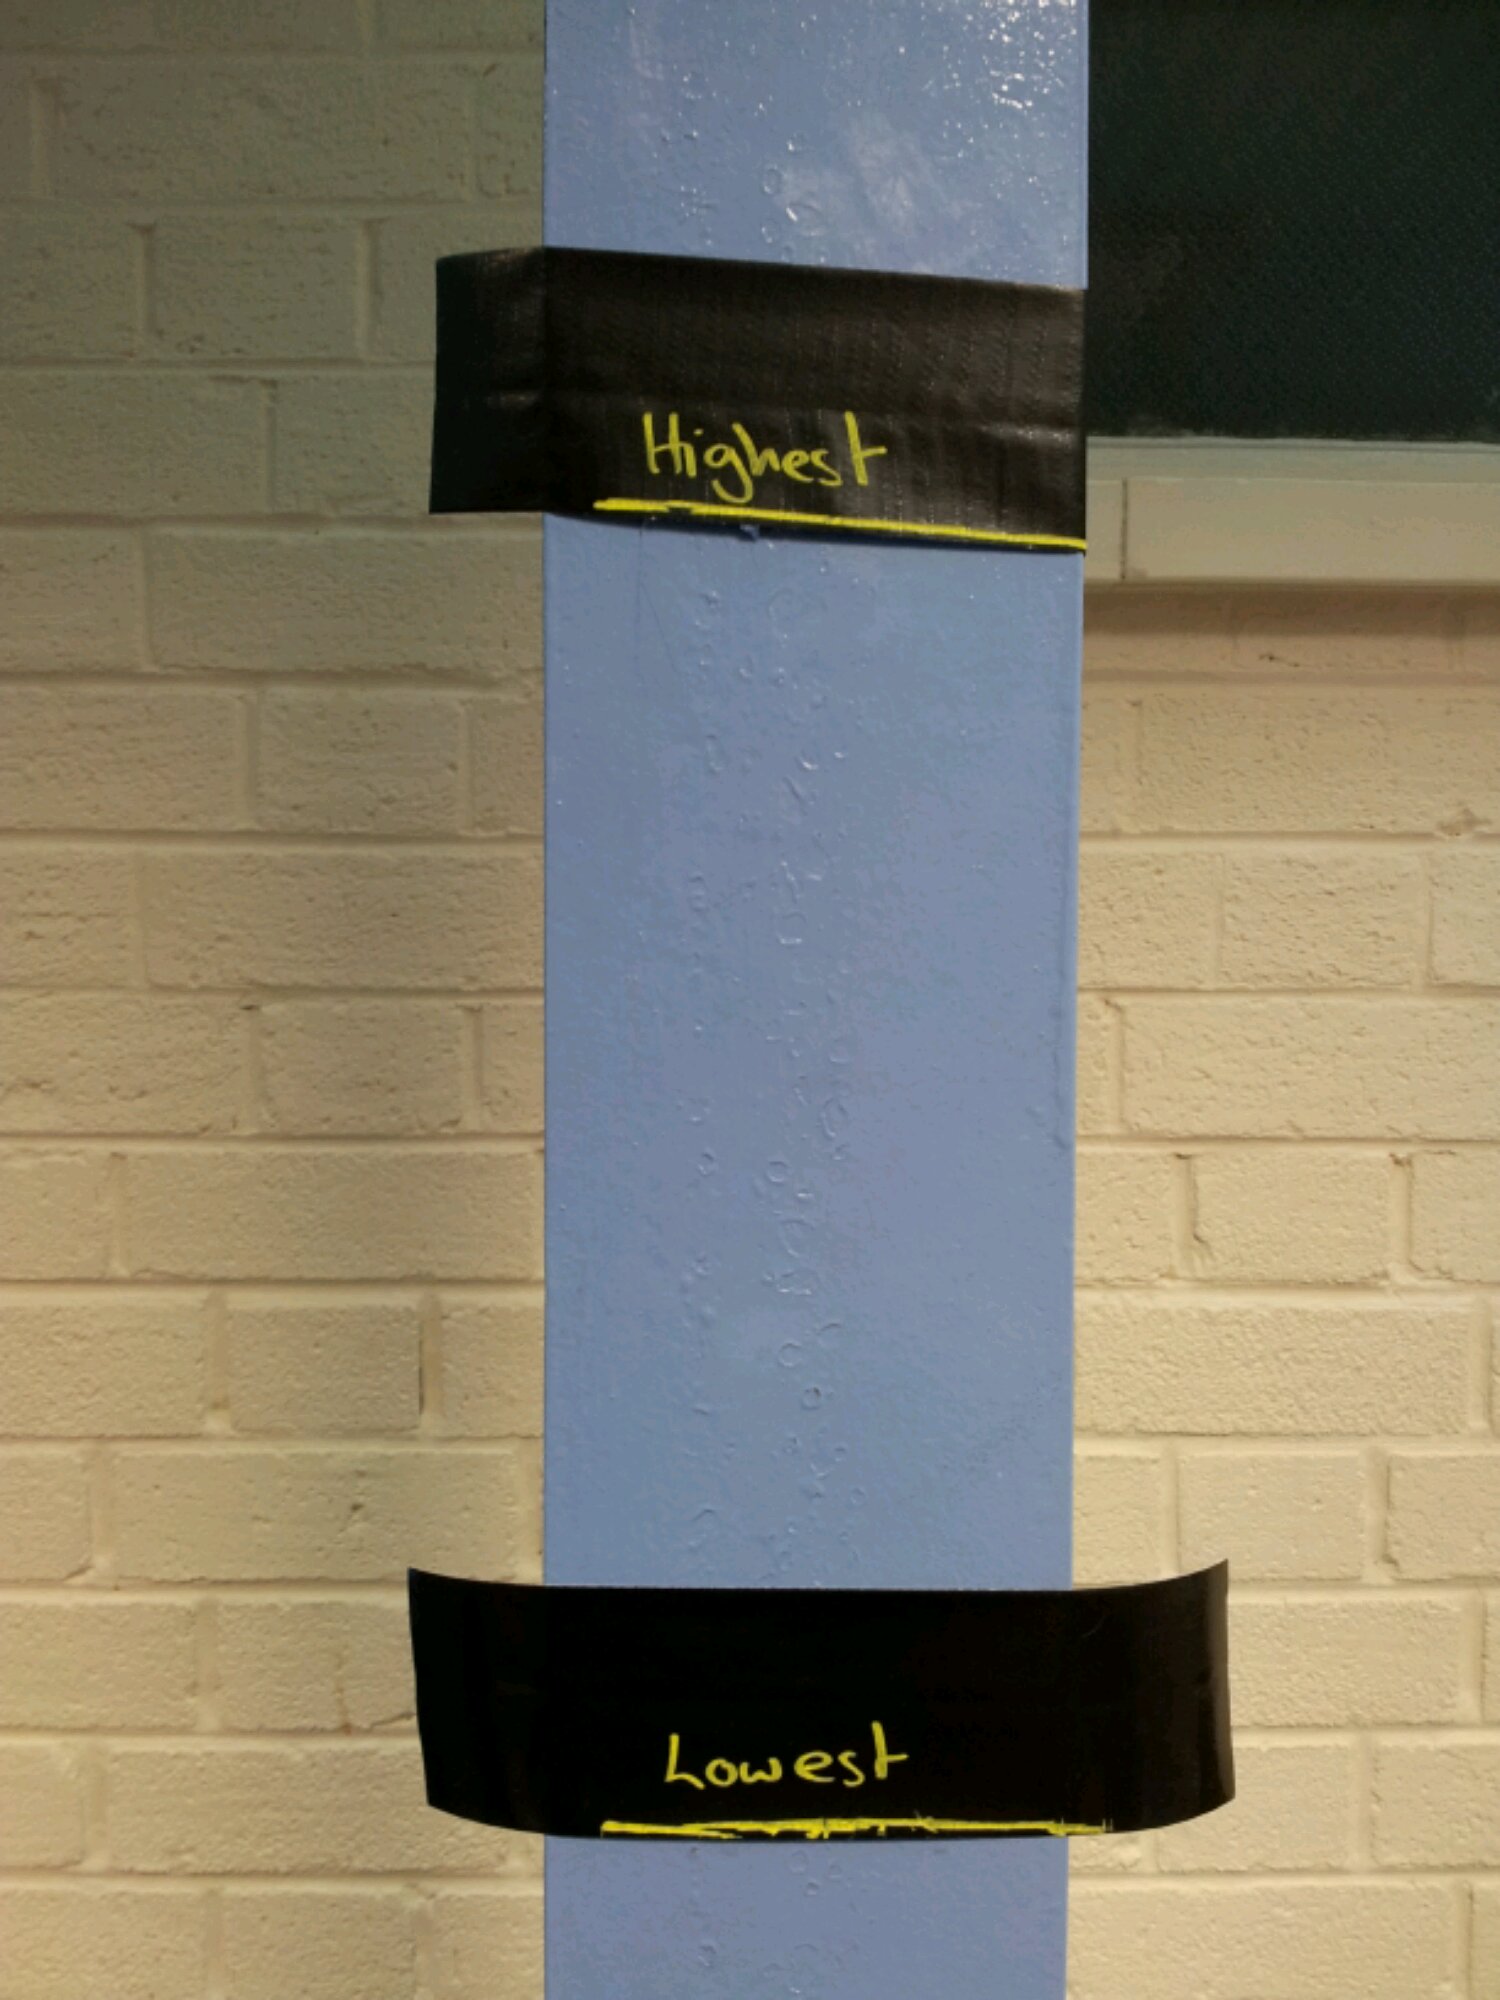
I did averages and range indoors. This meant I couldn’t chalk the walls or floor. However I could mark out key features with tape. I used the activity Averages and marked out the median, the highest and lowest values on the floor. It was at this point I figured out I could write on black duct tape with liquid chalk marker – brilliant! We labelled the wall with the highest and lowest heights of the class so we could see the actual range of heights.

image


Lesson 2: GCSE Revision

Equipment: Exam papers, scissors, glue, wall paper, duct tape

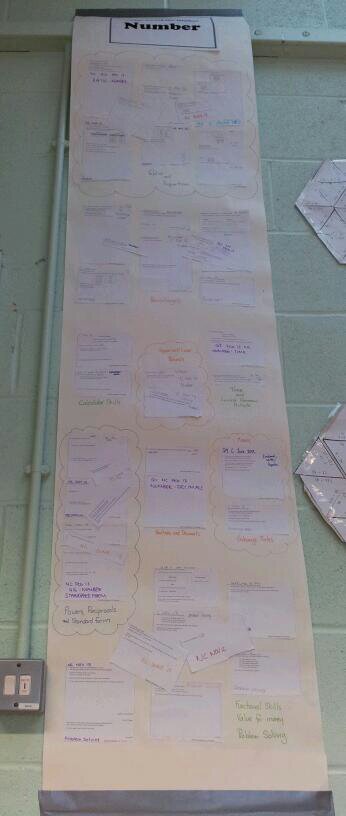
I have been using the Foundation GCSE Review with my Higher GCSE resit group. Reviewing ten Higher GCSE papers involves over 200 questions – that’s a big wall display! Both of the TeachMeets I have attended have used the idea of learning wallpaper. So that’s what we used – I’m grateful that some of my students are over 6ft tall or the wall display wouldn’t have gone up.

image

Now the duct tape was used to secure the top of the wall display and to ‘passer-by’ proof the bottom. It should last longer now that the lower end is reinforced.

image


Lesson 3: A-Level Mechanics

Equipment: Duct tape, liquid chalk, mobile phones, calculators, soft ball (I used a ball of wool)

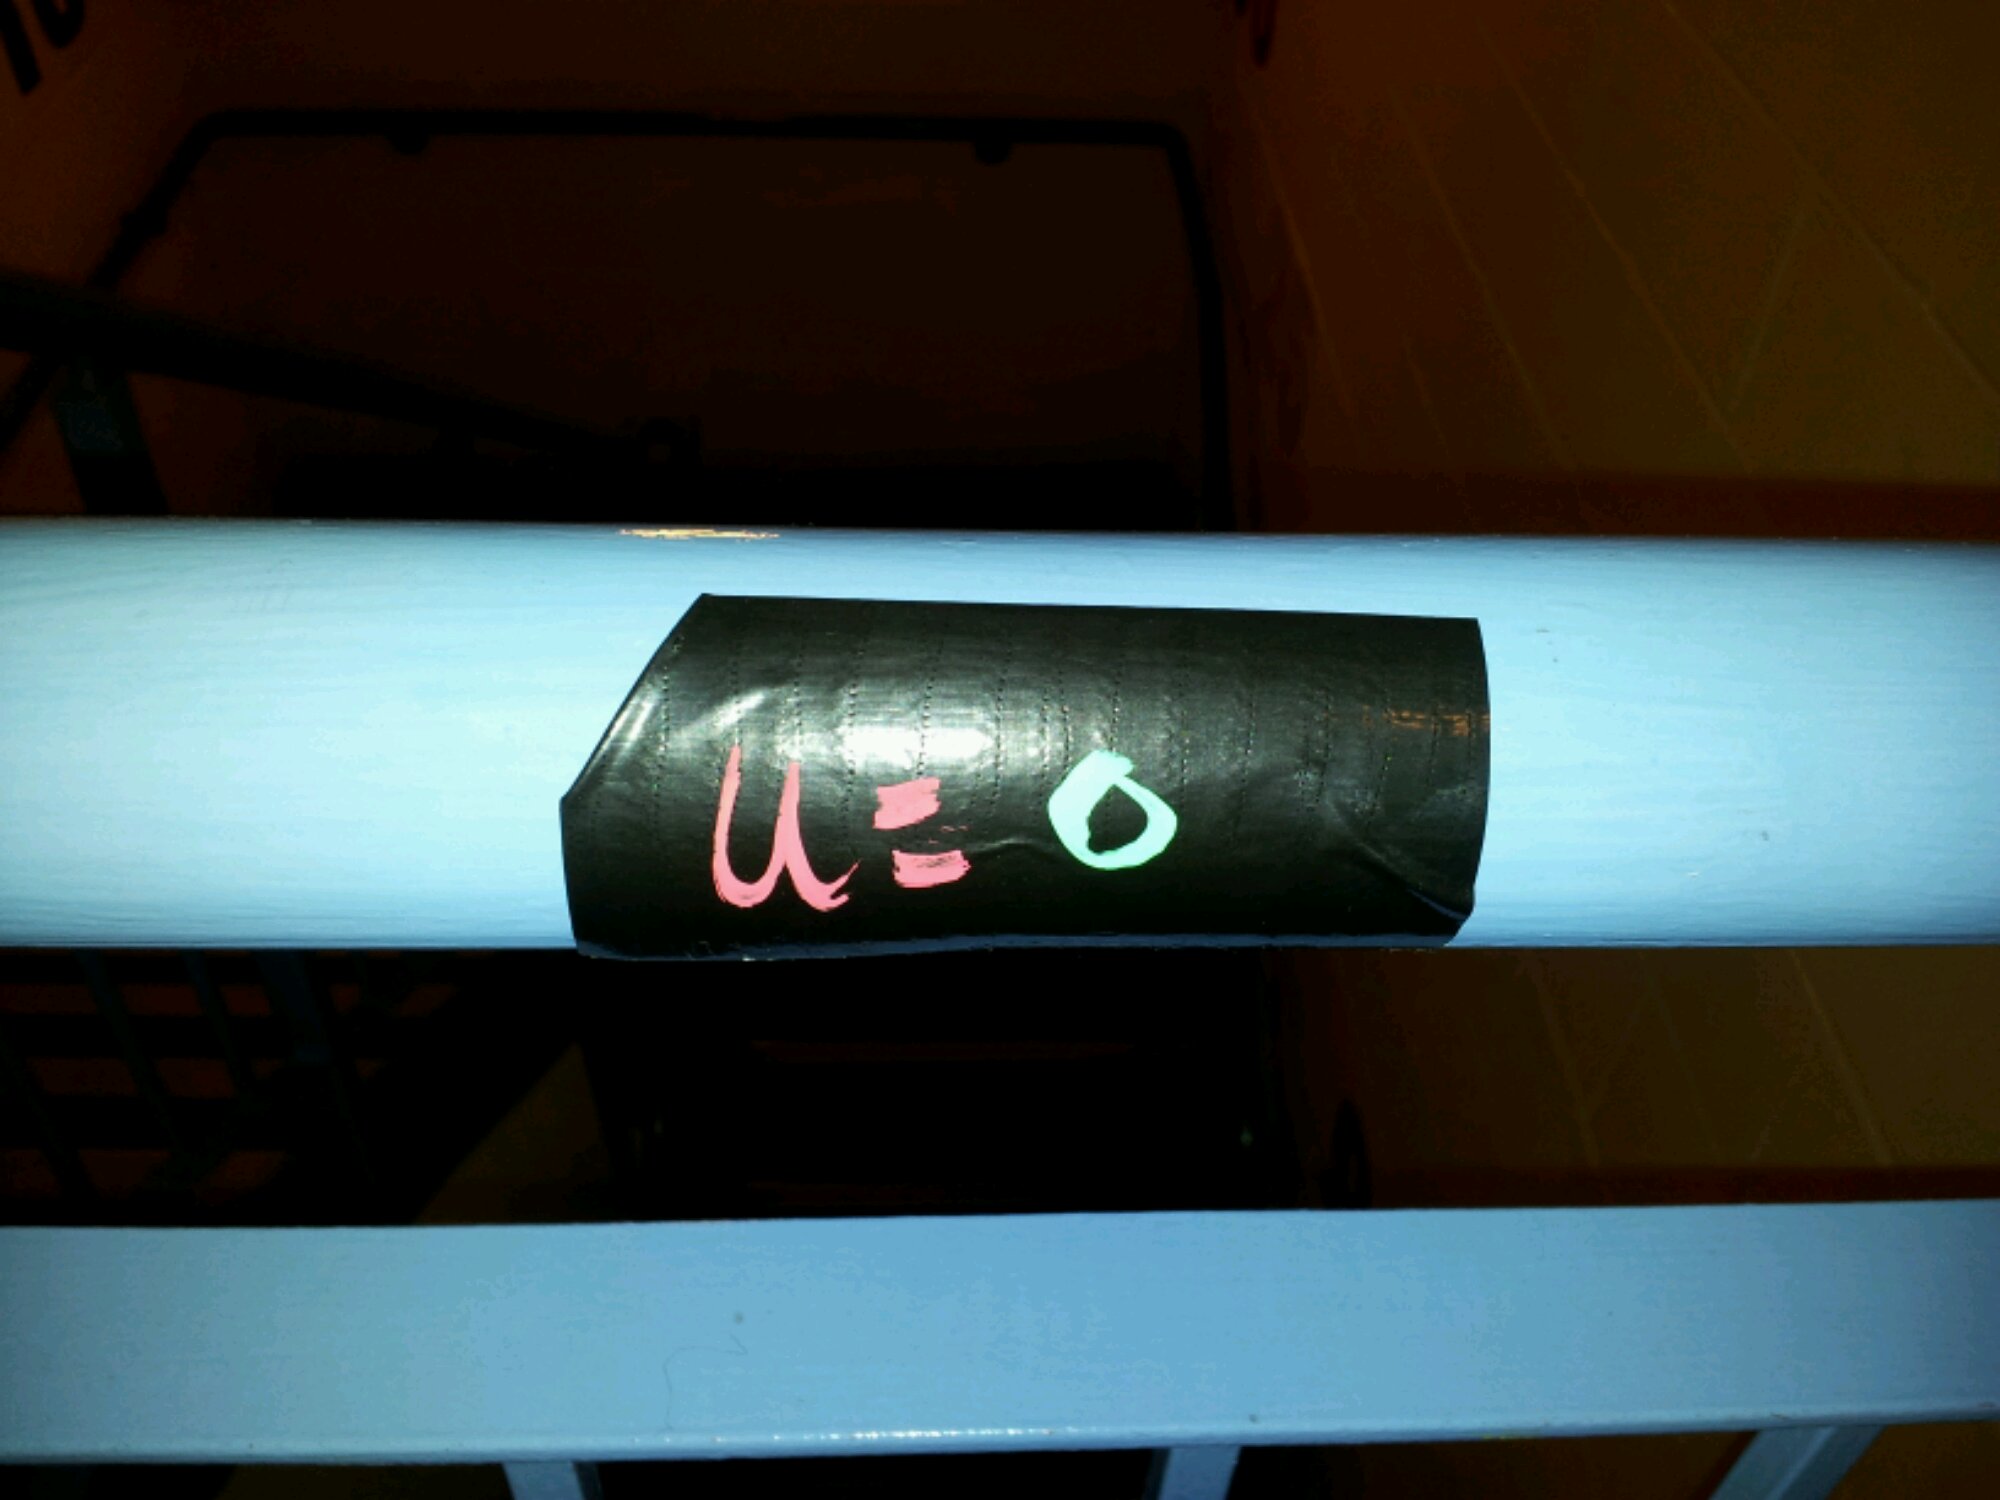
It’s all very well drawing diagrams for A-Level Mechanics questions, but how about a life size diagram? We were looking at vertical motion under freefall/gravity. I gave the students pieces of duct tape chalk labelled with a, s, u, v, t. We went to the staircase and labelled the wall with the tape – so u (initial velocity) was taped to the top of the bannister and v (final velocity) went on the floor at the bottom of the stairs, etc.

image

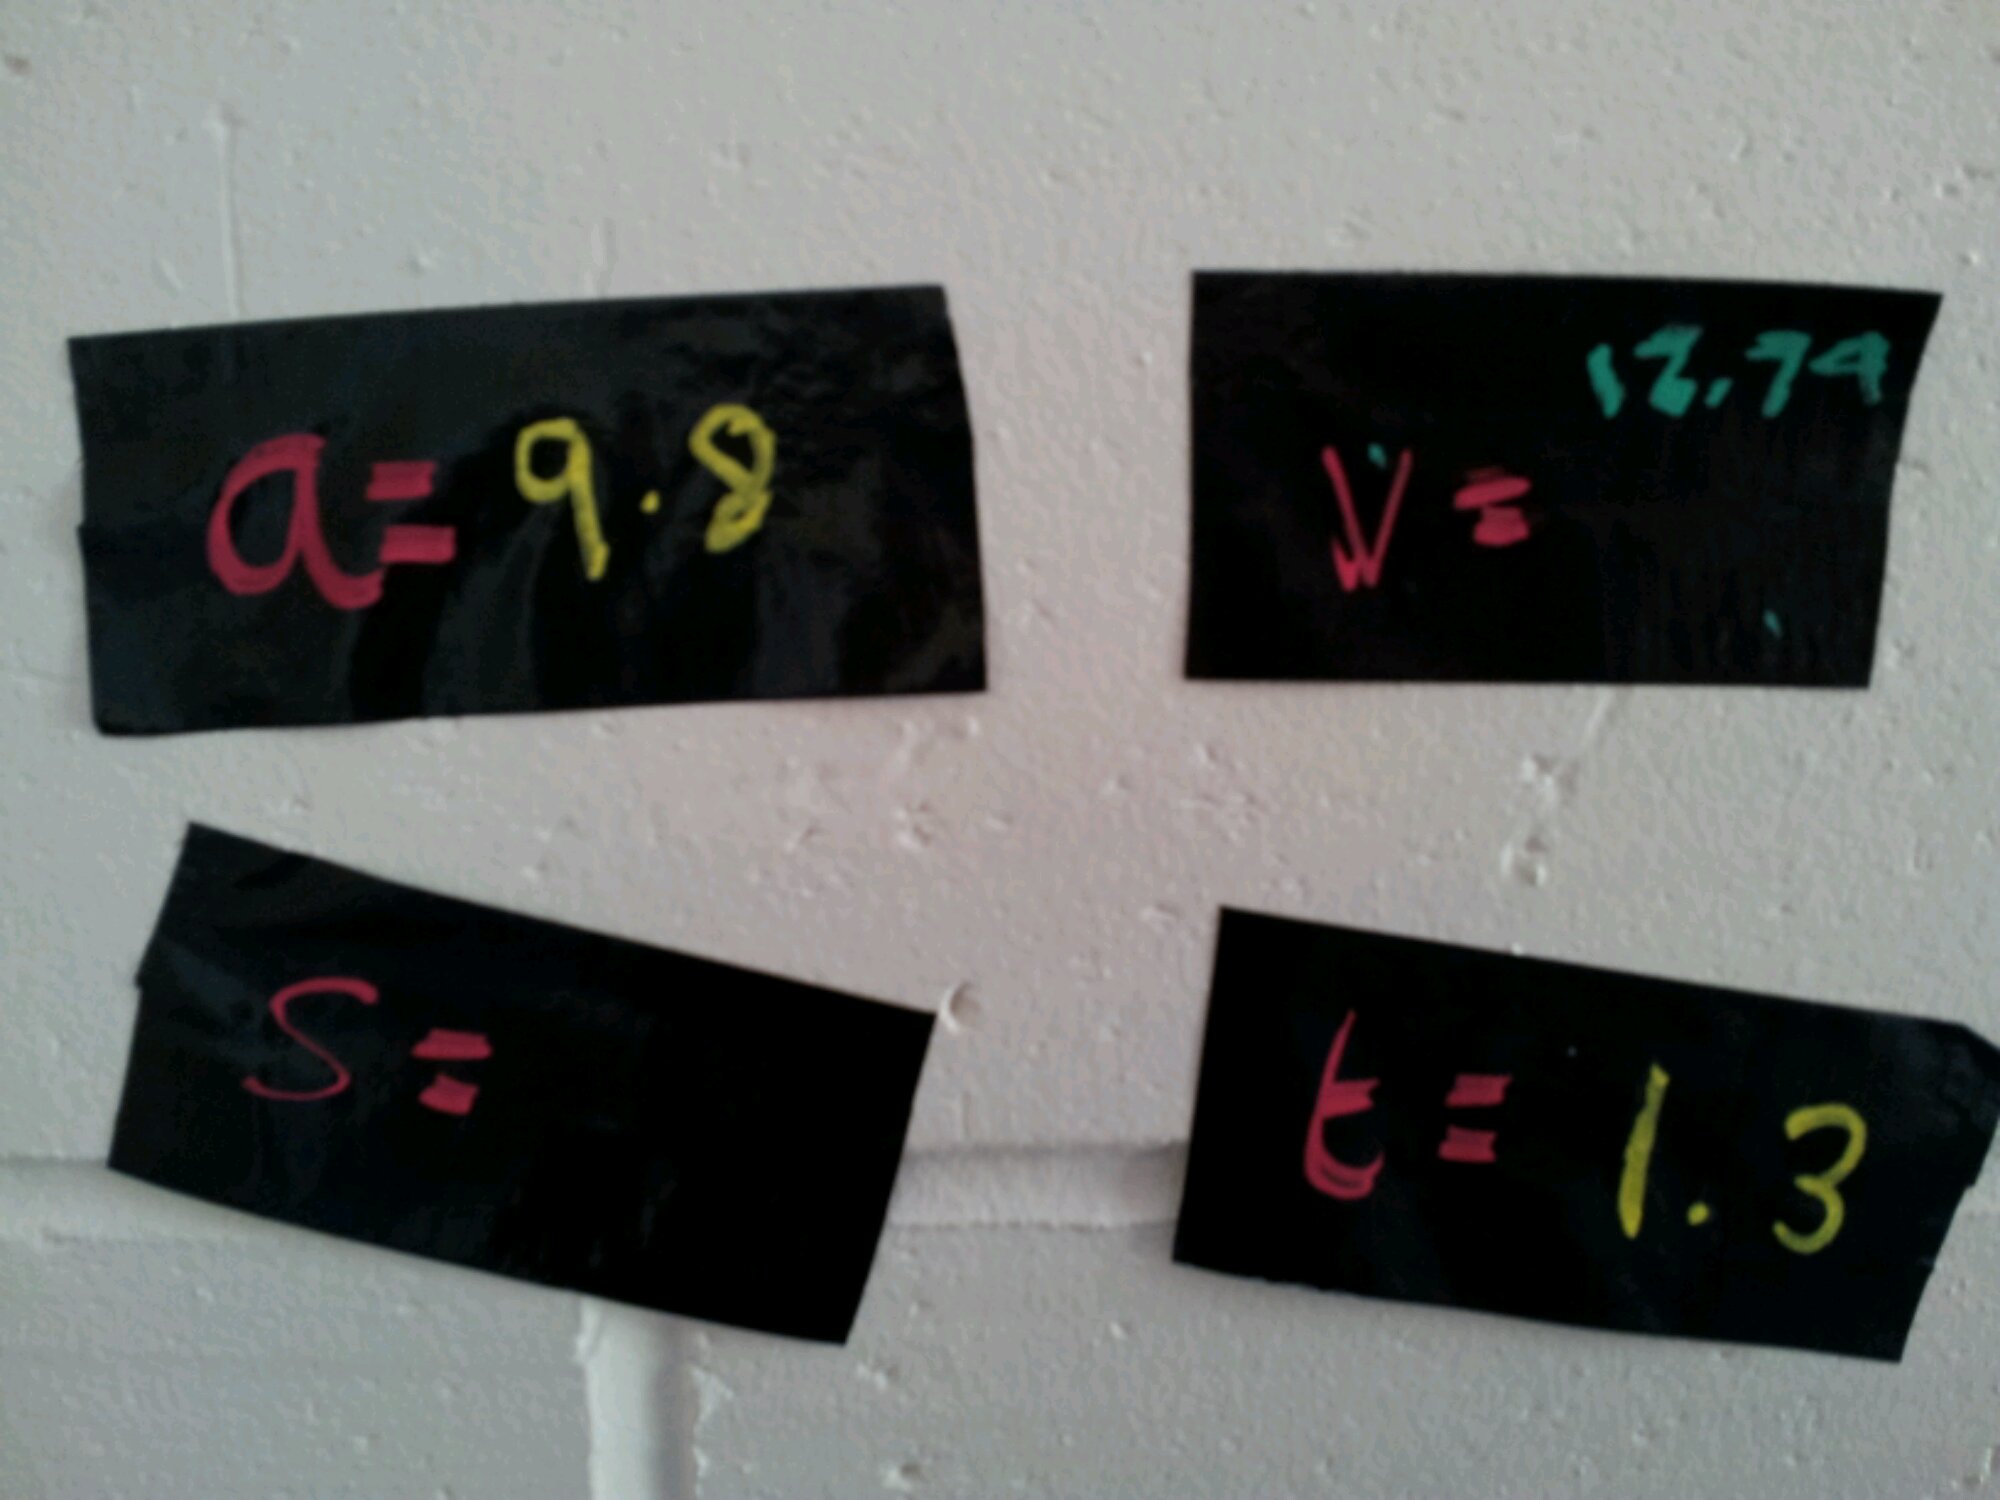
The students then labelled what they knew: a=g, u=0, v=?, t=?, s=?
image

The students used mobile phones to time the drop from the bannister to the floor and calculated the distance and final velocity. The physical activity allowed us to think about how to draw these kinds of diagram.

And finally …
Just some pictures of an alternative whiteboard:

image

image

187. Clever circles

Here is a quick, multi-function resource for you: a set of overlapping circles for angles, pie-charts and fractions/percentages.

Equipment
Card
Scissors
Pencil
Straight edge or ruler
Pair of compasses
A 360 degree protractor printed on paper (or a tracing paper protractor cut out)

Construction
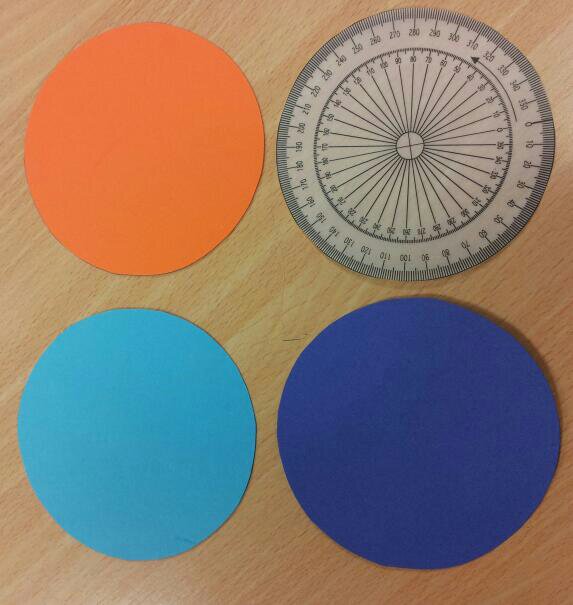
1. Cut out three identical circles and the paper protractor.

image

2. Stack them on top of each other and put the pointy end of the compasses (or a drawing pin) through the middle. Wiggle it around to make a bigger hole – please don’t stab yourself.

3. Draw a radius on the circles.

image

4. Cut down each radius on the circles and the 0 degree line on the protractor.
5. All done!

Activity 1: Angle Estimation
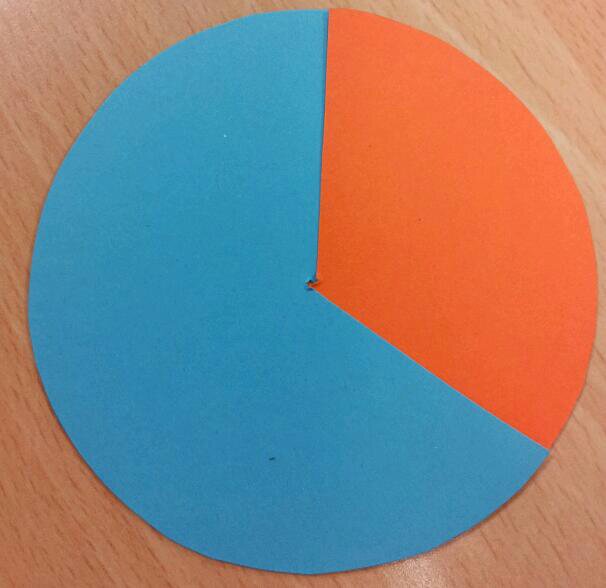
Slot two circles together:

image

Estimate the orange angle.
What could the blue angle be?
Show me an acute angle.
Show me a blue 170 degree angle.

Activity 2: Reading a protractor scale
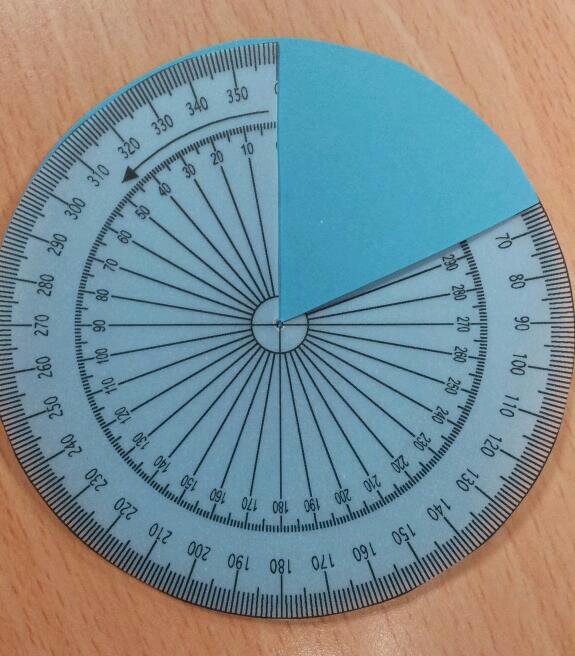
Slot the protractor into a circle:

image

How big is the blue angle?
Show me an 80 degree angle.

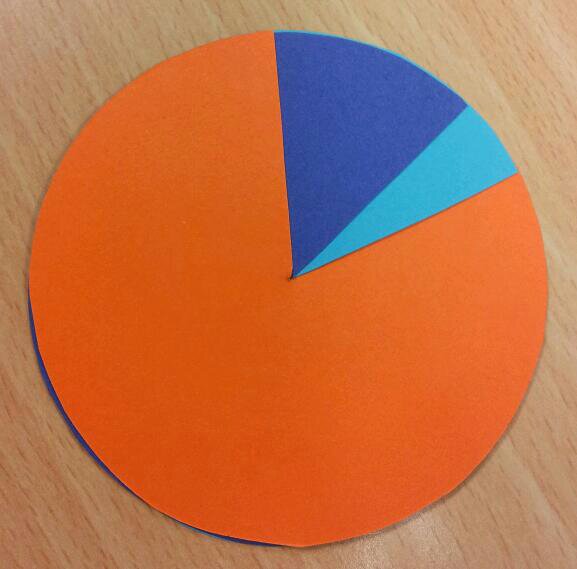
Activity 3: Pie-charts
Slot the three circles together:

image

What could this pie-chart represent?
Show me a pie chart with two equal sections

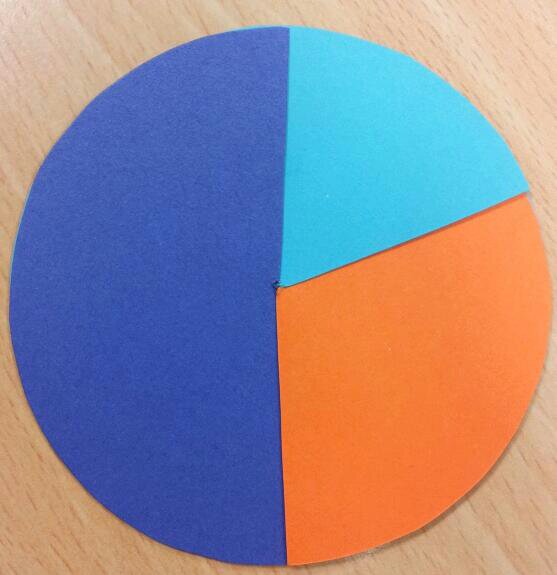
Activity 4: Fractions and percentages
Use three circles again:

image

Estimate what percentage is purple.
What fraction could the blue section represent?

182. How much flooring?

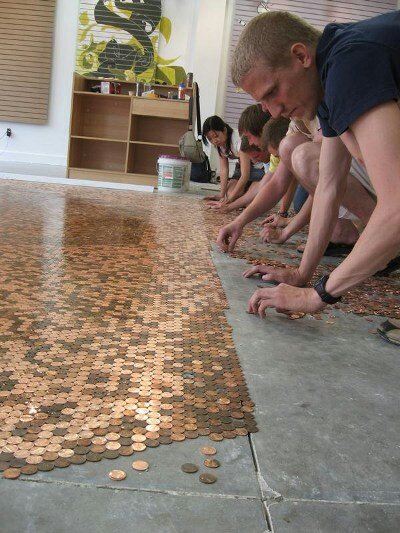
I’m sure you’ve done or heard of people using their classroom as a basis for problem solving. How much would it cost to paint/wallpaper/carpet the room?

What about the literal cost of flooring a room?

image

Image credit: Pinterest

Many people have calculated that it is cheaper to use 1 cent coins rather than buy tiles. There are many examples collected together here: Keytoflow

I think this idea could be adapted to look at different sizes of coin, areas and tessellation. Even simple circular coins can tessellate in different ways – how much does this affect the cost? This is also an open task which could lead to some great strategies and discussions.

Update
@LearningMaths suggests students could investigate the percentage area covered by different types of coin. A great extension idea!

176. Christmas Craft

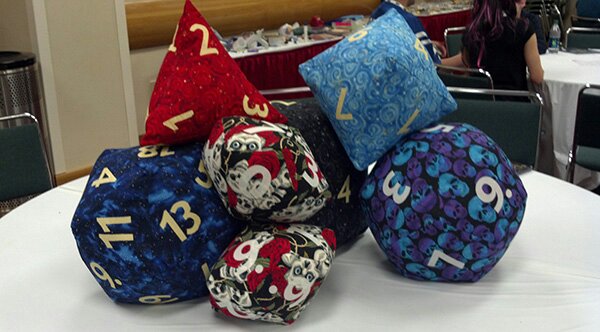
So, what to craft for that maths geek special someone … may we suggest polyhedral dice pillows?

image

These squashy beauties are from ¡The Anticraft!. There are full instructions and helpful diagrams on the website. These would also be a great classroom resource.

Warning: the folks at Anticraft are honest in their language, so don’t click if you prefer subtler prose.

178. Santa’s Secret

Santa’s secret is that he can get your class to revise harder topics – without them realising!

Equipment

Activity
Paper chains are made from equally sized strips of paper. Each loop is made from a strip of paper, which has one end glued to the other.

Question 1
How many 3cm by 18cm strips of paper can you cut from a sheet of A4 paper? Remember, each strip is made from one complete piece of paper.

Question 2
If each strip has an overlap of 1cm, what is the circumference of the loop made? What is the diameter?

Question 3
When two loops are attached there is an overlap of 0.5cm. How long would a chain of 12 loops be?
Hint: two loops with diameter 4cm would have a combined length of (4+4-0.5)cm = 7.5cm.

Question 4
A room has dimensions 5m by 7m. How far is it diagonally across the room?

Question 5
How many loops would a paper chain have if it reached diagonally across the room?

Extension
To make the chain hang in U shape, rather than stretching flat across the ceiling, 5 extra loops are added per whole metre of chain. How long would the chain diagonally across the room be? How many loops?

Challenge
How many sheets of paper would be required to make enough paper chain to hang in a U shape joining every corner of the room?

160. TMNW 2 – Learning Wall 1

Earlier this term, my colleague, J, and myself attended the rather brilliant #TMNorthWest at Calderstones School. We were particularly inspired by the idea of independent or ‘Help yourself’ learning walls. We’ve chosen this as our Departmental focus for the year and once we have trialled it, we hope to install a learning wall in every maths room.

The basic premise is that ideas and key points are collected in themed pockets, which students can go to whenever they require assistance or a hint on how to progress. The cards are numbered and indexed. The idea was introduced by Claire Gillies in the context of English lessons.

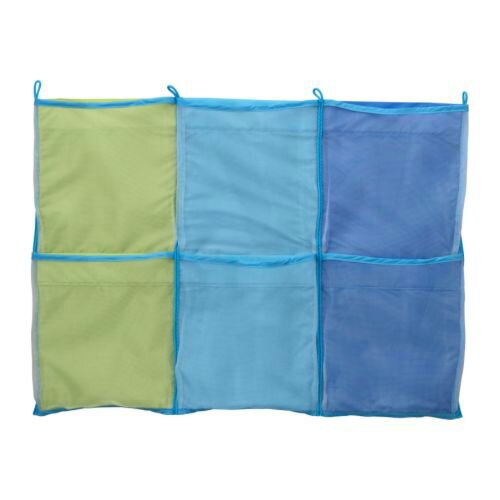
The self help cards were stored in hanging wallpockets:

image

Claire used the Kusiner wallpockets from Ikea.

There are six pockets in this particular product. We have chosen to split them into the following categories:
*Number
*Algebra
*Data
*Shape
*Using equipment
*Index

We designed our cards to have methods, misconceptions, Levels/Grades, a question with worked answer and possibly QR codes to useful videos.

Now, sitting and designing a self help card layout is easy. Completing them is a much bigger task! We have decided to start with KS3 and have selected key objectives from the Y7 scheme of work.

We also have GCSE classes who sat their exams last week and, quite frankly, need a break.

This sounds like fate …

The plan is that Year 11 students will take Y7 objectives and write self-help cards. Teachers will moderate/edit what they write.

Well, that’s our plan for a bit of independent student power. I’ll continue to post about our walls as they develop.