358. A spatter of trig

The fabulous Mrs D (@mrsdenyer ) shared this forensics video, by crime scene analyst Matthew Steiner, on Twitter. At eight minutes in the presenter looks at blood spatter analysis. The use of basic trigonometry in a practical situation is a gift of a video for a starter in lesson.


My class were absolutely silent throughout and wanted to watch the whole video, however they may have just been trying to avoid work. I shared the video link with them via our digital classroom platform. We are now using blood spatter for 3D trigonometry examples rather then mobile phone masts. Gory, but effective!

357. It’s not square!

I do love a little challenge for A-level Further Maths students. They are often confident and very capable mathematicians, but occasionally overlook the small details. This challenge looks into which strategies students use when working with 3D vectors, lines and angles.

The most annoying thing? There is no single correct answer.

What is the investigation?

Students start with two points, create a line, construct two perpendicular lines and then join up the lines – did they create a square? How do you know? Justify it?

Download the instructions here: It’s not square (docx), It’s not square (PDF)

Skills required

  • Distance between two points
  • Equation of a line in three dimensions
  • Scalar (dot) product

Solution/Discussion point

  • Students need to use the same direction vector for both perpendicular lines too create a square
  • The two new corners need to be n the same direction away from the original line (not one above and one below)
  • It’s interesting to discuss what non-squares they made. Technology could be used to plot them in 3D.

356. Edexcel Shadow Paper

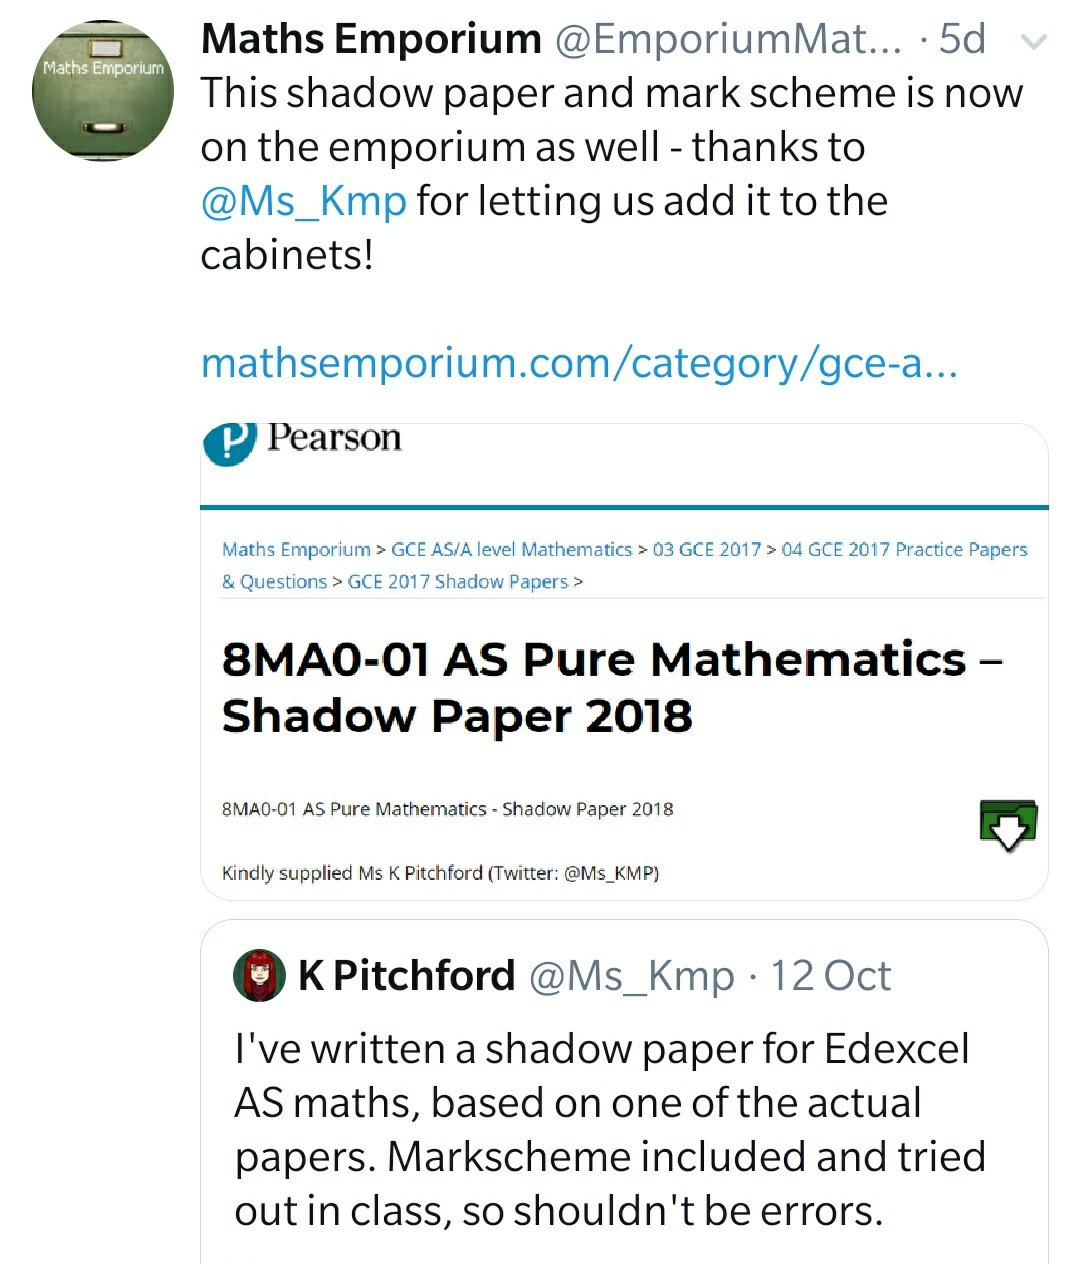
Wow, it’s been a while since my last post. Apologies for that. I’ve been busy with Key Stage 5 things. One of my projects has been creating a shadow paper for the Edexcel AS Maths exam. With so few past papers available and so many papers available online, I wanted an assessment that my students couldn’t find the mark scheme for.

I’ve taken the AS Pure 2018 paper and created a shadow paper, with markscheme. Same level of difficulty, different numbers. I publicised it on Twitter and shared it with over ninety educators in 48 hours. I was stunned by the popularity of this resource. To keep it secure, the lovely Graham Cummings from @mathsemporium has arranged for it to be uploaded onto the Edexcel Maths Emporium. Now I don’t have to directly email people the files.

You can access it with an Edexcel teacher login here. If you don’t have a login, there are instructions on the page on how to obtain one.

I hope this paper saves you some time. I intend to start work on more Pure shadow papers soon, as Pure maths carries the heavier weighting in the AS and A-level exams.

355. Toyota logic

My fabulous colleague, Mr G, has recently been to the local Toyota factory to find out about the Lean model.

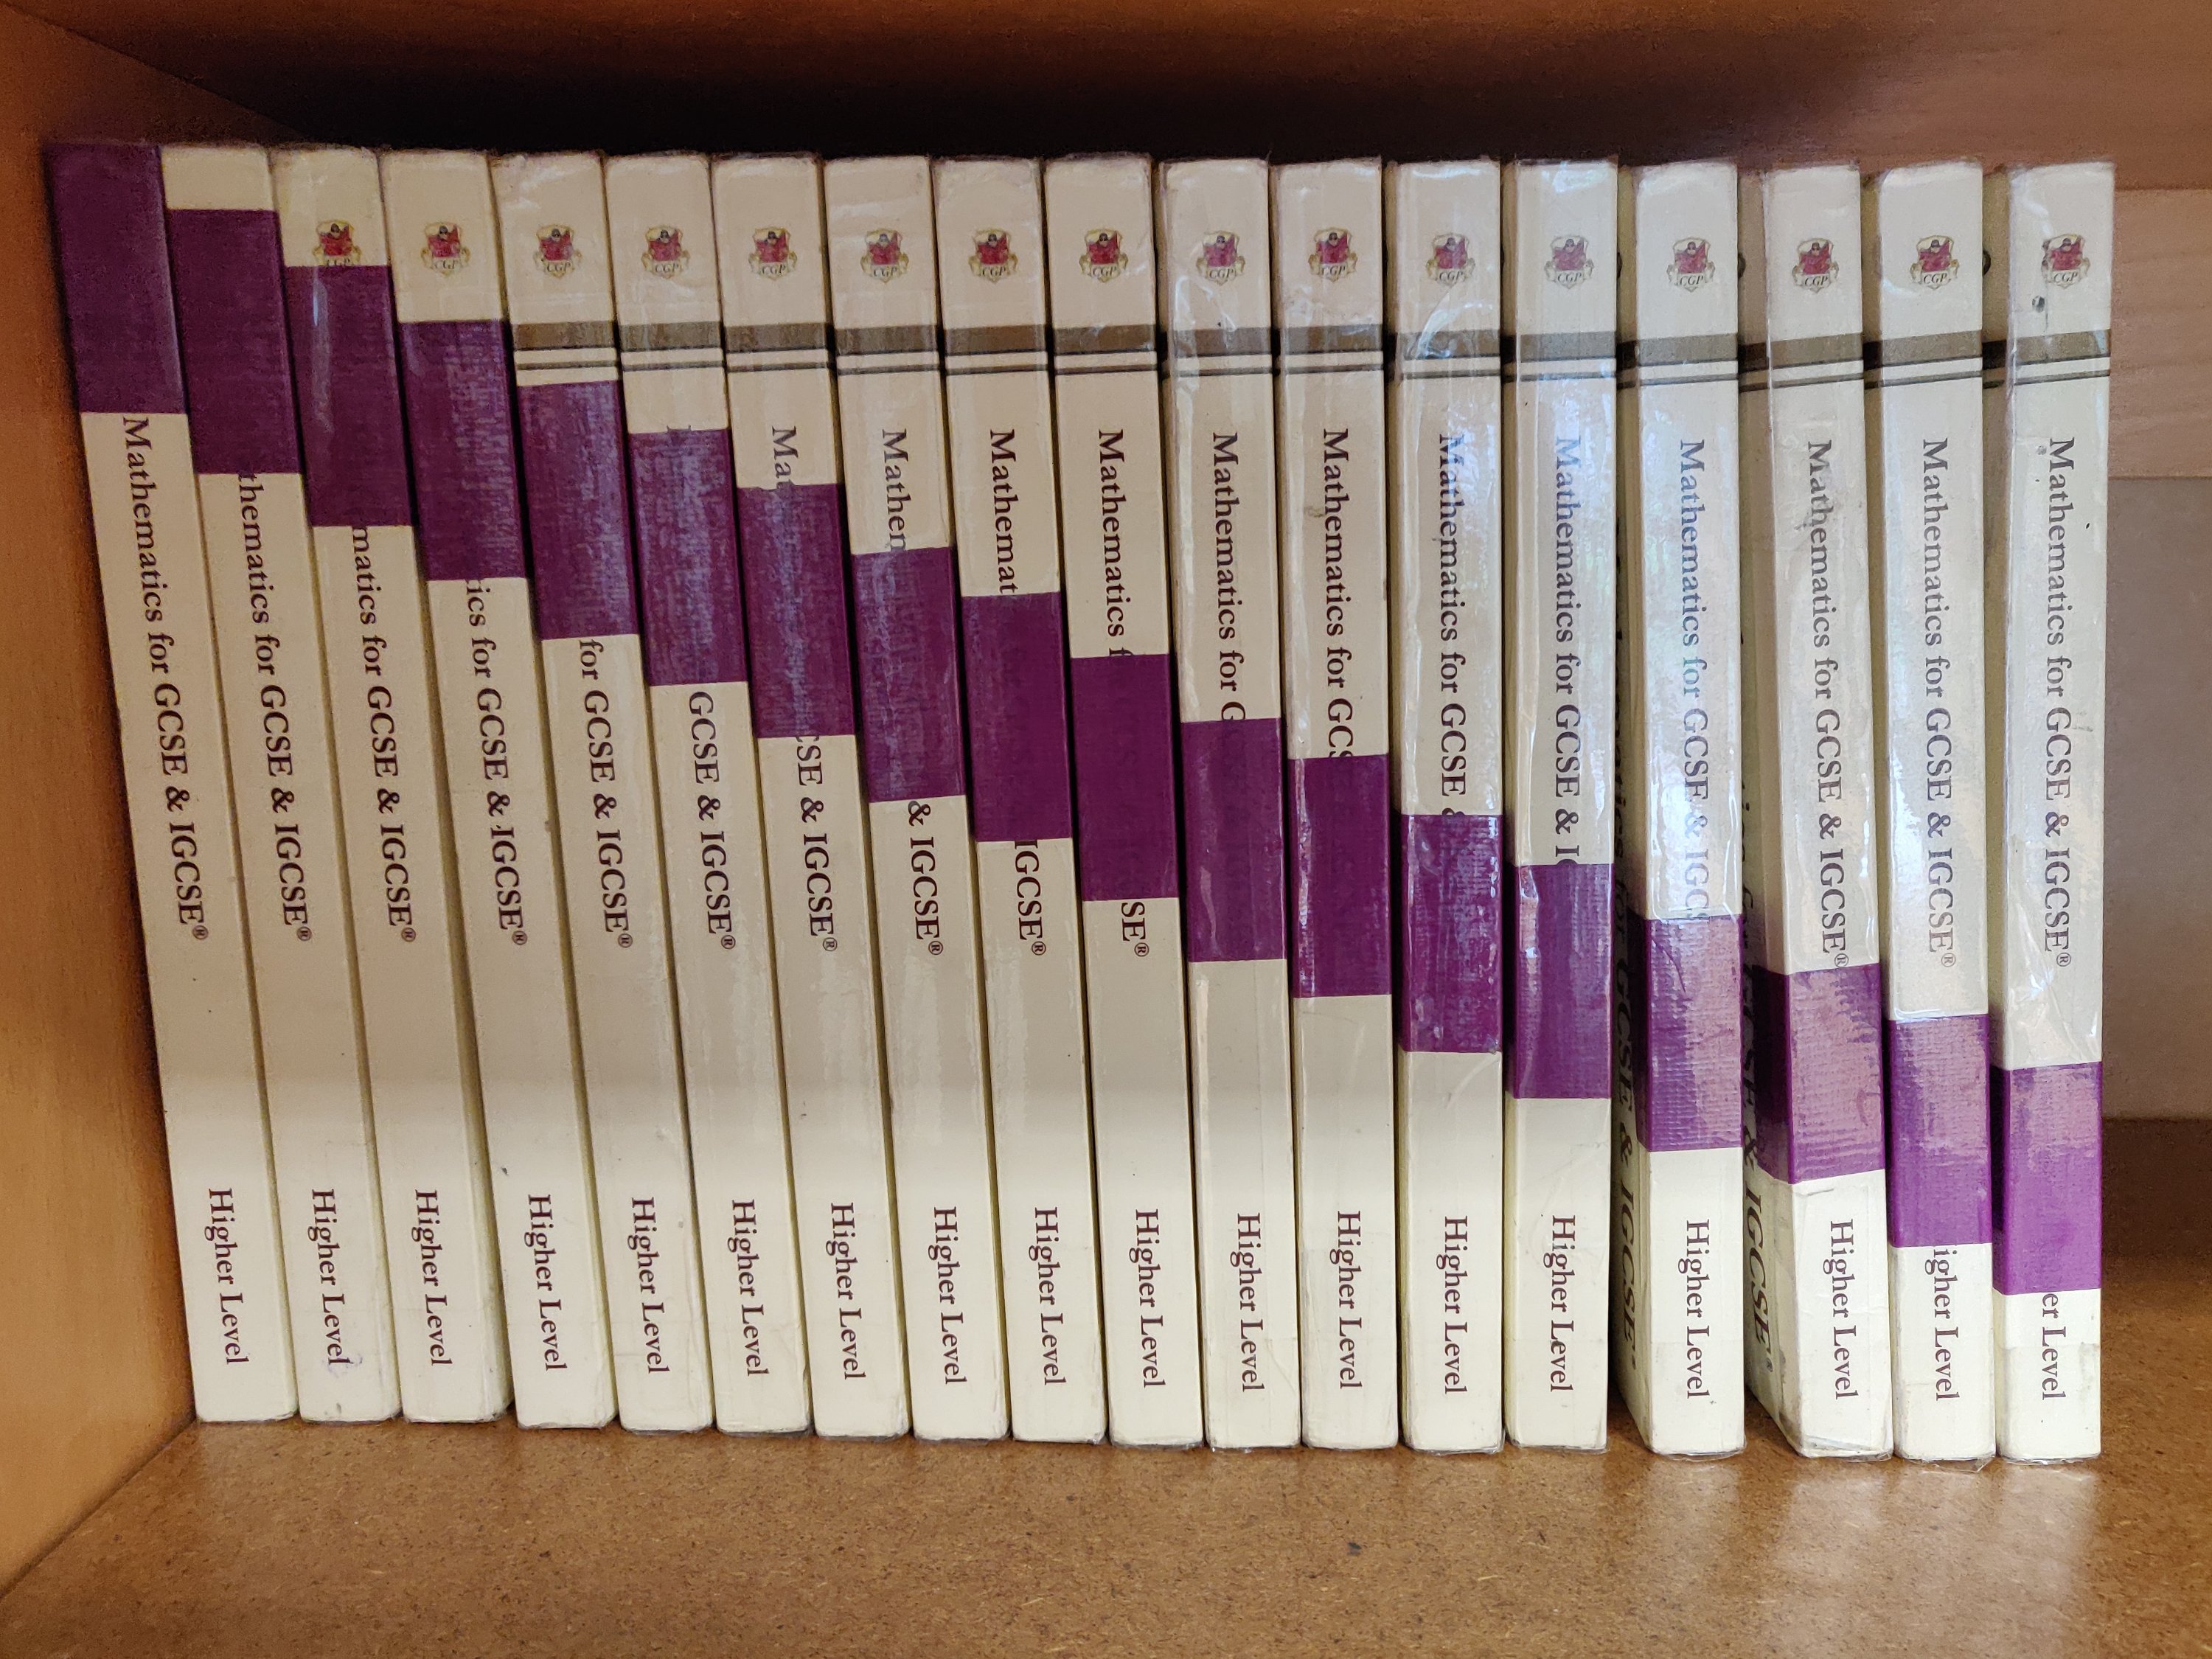
The key principles involve efficiency of process. He told me about a school using the Lean model that had tape diagonally along the spines. Students put their folders back in order and the teacher can instantly see if a file is missing. Genius!

Now I happened to be about to cover my textbooks with sticky back plastic. I put duct tape around the spine before covering them. Each book has tape 1cm lower than the previous.

Now you are thinking – that looks nice, but it will never work.

I’ve got news for you – every time I use the textbooks with my class of 34 Year 9 students, they put the books back in order. On the first day I made a big deal of how tidy the books looked and challenged them to put them back tidy. And they did – every lesson!

354. Iced gems

Just a quick idea today. You know the feeling when the multi-pack of sugar paper has dwindled down to just the brown. Great if you want to do trees, bleurgh if you want to do anything else.

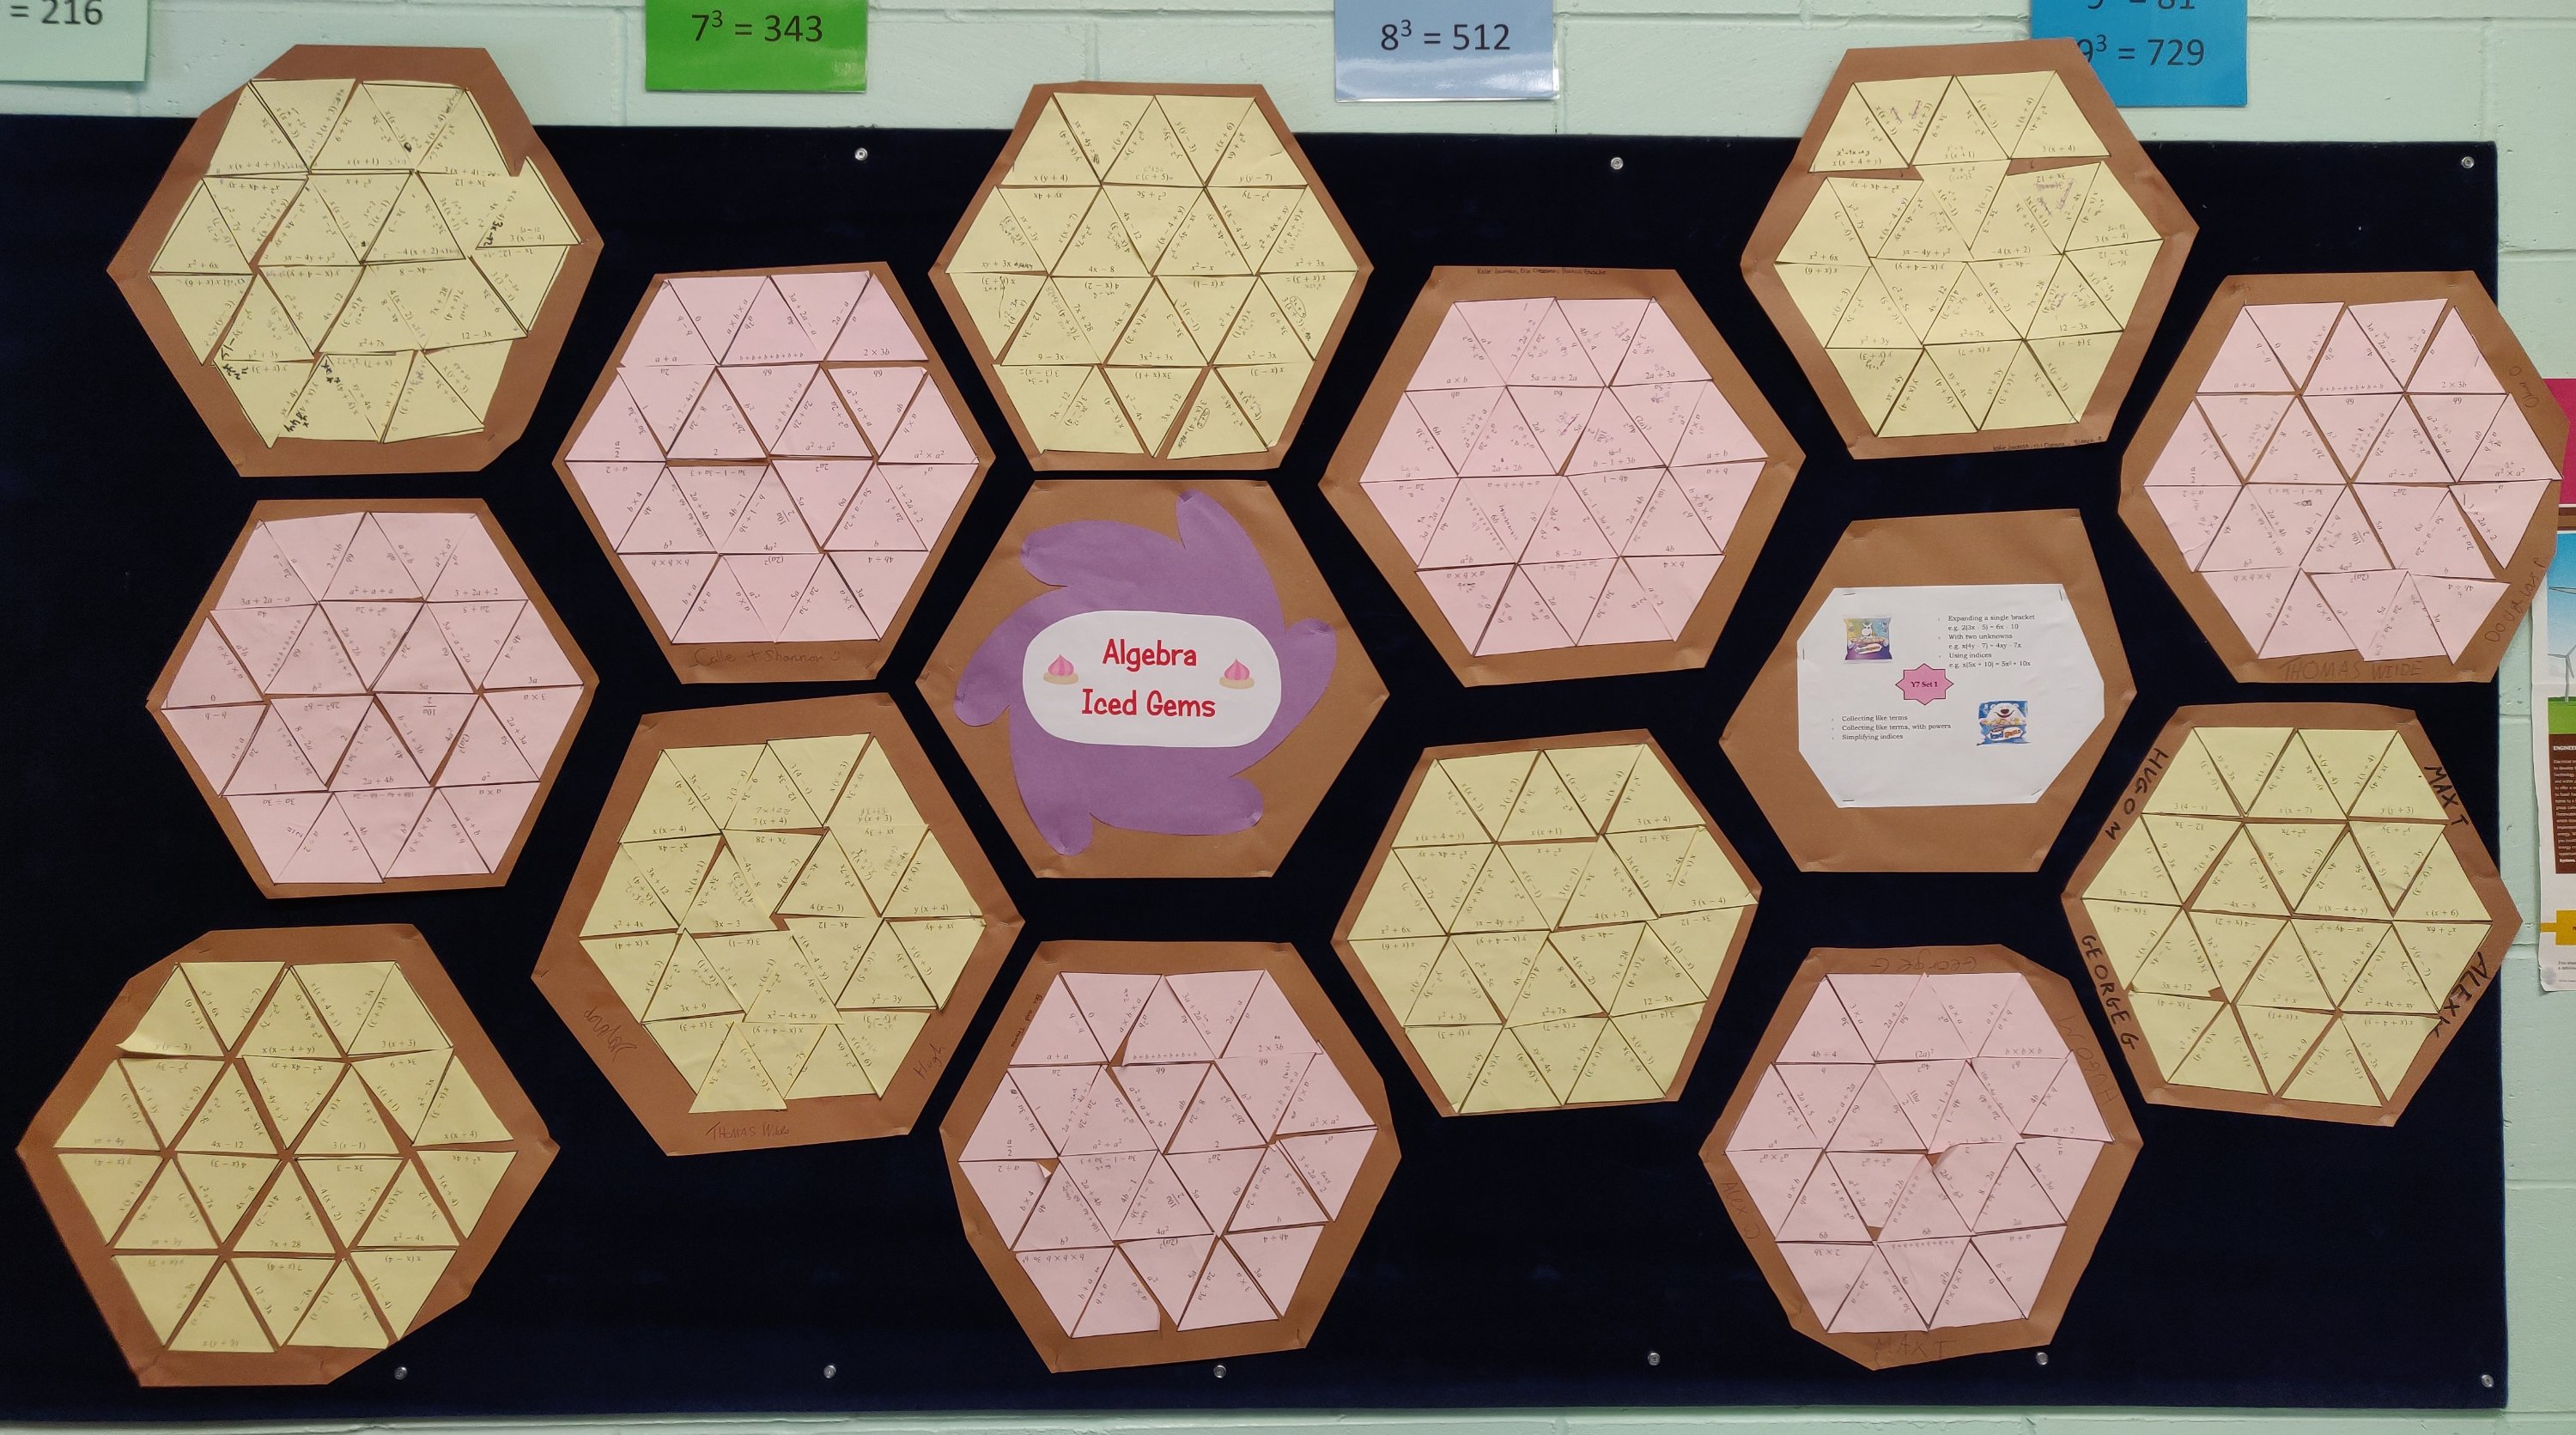
I did a tarsia recap with Year 7. There were three different tasks going on and so I photocopied them onto three different colours of paper. The only colour of sugar paper was brown. We went with it. As the class finished their work, we discovered that their work looked like iced biscuits or iced gems. Hence our wall of Algebra Iced Gems:

Some of the cutting and sticking is a bit wobbly, but the class really enjoyed this task and we consolidated a considerable number of skills.

353. Large Data Display

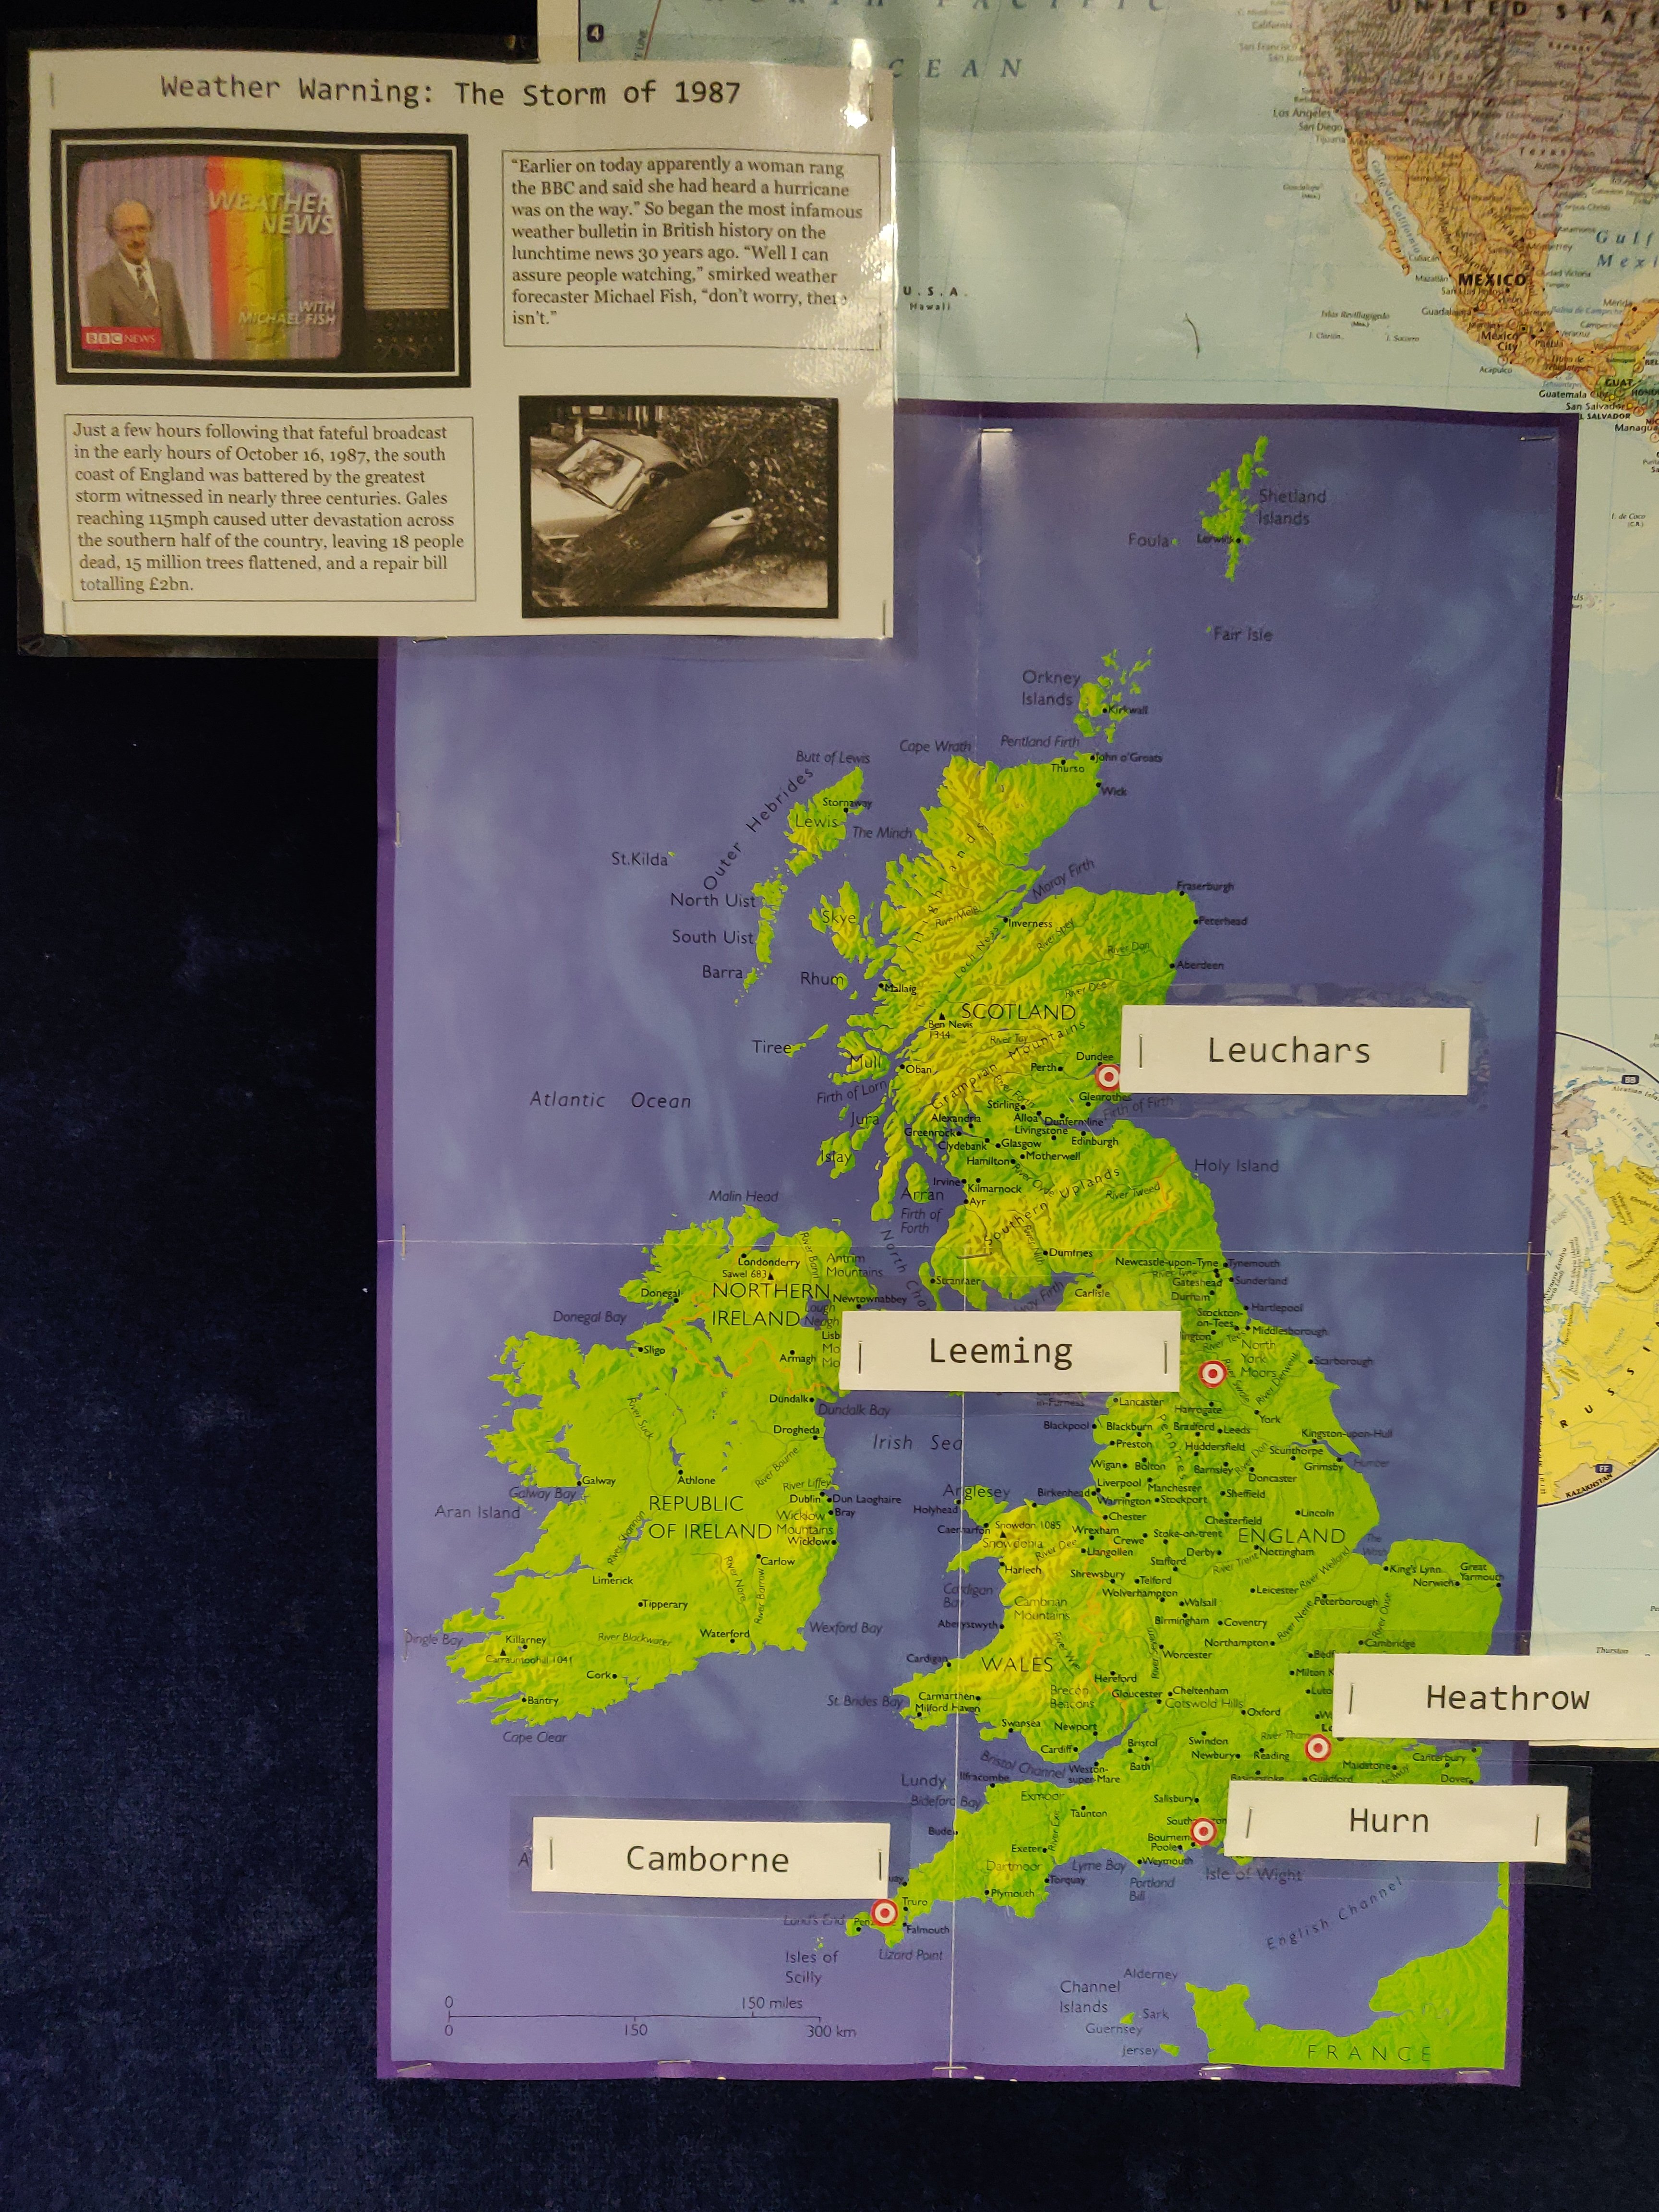
If you teach A-level Maths in the UK, you will know about the prerequisite to know about the large data set for the statistics component. We use Edexcel and so need to know about eight weather locations.

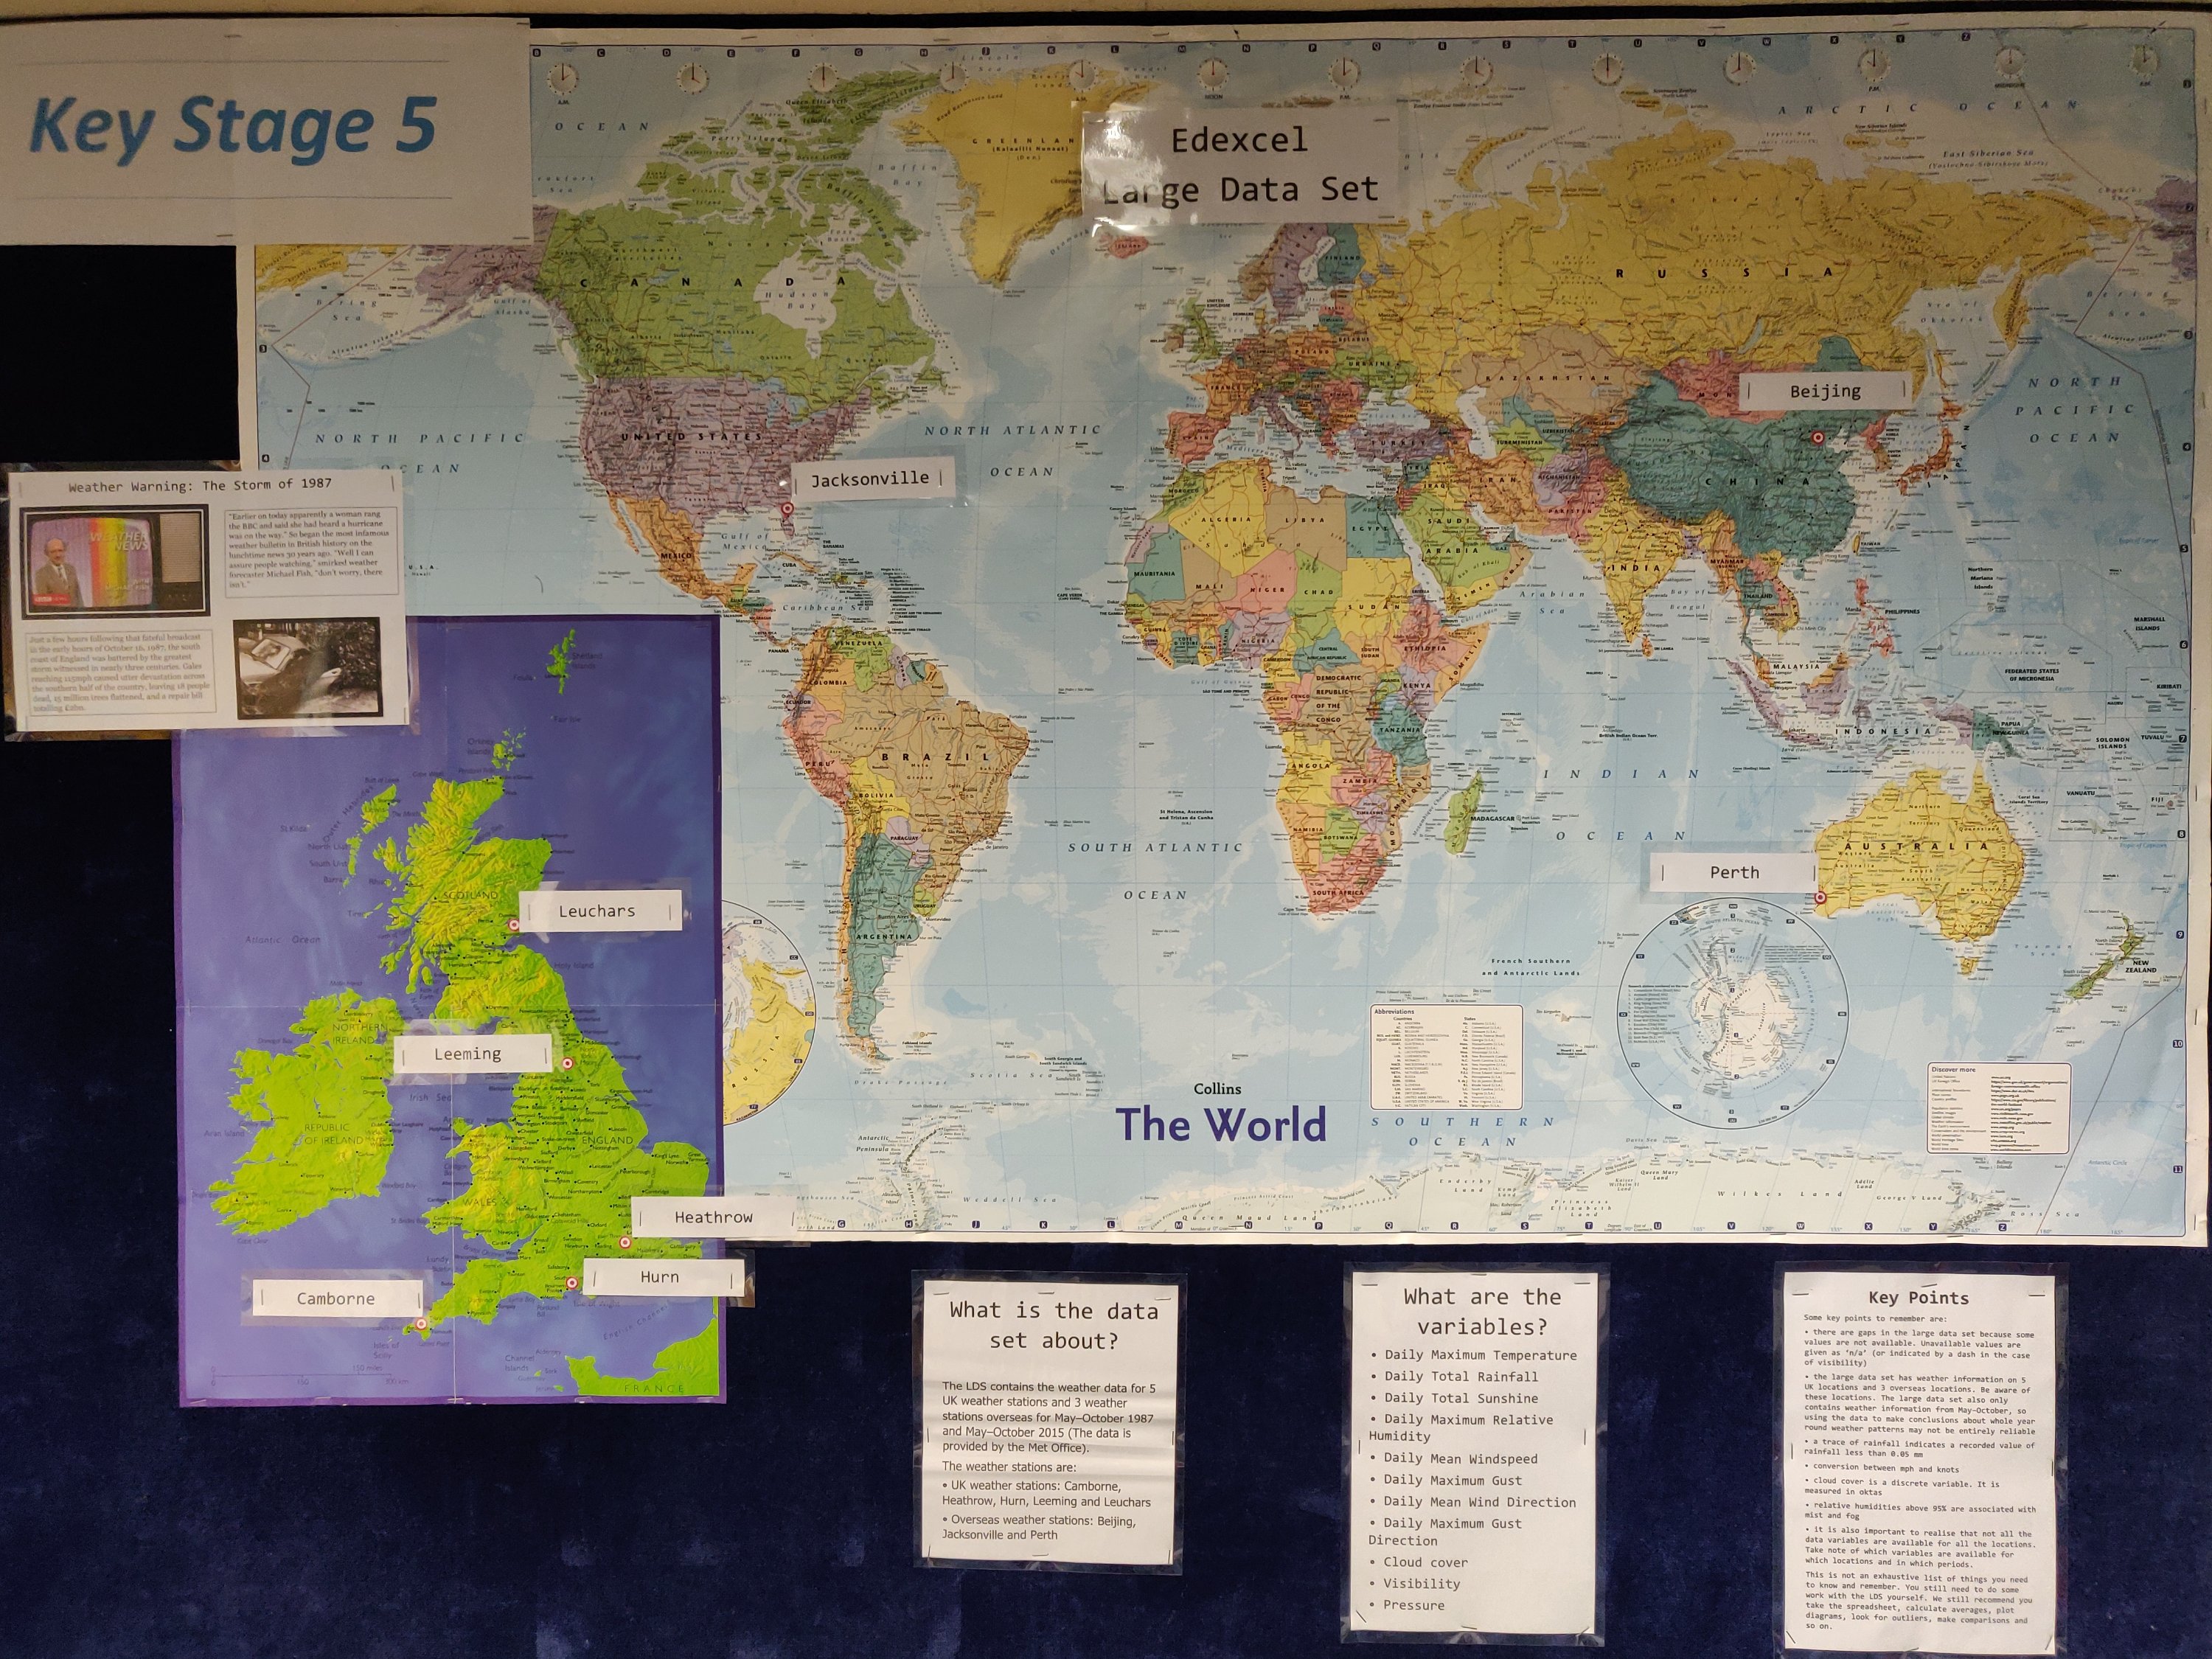
Here is my Key Stage 5 corridor wall display.

I’ve got two maps – one of the World ( a freebie from the Humanities Dept) and one of the UK (£2.95 from Amazon).

I’ve included summary information from the CrashMaths booklet.

Of course, you can’t talk about UK weather data from the storm of 1987 – Michael Fish makes a special appearance.

352. Functions refresher

We recently finished teaching the AS Maths syllabus to Year 12. My colleague and I decided how to split up the start of the second year of the course. I’m starting with the modulus function.

I took one look at the skills needed at thought “Uh-oh”. The students are going to be out of practice with this. They are a lovely group, with a wide range of ability, but we’ve been very focussed on Applied Maths recently.

Option A: Go for it and patch up the vocabulary as we go (getting very frustrated – they knew this last October)

Option B: Break them in gently, recap the skills and vocabulary and extend them further

Option C: Reteach the work from last October.

Yes, you guessed it. I went with Option C. I found a brilliant task on piecewise function graphs on the Underground Maths website.
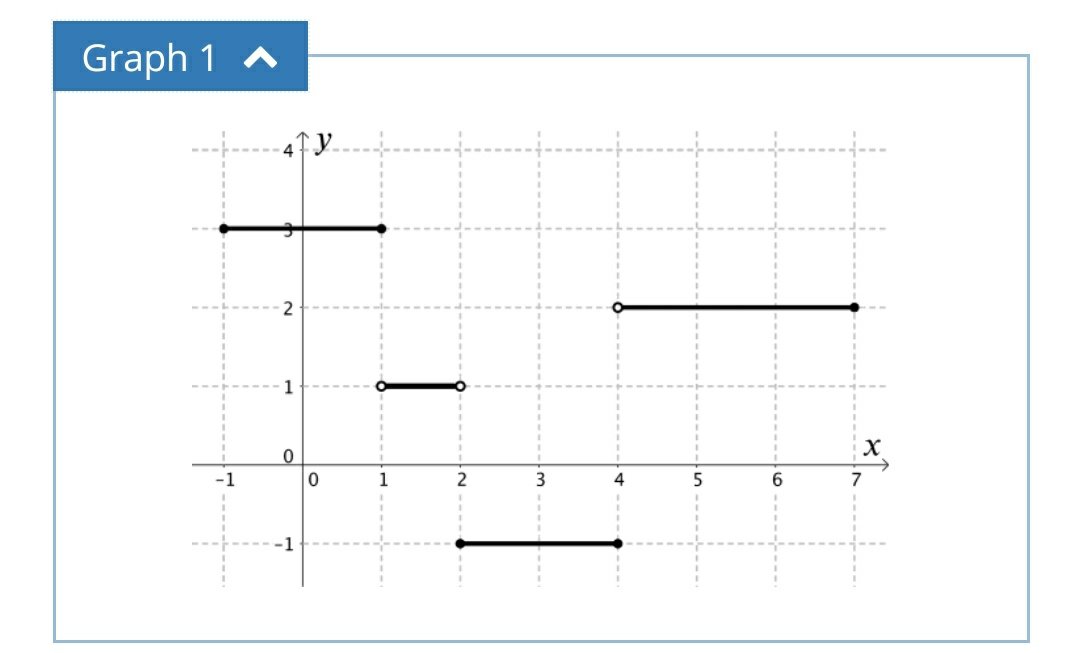
Image credit: https://undergroundmathematics.org/

There are four graphs given. The basic task is to interpret the functions relating to each graph, through description or function.

I photocopied the graphs onto card and sliced them up. Each group had a set of cards. One person described a graph and the others had to accurately draw it. Some students went straight onto squared paper, others drafted it out on mini whiteboards. They repeated this until all the graphs were drawn and everyone had had a go at describing (the describer stuck in their card, so that they had a complete set). Whilst they were doing this, I moved around and encouraged the use of mathematical vocabulary.

Note: it was interesting to see how many students had forgotten the significance of open and shaded circles to denote boundaries of inequalities.

The second task was to match up the function cards with the graphs. Once again, accuracy was key as not all graphs had functions and not all functions had graphs. There were also some that nearly, but not quite matched. This activity really brought out the key skills relating to domain, range and function notation that I was looking for. The extension task was to complete the missing pairs.

But, did it work? I can confirm that the following lesson the class made very good progress investing the modulus function and it’s graph, even going as far to solve equations. They knew what the notation meant, how to plot it and how to interpret the graphs.

I really like the Underground Maths website as it has great resources, good support material and always makes students think. Most of the time it gets teachers thinking too!