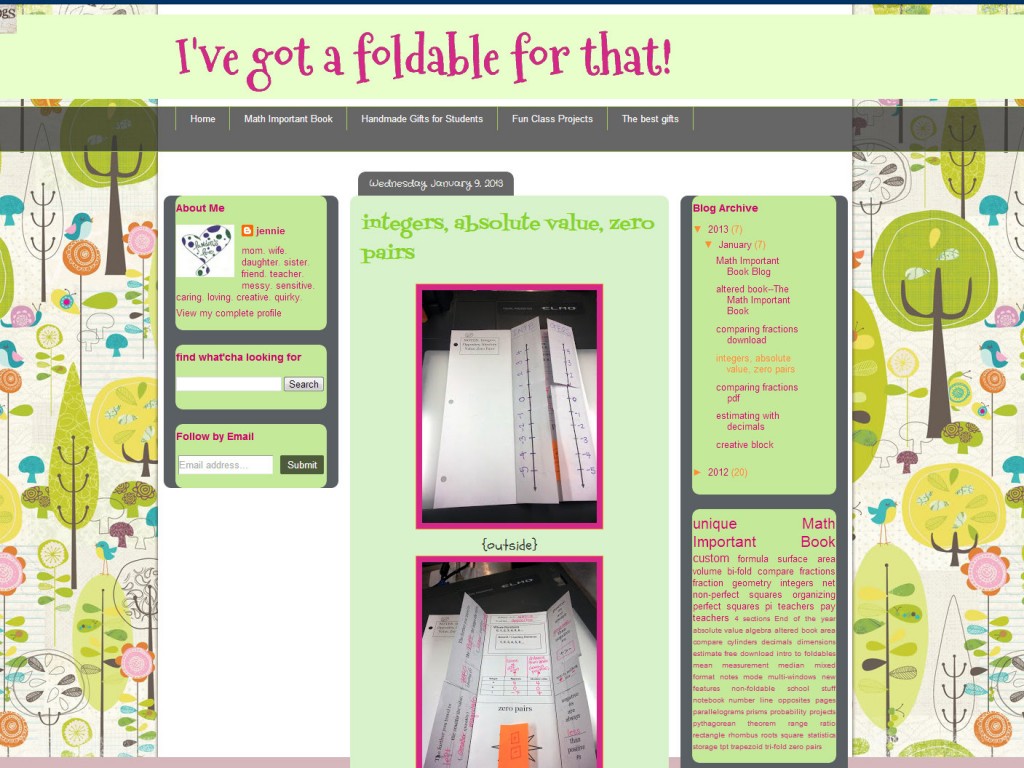
BH sent me a brilliant link to this addictive website:
Visualising Primes
It could be used to discuss factors, multiples and primes. Or even just let it run in the background on a projector.

BH sent me a brilliant link to this addictive website:
Visualising Primes
It could be used to discuss factors, multiples and primes. Or even just let it run in the background on a projector.
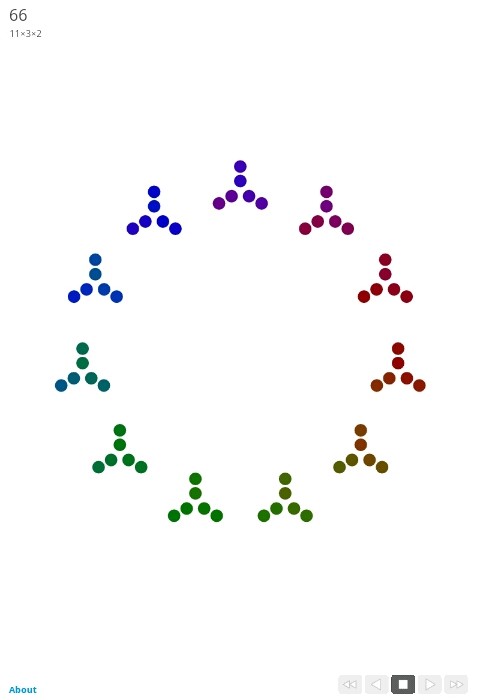
This is a great BBC documentary hosted by Terry Jones (Monty Python) about the history of the western number system:
The Story of One
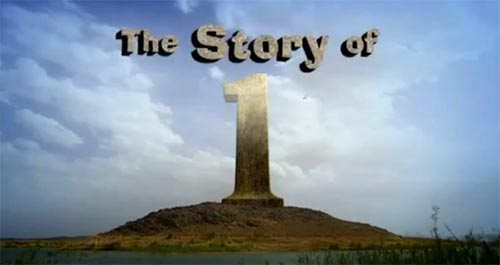
I love the variety of paper available to download for free from this website: PrintablePaper
At a family party, Nanna is sitting quietly with a piece of paper and pencil. She is making a note of who is there. Later that week Nanna sets a challenge to her friends over coffee:
“I was at a party last week. There were 17 people there. There were:
8 cousins
10 sisters
1 brother
4 mothers
5 fathers
1 grandmother
2 grandfathers
1 great grandfather
3 aunts
3 uncles
8 great grandchildren
11 grandchildren
3 mothers have 2 sisters
3 sisters have 1 brother
4 sisters have 1 sister
Who was at the party?”
Draw a family tree to represent the answer.
Hint: There are 4 generations
Solution
Generation 1: Great Grandad
Generation 2: Granddad & Nanna
Generation 3: Three sisters and their husbands
Generation 4: Two of the sisters have families with two daughters, one sister has a family with three daughters and one son.
This is my favourite activity for introducing different measures of average. You can do this in a corridor or outside, no special equipment required.
Set Up
Line up the class in height order
Range
Ask the shortest and tallest students to stand back to back. The difference in height is the range.
Median
Tell the first and last student to make a half turn. Ask the second and second to last student to make a half turn. Repeat until only one or two students are facing forward.
One pupil = median height.
Two pupils = halfway between their heights is the median.
Mean
Imagine everyone is the same height. Tell the students to try to be the same height by bending knees or standing on tiptoes. Explain the mean is about sharing out equally.
Mode
Ask students to put themselves into groups of the same height. The biggest group is the mode.
This activity links a numerical calculation with a physical activity, which makes it more memorable.
The main problem students have with drawing pie charts is working out the angles. Barcharts are easy, but as soon as protractors are involved the shutters go down.
How about using the whole class to turn a barchart into a pie chart using nothing more than a playground and a piece of chalk?
1. Pick a topic eg How did you get to school today?
2. Get pupils to move into the correct groups eg Automobile (car), Bus, Walk, Cycle
3. Create a human barchart eg
AAAAAA
BBBB
WW
CCC
4. Move the bars in order into a line
AAAAAABBBBWWCC
5. Move the bars into a circle
(You’ve just turned a barchart into a circle)
6. Mark the centre of the circle, mark in the lines between each section (4 sectors)
7. Ask how many degrees one person represents.
8. Ask how many degrees each sector is worth.
Note: If you have a low ability group or no calculators you may wish to edit the number involved to be a factor of 360. Extra pupils can be keeping notes on a mini whiteboard.
9. To consolidate this you can repeat this with a different question.
10. To extend this task you can split up the class into two groups and ask a different question. They must create two pie charts and compare the data.
This activity is a great task as it makes for a memorable lesson and good discussion point. If you take pictures for a wall display it can make a nice revision prompt.