Tag Archives: practical

189. Revision just flies by

I take absolutely no credit for this cute revision idea – japanese peace cranes for revision.

My class have a test next week and I gave them half an hour of directed independent study. Using their revision lists they could use their notes or textbooks to try questions or create a revision resource. I was expecting posters, maybe booklets … then one of the girls asked if could they make a crane for revision and hang off revision notes. Bearing in mind we have a 2m algebra tree in the room, I thought an industrial crane with notes hanging off it could be good.

How wrong I was!

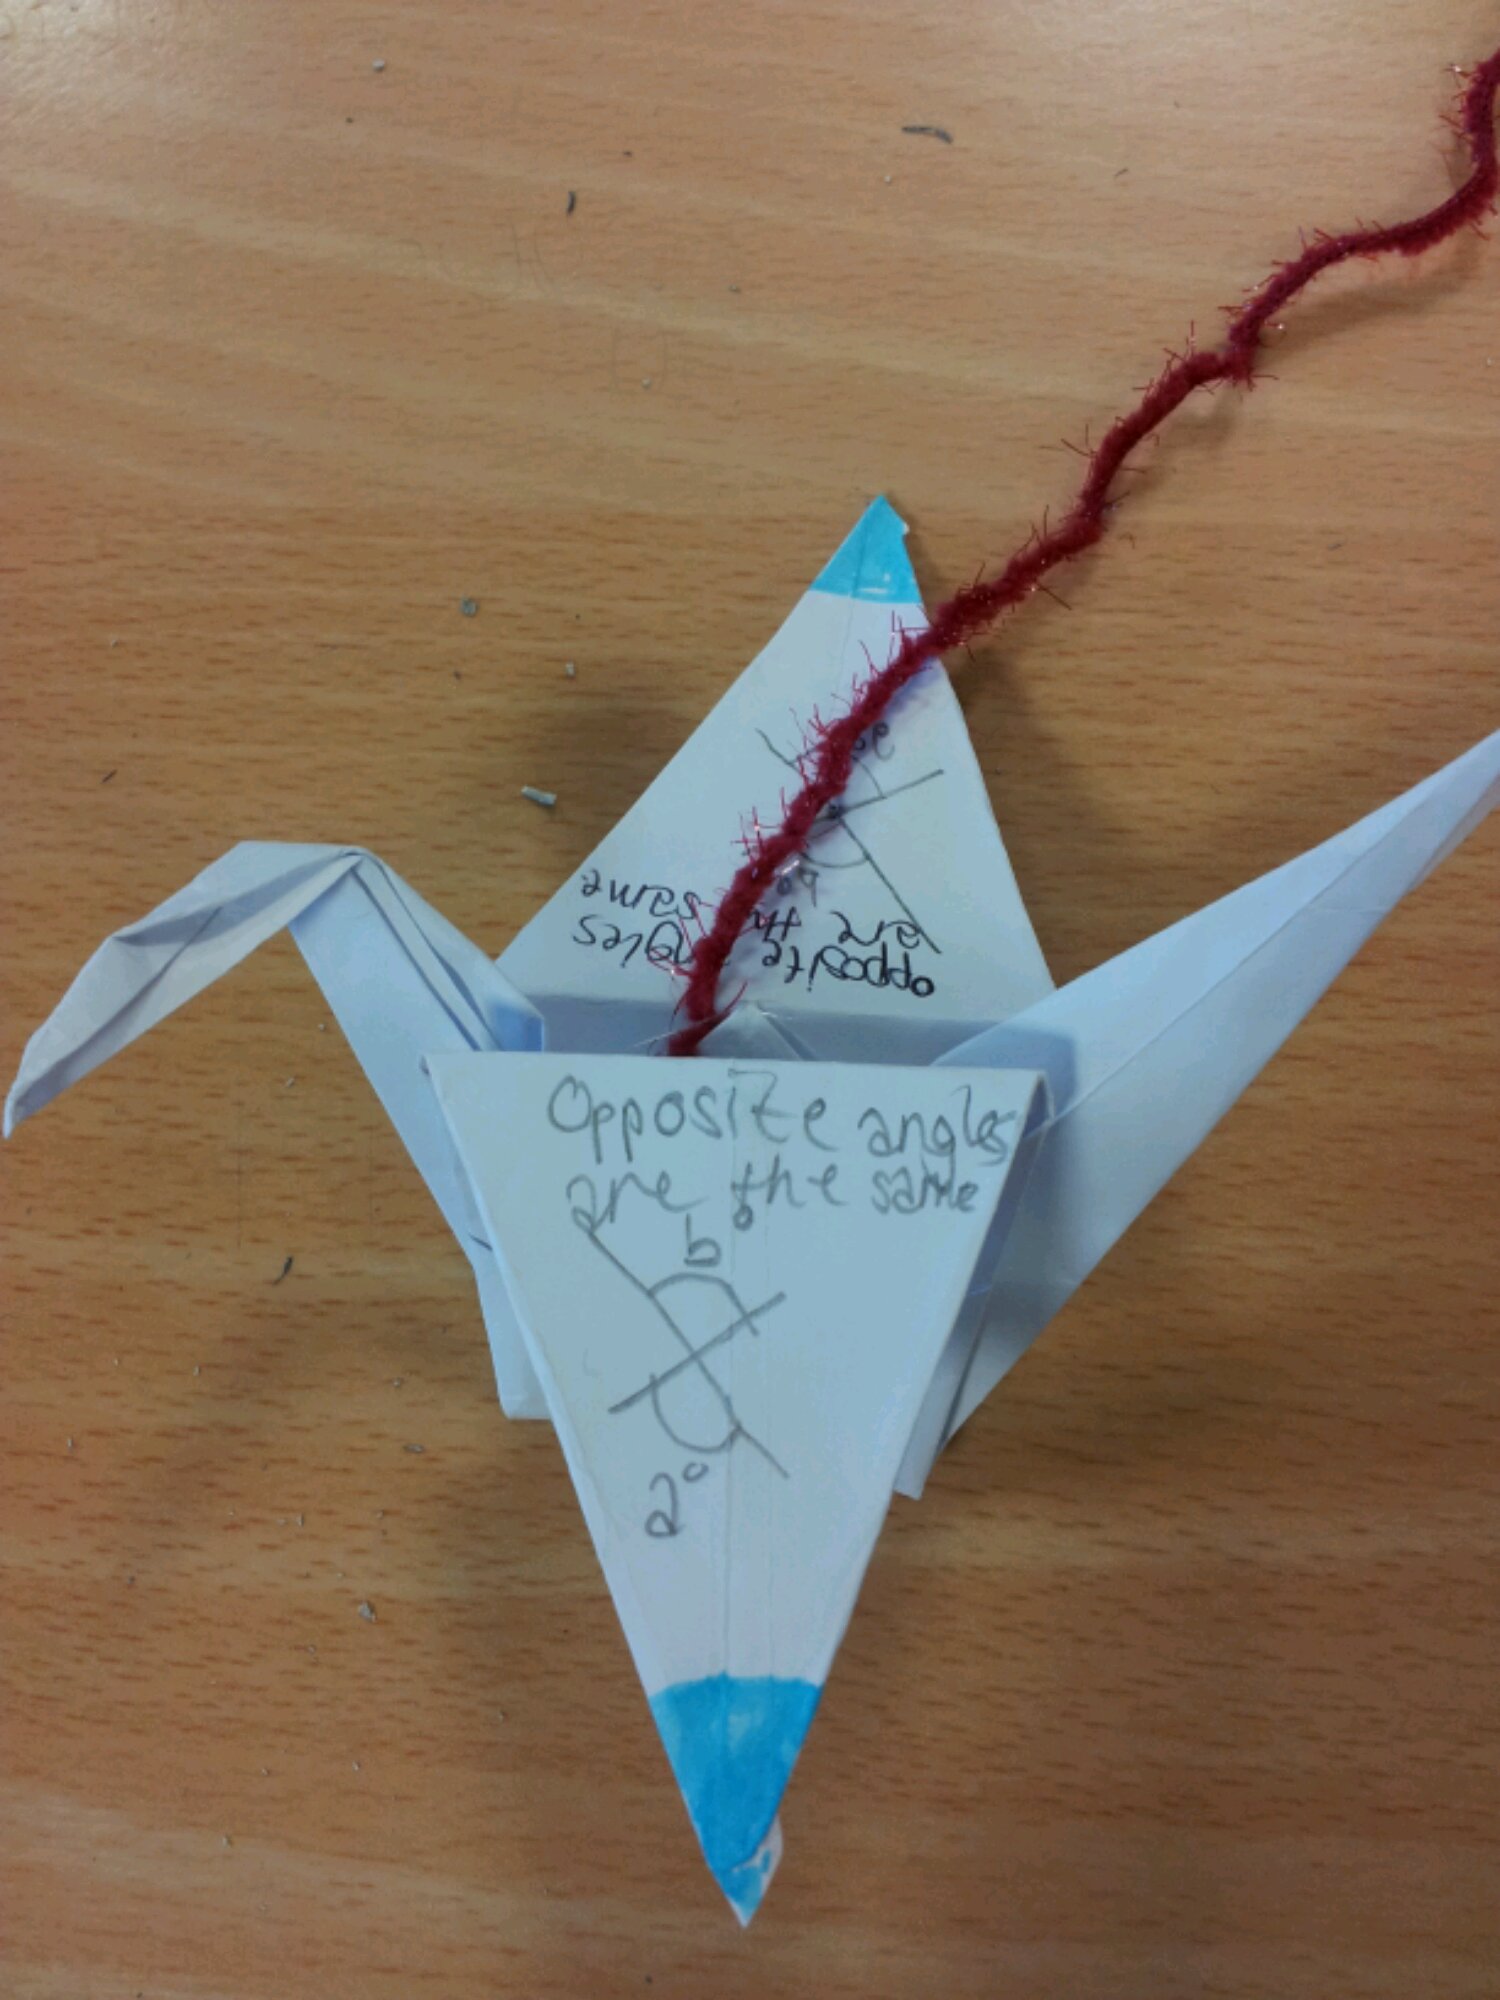
Two girls started folding origami cranes – they’d learnt how for a school project. They then wrote maths facts on the wings. The idea was calmimg, yet contagious!
image

The idea slowly spread across the room. Soon about half the class were folding cranes and writing notes. Someone even found some coloured paper.

image

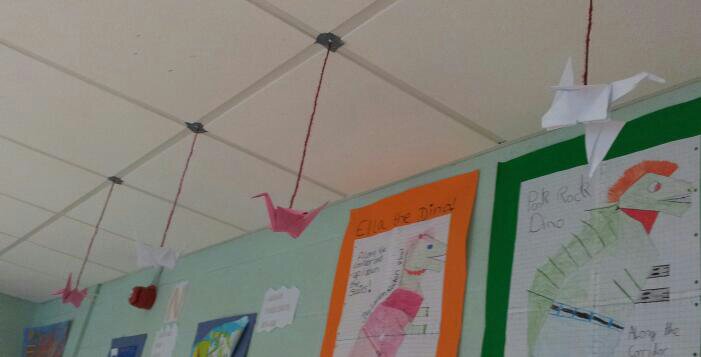
Now there is a small flock of cranes flying across the room which will hopefully remind pupils of the notes they wrote.

If you want instructions on how to fold an origami crane try this YouTube video.

188. Ducks, chalk and gravity

So how did TeachMeet result in me standing in a supermarket one evening doing a price comparison of duct tape?

Let us go back in time to #mathsmeetnorthwest. Dave Usher did a brilliant presentation on ‘Big Maths’, including the use of gaffer (duct) tape in lessons. I thought this was a genius idea – sticky, sturdy and temporary. I didn’t get a chance to buy any at the weekend, so I ended up in the supermarket on a weeknight.

But what to buy?

Cheap own brand duct tape at £2.95 for 15m or branded ‘Duck’ tape at £3.95 for 25m?

I started school the next day with one idea on how to use it, which quickly developed into three..

Lesson 1: Averages

Equipment: Duct tape, liquid chalk marker

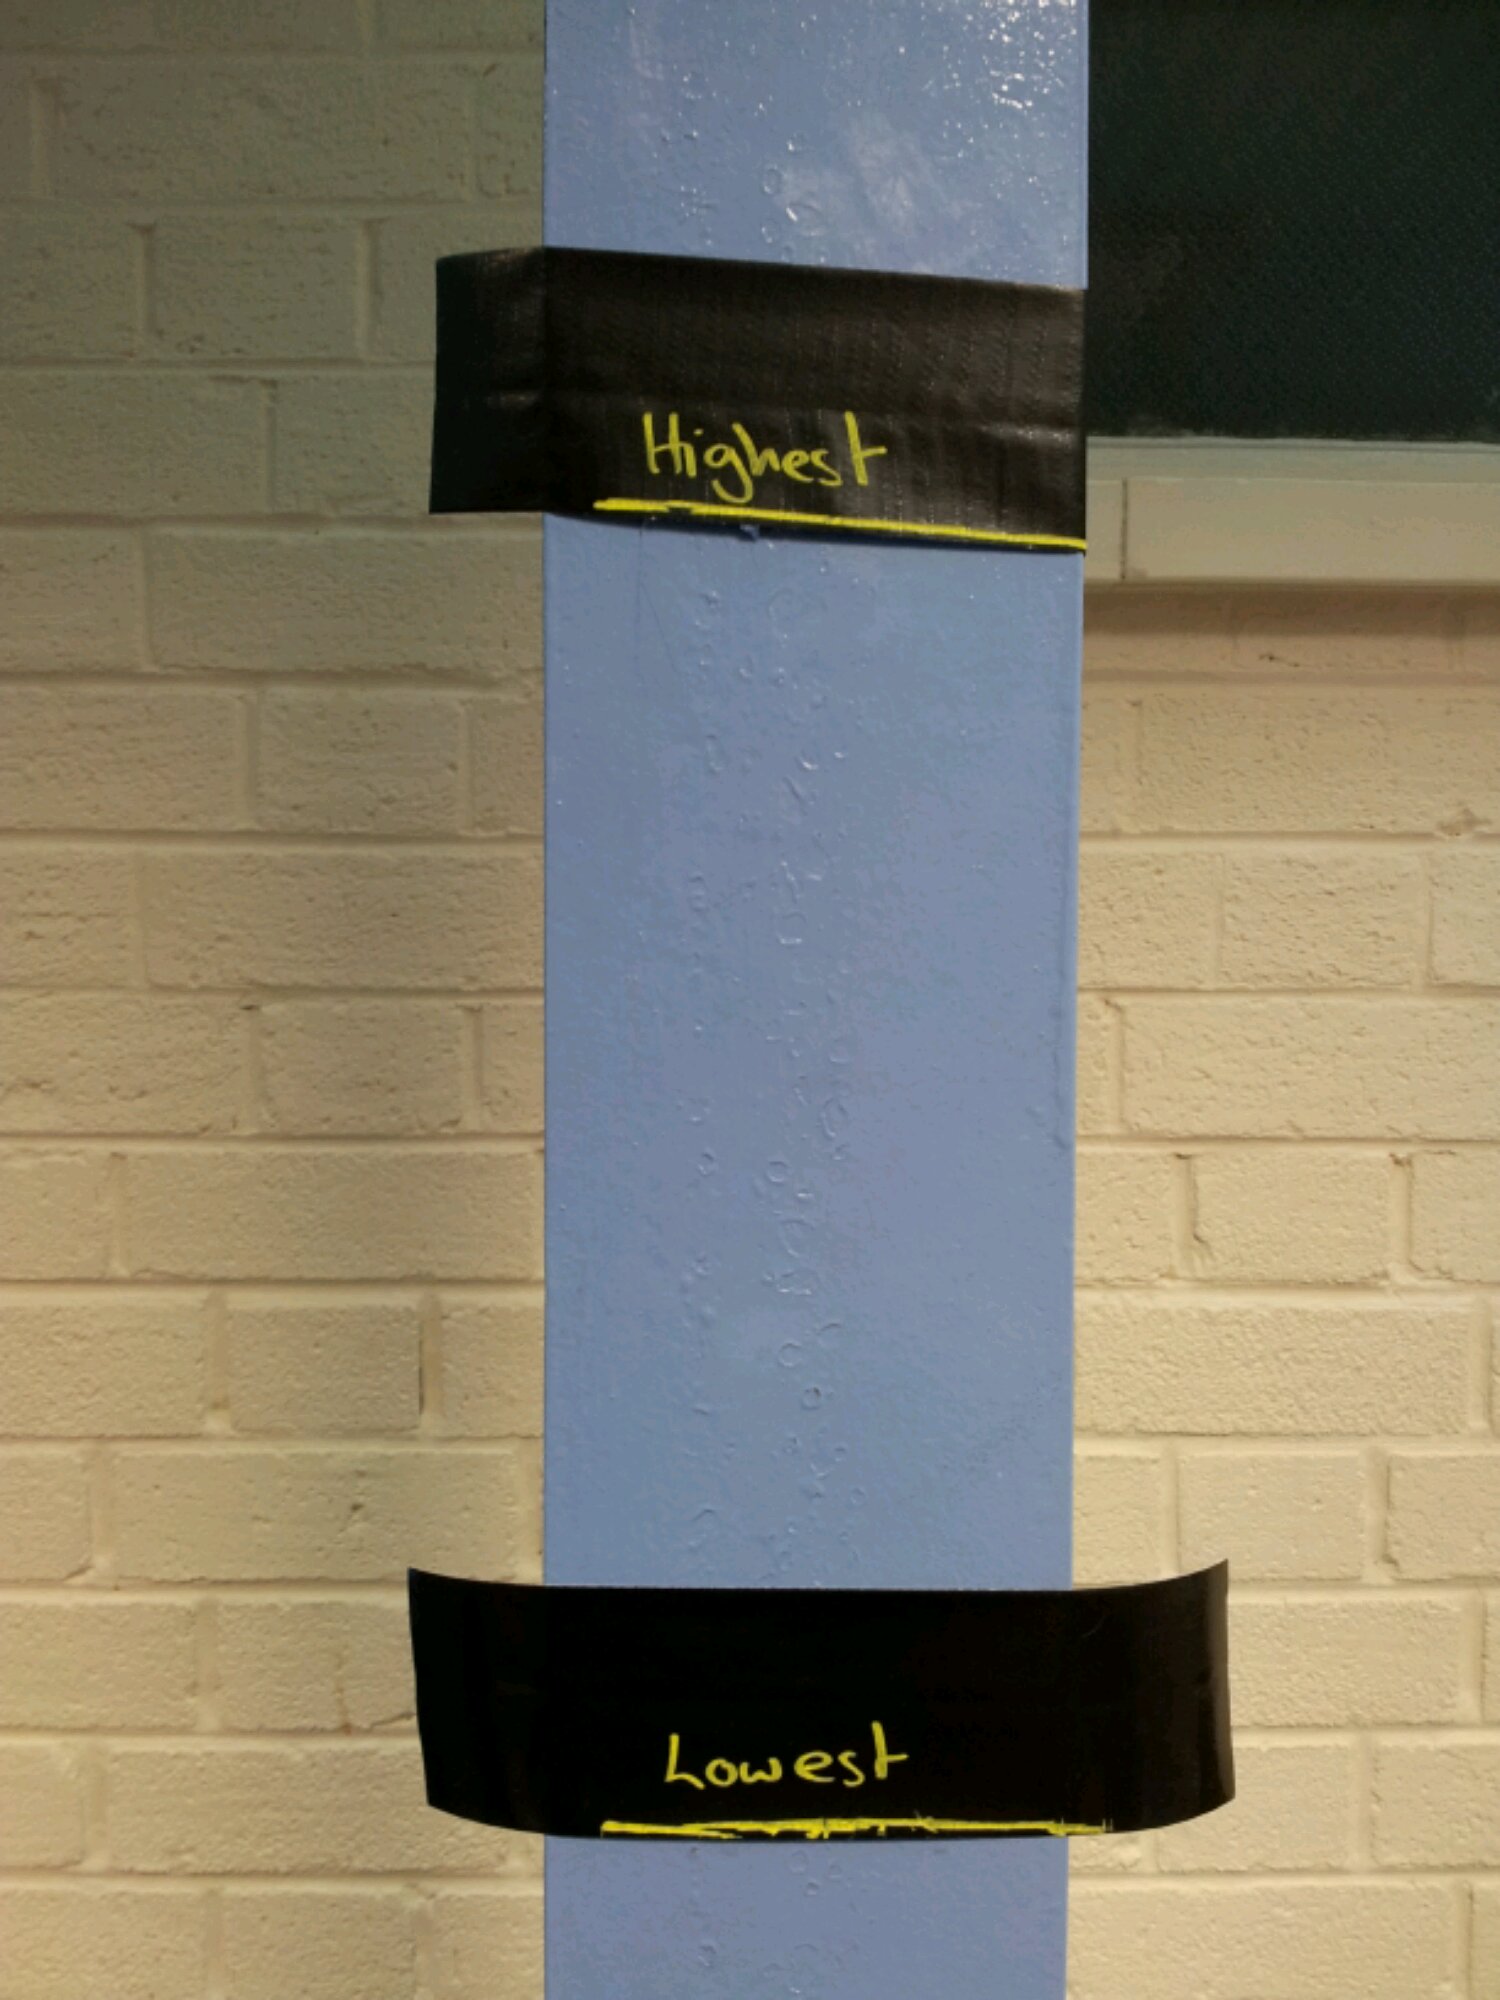
I did averages and range indoors. This meant I couldn’t chalk the walls or floor. However I could mark out key features with tape. I used the activity Averages and marked out the median, the highest and lowest values on the floor. It was at this point I figured out I could write on black duct tape with liquid chalk marker – brilliant! We labelled the wall with the highest and lowest heights of the class so we could see the actual range of heights.
image


Lesson 2: GCSE Revision

Equipment: Exam papers, scissors, glue, wall paper, duct tape

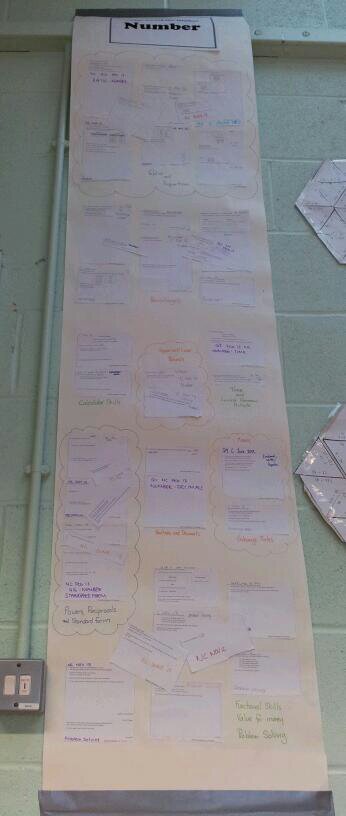
I have been using the Foundation GCSE Review with my Higher GCSE resit group. Reviewing ten Higher GCSE papers involves over 200 questions – that’s a big wall display! Both of the TeachMeets I have attended have used the idea of learning wallpaper. So that’s what we used – I’m grateful that some of my students are over 6ft tall or the wall display wouldn’t have gone up.
image

Now the duct tape was used to secure the top of the wall display and to ‘passer-by’ proof the bottom. It should last longer now that the lower end is reinforced.

image


Lesson 3: A-Level Mechanics

Equipment: Duct tape, liquid chalk, mobile phones, calculators, soft ball (I used a ball of wool)

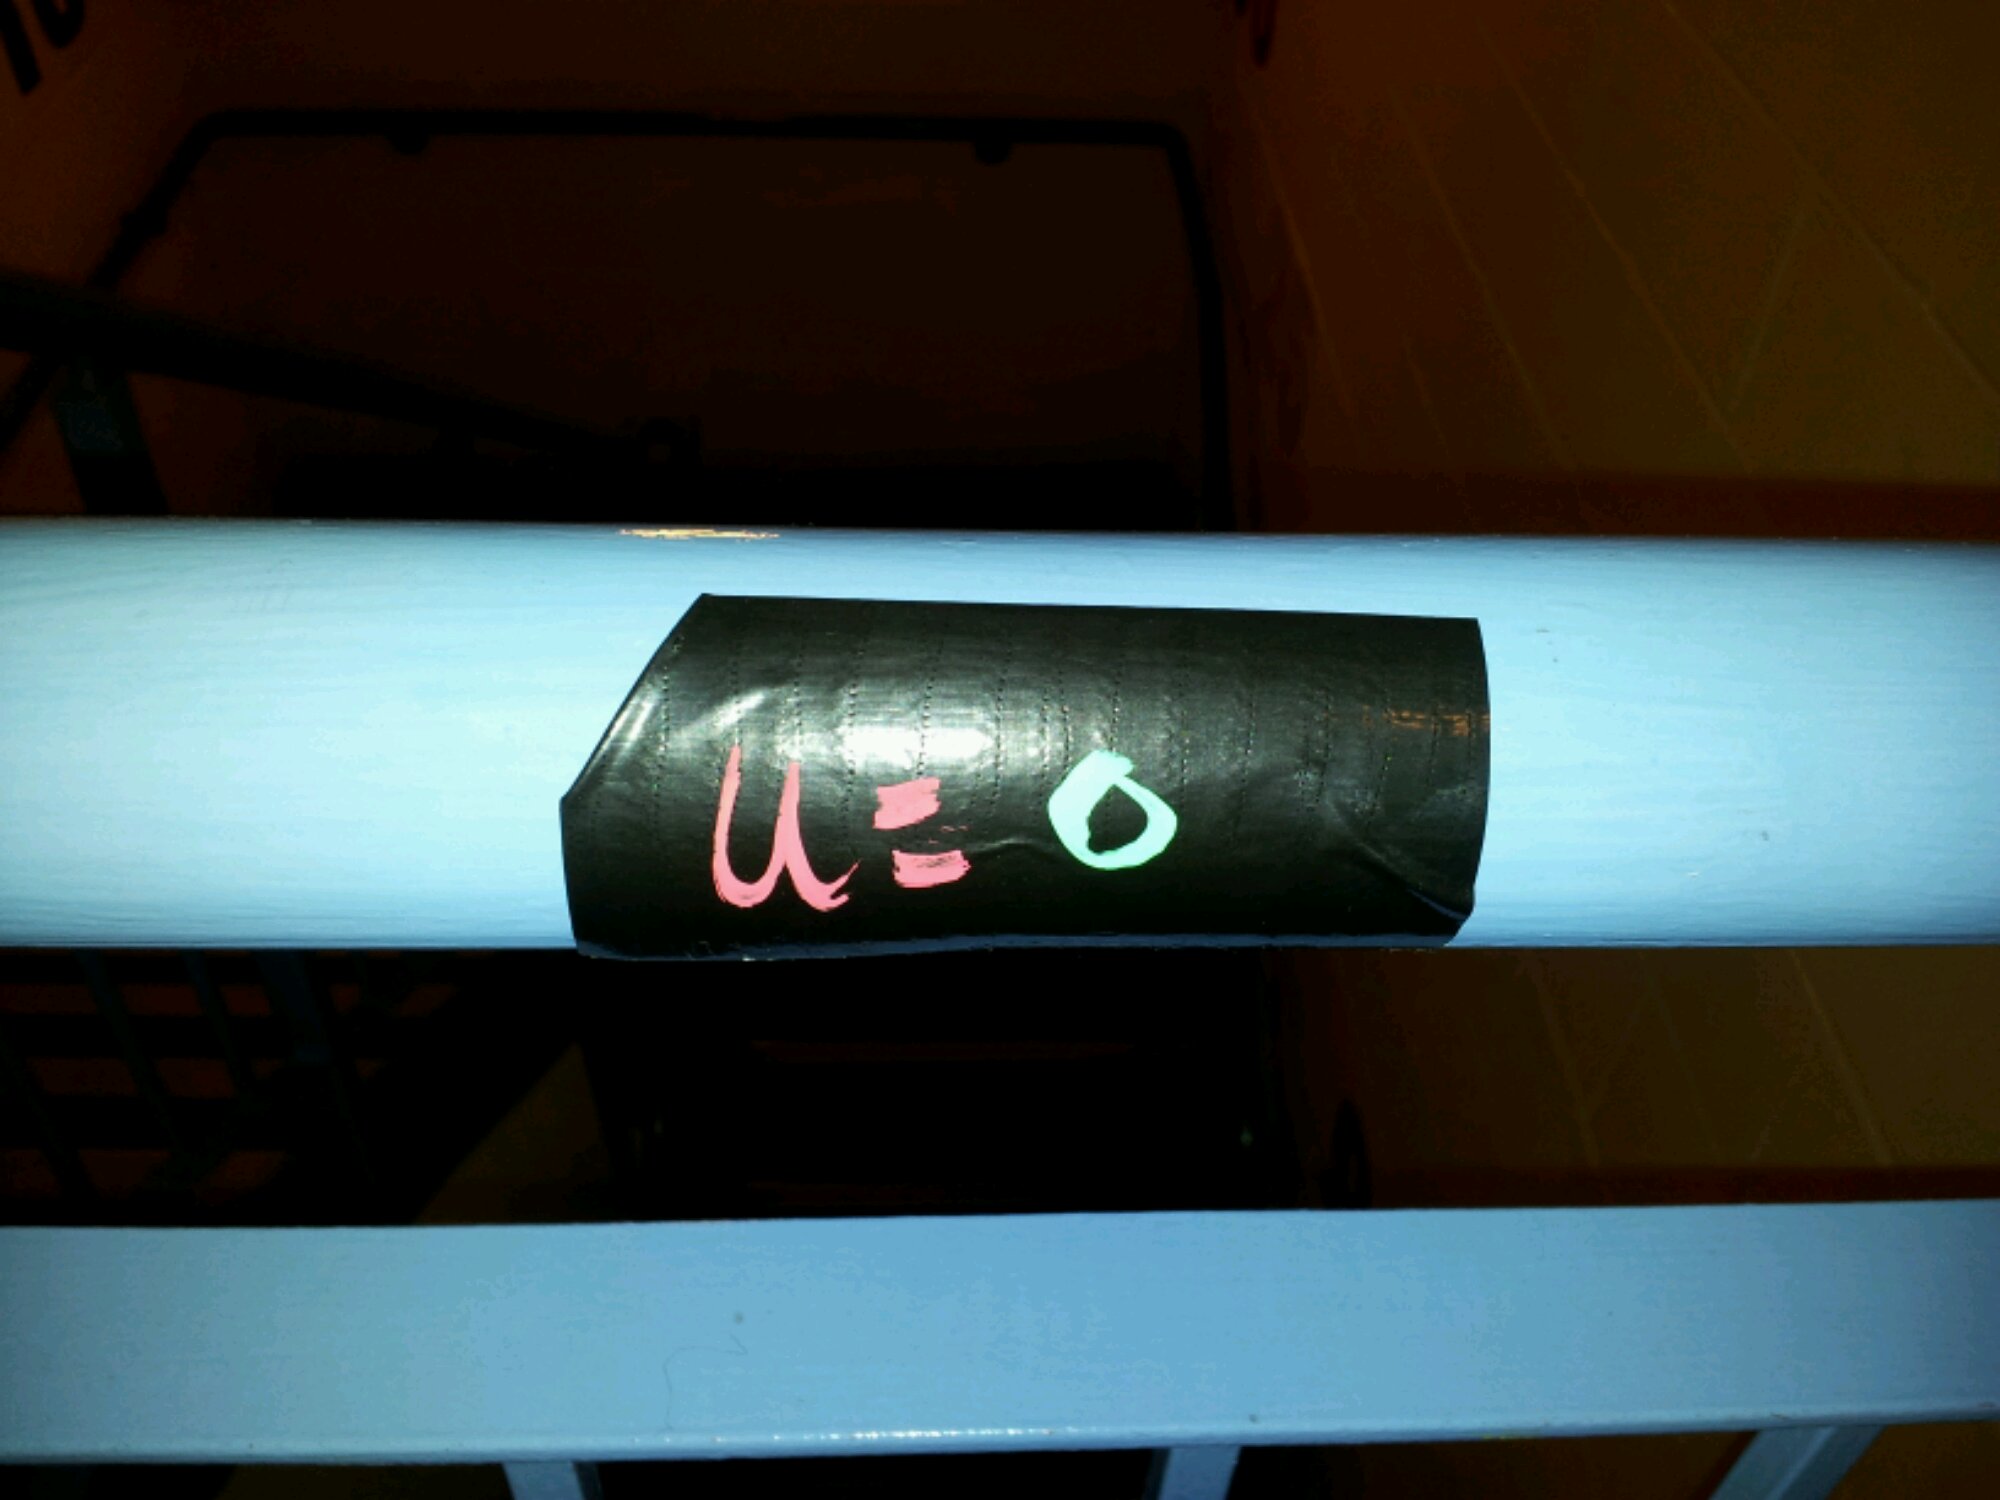
It’s all very well drawing diagrams for A-Level Mechanics questions, but how about a life size diagram? We were looking at vertical motion under freefall/gravity. I gave the students pieces of duct tape chalk labelled with a, s, u, v, t. We went to the staircase and labelled the wall with the tape – so u (initial velocity) was taped to the top of the bannister and v (final velocity) went on the floor at the bottom of the stairs, etc.
image

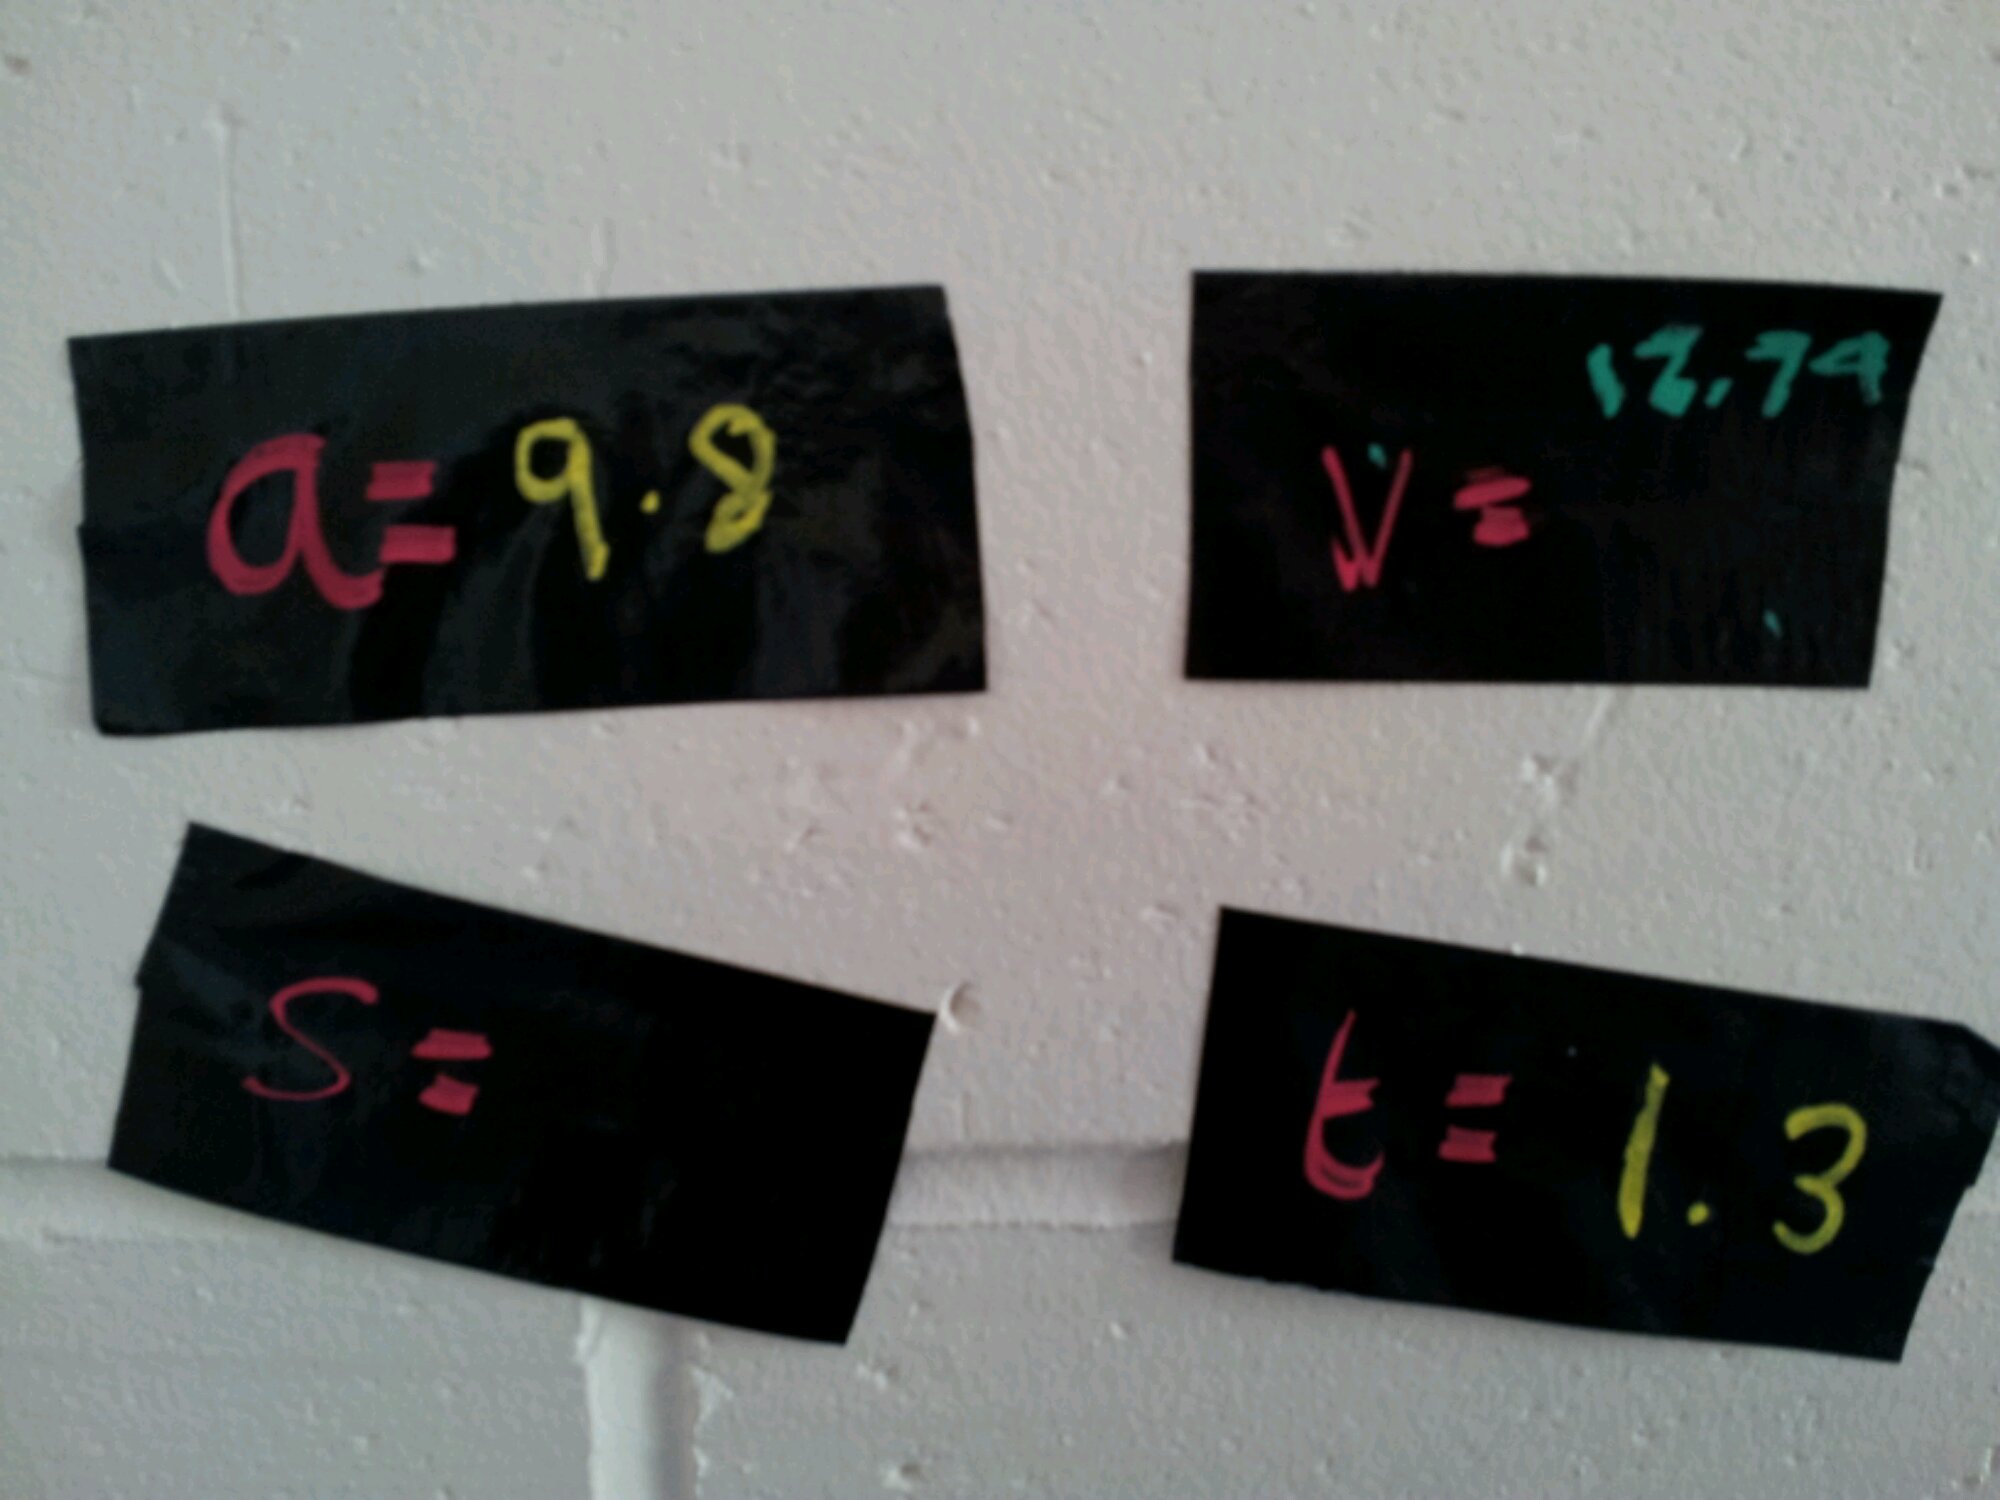
The students then labelled what they knew: a=g, u=0, v=?, t=?, s=?
image

The students used mobile phones to time the drop from the bannister to the floor and calculated the distance and final velocity. The physical activity allowed us to think about how to draw these kinds of diagram.

And finally …
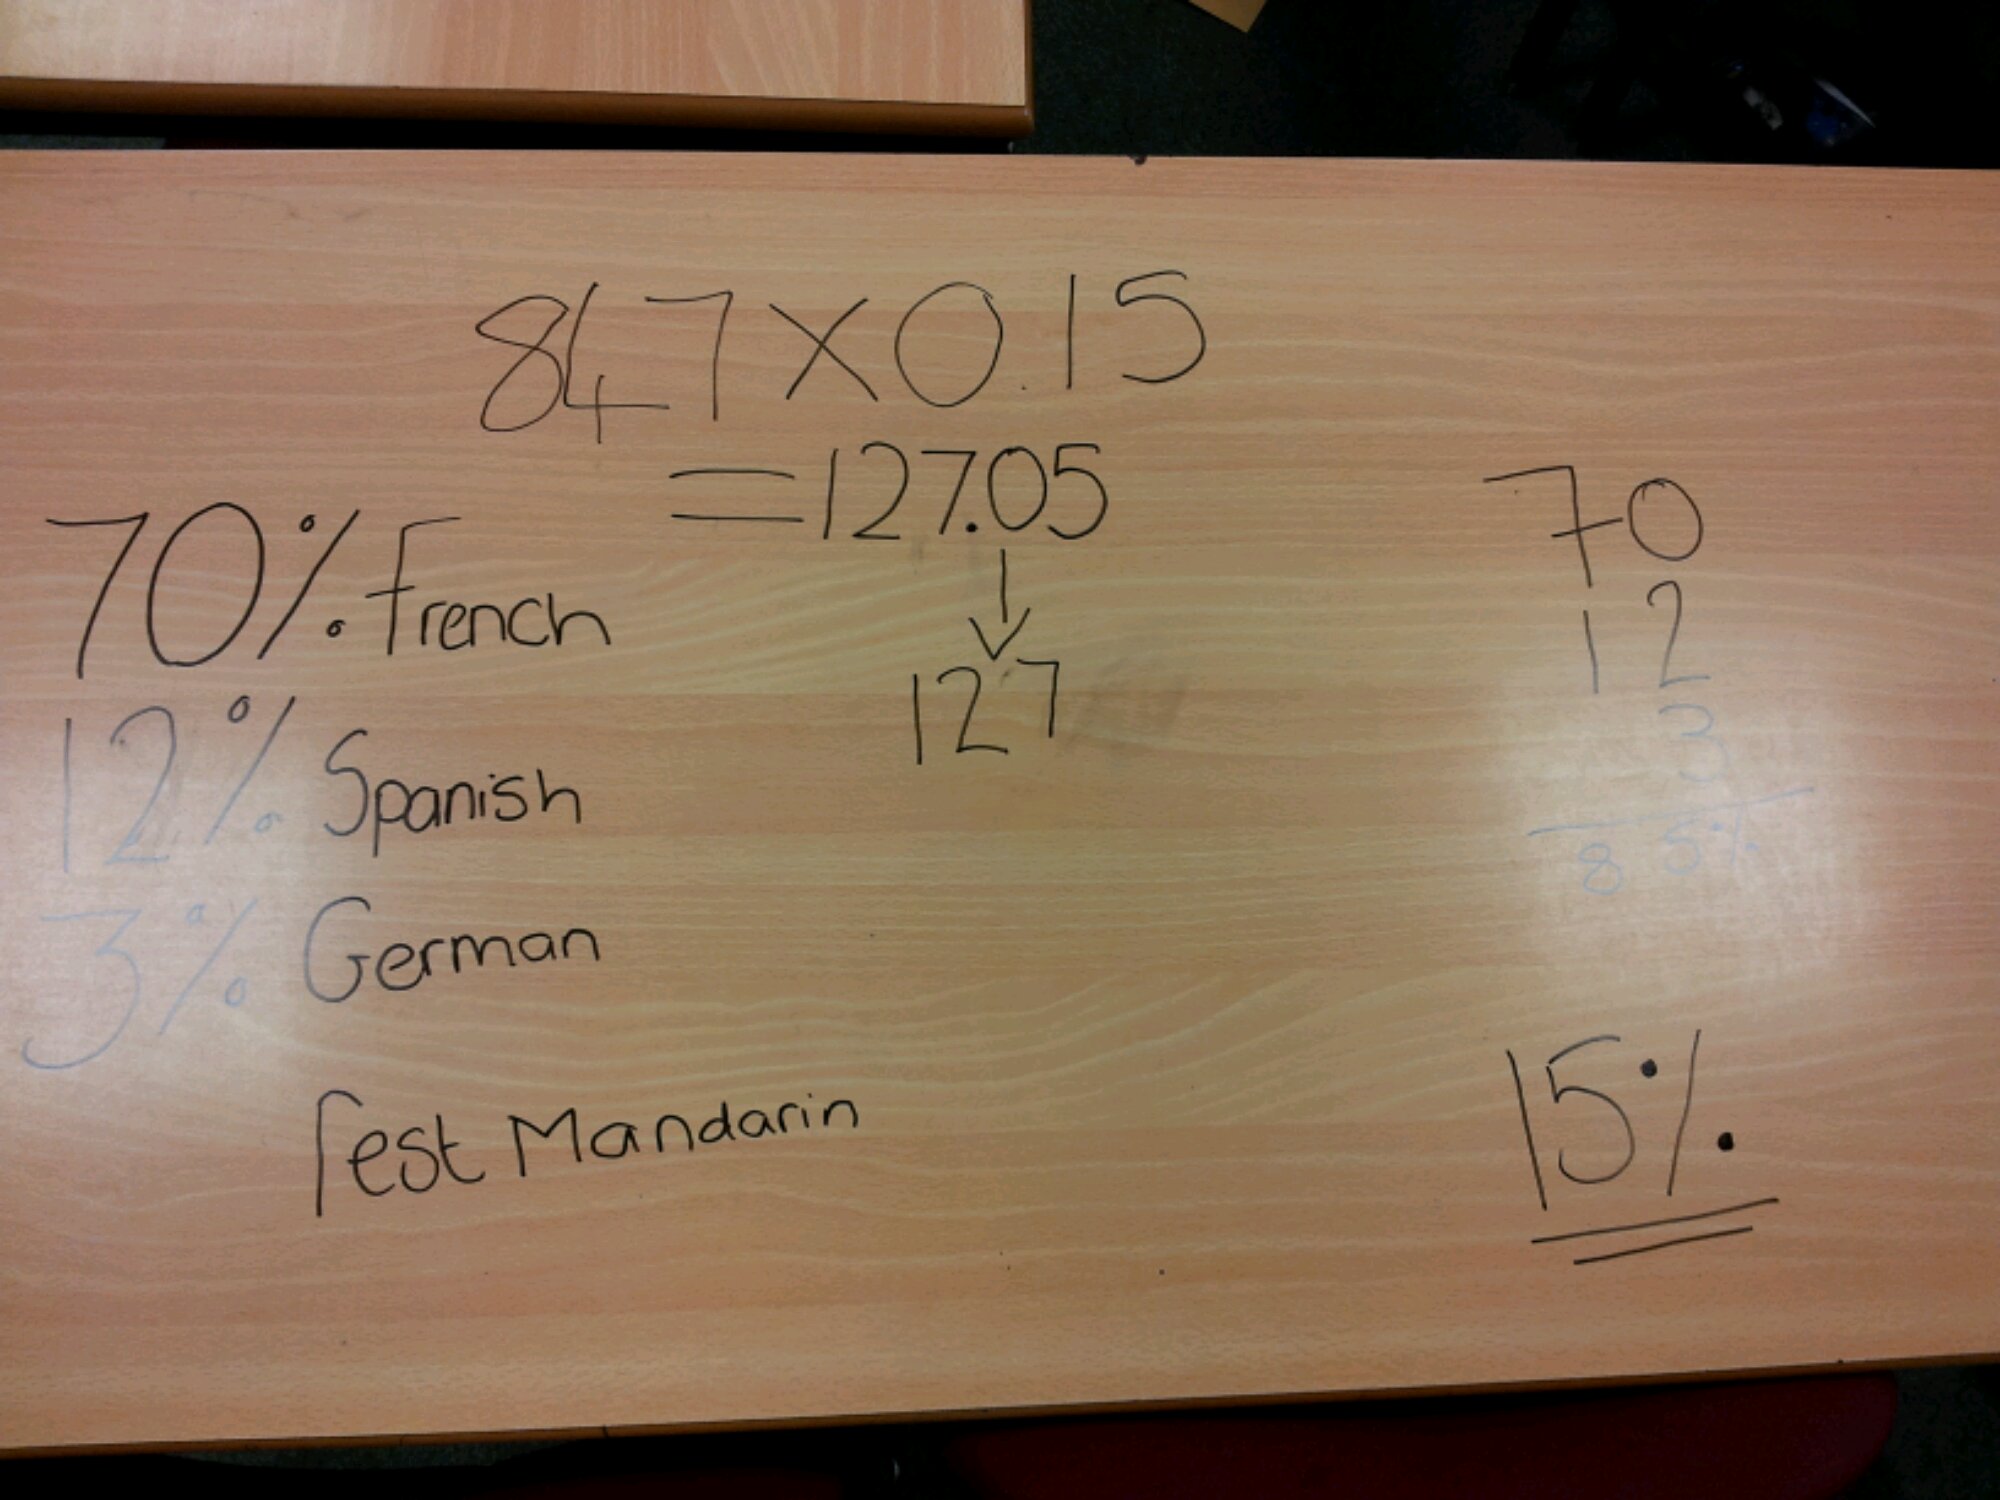
Just some pictures of an alternative whiteboard:
image

image

187. Clever circles

Here is a quick, multi-function resource for you: a set of overlapping circles for angles, pie-charts and fractions/percentages.

Equipment
Card
Scissors
Pencil
Straight edge or ruler
Pair of compasses
A 360 degree protractor printed on paper (or a tracing paper protractor cut out)

Construction
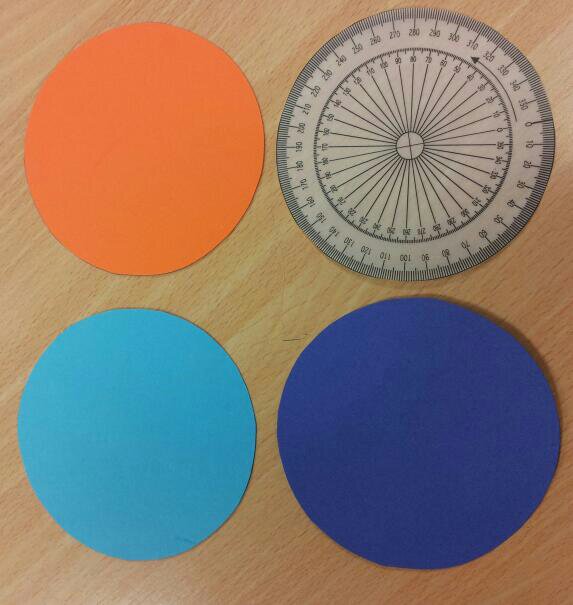
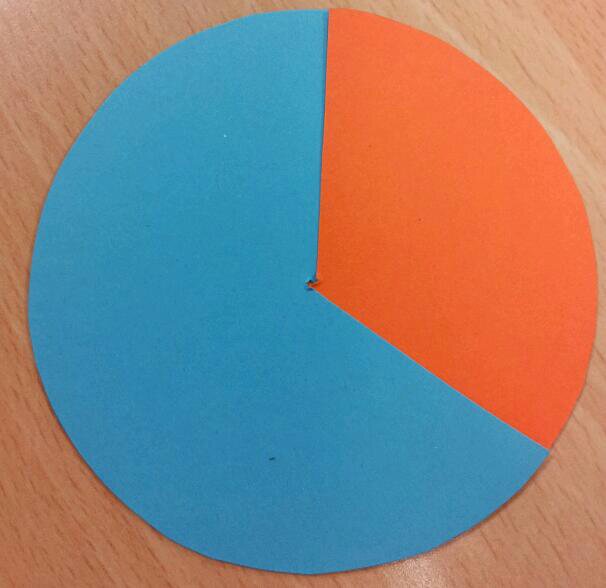
1. Cut out three identical circles and the paper protractor.

image

2. Stack them on top of each other and put the pointy end of the compasses (or a drawing pin) through the middle. Wiggle it around to make a bigger hole – please don’t stab yourself.

3. Draw a radius on the circles.

image

4. Cut down each radius on the circles and the 0 degree line on the protractor.
5. All done!

Activity 1: Angle Estimation
Slot two circles together:

image

Estimate the orange angle.
What could the blue angle be?
Show me an acute angle.
Show me a blue 170 degree angle.

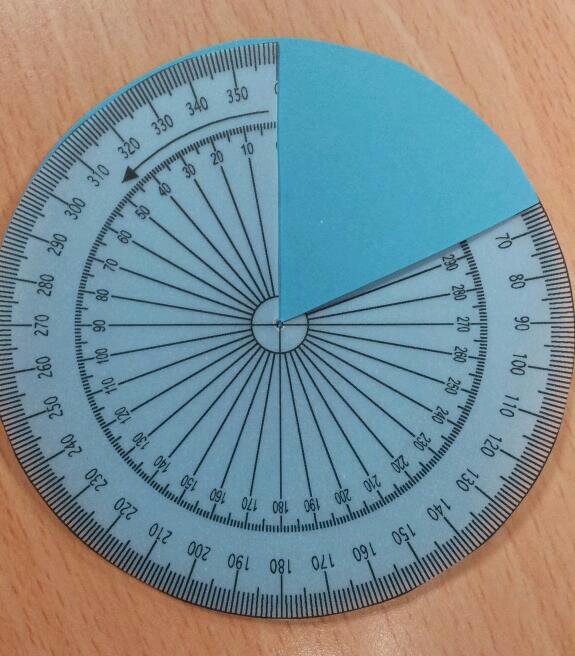
Activity 2: Reading a protractor scale
Slot the protractor into a circle:

image

How big is the blue angle?
Show me an 80 degree angle.

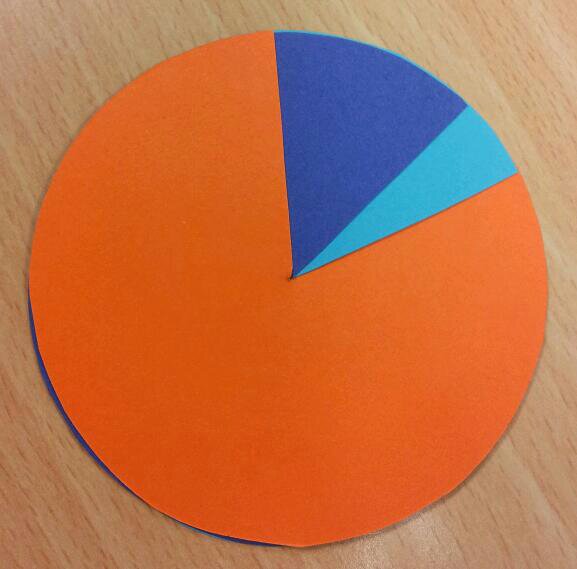
Activity 3: Pie-charts
Slot the three circles together:

image

What could this pie-chart represent?
Show me a pie chart with two equal sections

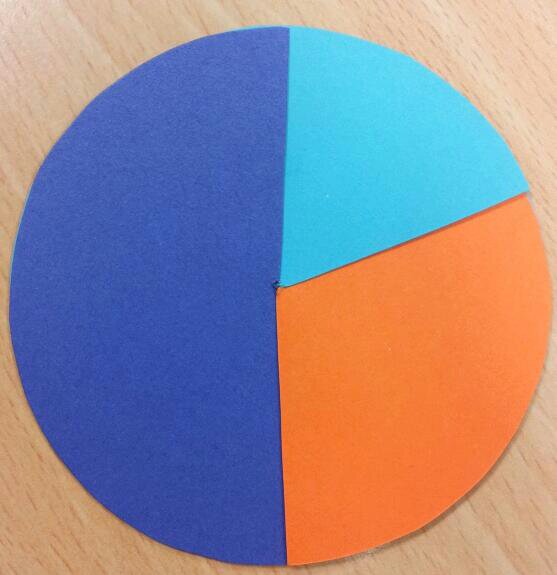
Activity 4: Fractions and percentages
Use three circles again:

image

Estimate what percentage is purple.
What fraction could the blue section represent?

176. Christmas Craft

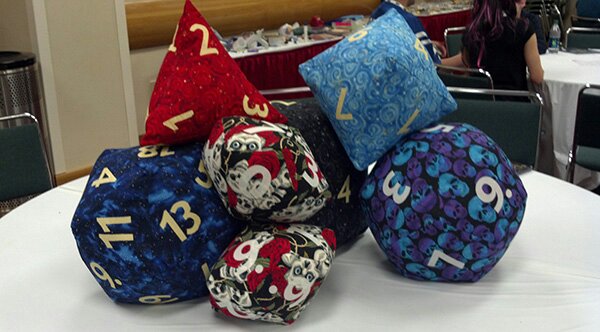
So, what to craft for that maths geek special someone … may we suggest polyhedral dice pillows?

image

These squashy beauties are from ¡The Anticraft!. There are full instructions and helpful diagrams on the website. These would also be a great classroom resource.

Warning: the folks at Anticraft are honest in their language, so don’t click if you prefer subtler prose.

163. Traffic light trail

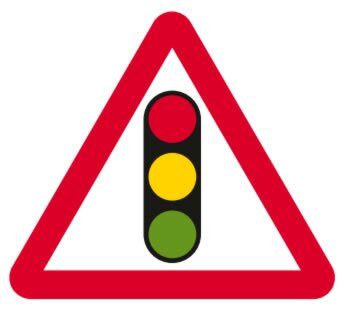
In post 104 I mentioned a rather splendid traffic light percentages trail by Whidds (Percentages shout out”). This week I decided to create my own traffic light trail.

image

How it works
Each card has three questions on it. Green is easy, amber is okay, red is challenging. Pupils write down the card number and which colour they are attempting. Pupils are free to choose the level of difficulty – however the teacher can direct them to harder/easier questions as appropriate.

My trail is about division:
Green = Division based on understanding of multiplication tables.
Amber = Short division, no remainders
Red = Same digits as amber, but with a decimal divided by an integer
Download the Division traffic light trail.

Running the activity
My cards are actually powerpoint slides. I started by showing the class the first question and explaining how to choose and answer. I printed out the question slides 2 per sheet of A4 to make roughly A5 cards.

Of course, there was a twist – I hid the cards around my room and in the corridor. A helpful (tall) sixth former had even stuck one on the ceiling for me! There was a real feeling of enthusiasm as the class searched for and answered the cards. One pupil finished the whole trail very quickly, so he was sent around again. I suggested amber questions, he went for red cards and was very successful.

You might decide to award points for level of difficulty for an additional level of competition.

At the end of the activity, I showed the final slide of the presentation: colour coded answers. They marked their own work.

Review
I was really pleased by the increased level of engagement throughout the class. And burning off some surplus energy didn’t do any harm either!

153. Sequences Starter 2

So, you’ve got term to term sequences sussed. Time to tackle Nth term!

This idea just sort of appeared in my sequences lesson.

Equipment
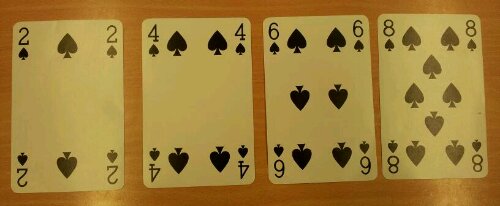
Giant playing cards (or numbers on two different colours of A5 card)
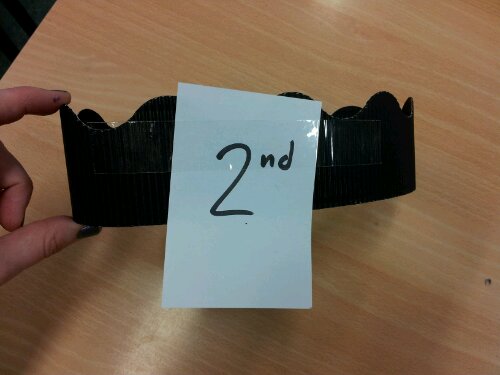
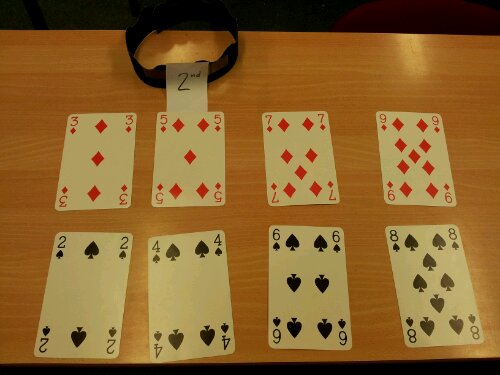
Numbered headbands (I made crowns out of corrugated border card)

Set Up
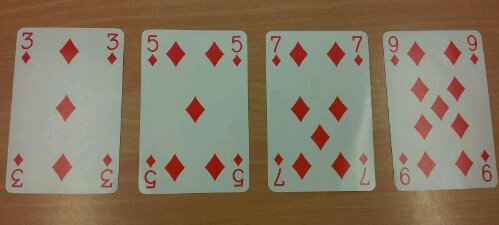
1.Lay out one coloured set of cards on a table or the floor – these are the ones we needed in class. We started with all the cards in the suit.

image

2. Issue headbands to four pupils.

image

3. Pupils stand in number order.
4. Give each pupil a different. coloured card from a sequence to hold facing them.

image

Task
1. Explain that each person represents a term in a sequence, given by the headband.
2. Pupil 1 turns around their card – Red 3.
Question: What is the next number?
Answer: Don’t know
3. Pupil 2 turns around their card – Red 5.
Question: What is the next number?
Answer: Might predict 7
4. Pupil 3 turns around their card – Red 7.
Question: What is the next number? Why?
Answer: 9, add 2.
5. Reveal the last number – Red 9.
6. What is the pattern? Add 2 Which multiplication table has the same pattern? Twos
7. Give each pupil in the sequence the appropriate number from the two times table.
Question: How do you turn the two times table into the sequence?
Answer: Add 1

8. How do you get from the headband to the sequence?
Headband x 2 + 1 = sequence

image

9. What about a headband with 10 on it? Or 100? Or a mystery number?
10. Try this with other sequences and develop the idea of Nth term.

Outcome
I used this as a plenary for a term to term sequences lesson with a shared class. In the following lesson my colleague, D, used this idea to develop the concept of Nth term with another class. He wanted to make something for the pupils to have in their book to remember this. This is what he came up with: Handout for sequences intro (pptx) or How to for sequences(docx). I’m currently trying out hosting my own resources, rather than using TES resources – so we’ll see how effective this is.

140. Cut out the Quartiles

Quartiles on cumulative frequency graphs are such easy questions when you get ‘it’. The hair pulling, nail biting wrong answers you see on exam papers make you wonder if you’ve ever taught the topic. Time for the scissors again …

Activity
This activity demonstrates in a practical and visual way how to set up the quartiles on a graph.

Equipment
Printed cf graphs
Rulers
Scissors
Glue
Coloured pens

Task
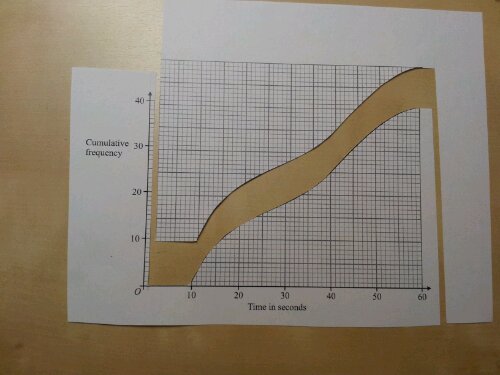
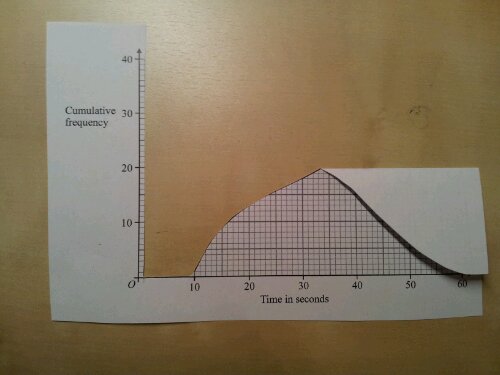
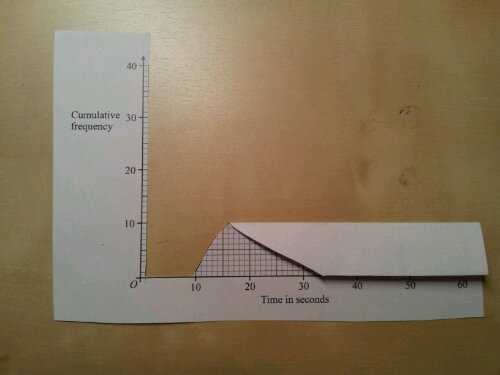
1. Cut out the area to the left of the graph. Leave a column of graph squares next to the y-axis, for scale. Cut exactly to the top of the curve.

image

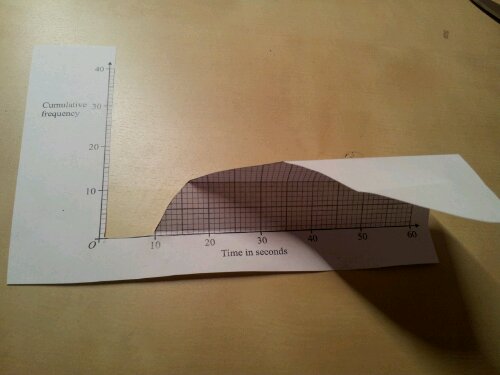
2. Fold the graph in half, parallel to the x-axis, with the maximum value just touching the axis.

image

Repeat the half fold again
image

3. Fold along the x-axis. Unfold – you’ve just divided the graph into quarters. This should reinforce that y-axis is split into quarters.

image

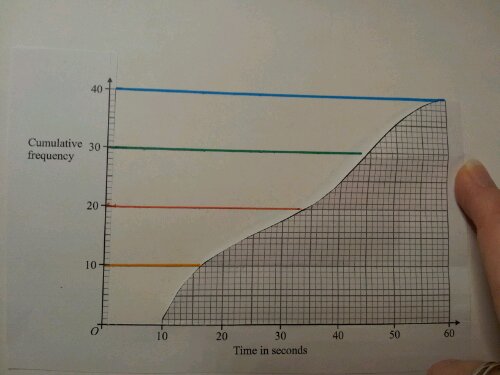
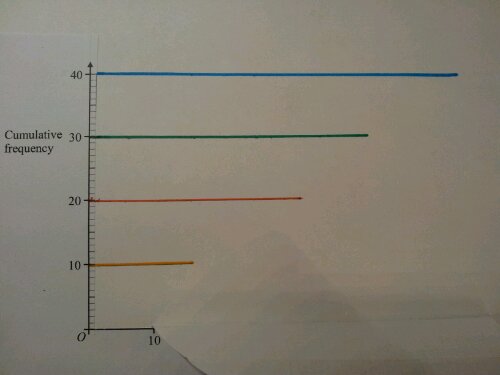
4. Stick down the axes. Place a ruler on the fold lines and join the ends of the folds to the y-axis.

image

5. If you fold the graph forward you get this:

image

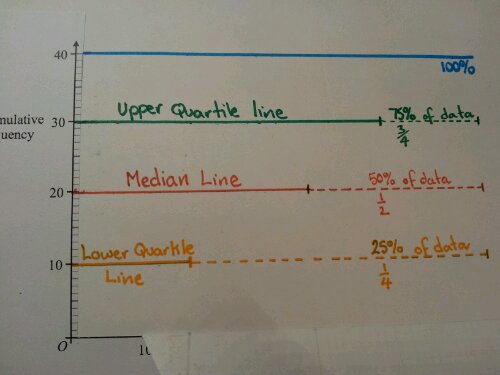
6. Put a mark at the end of each line and continue with a dotted line. Discuss what proportion of the data each line represents and label it.

image

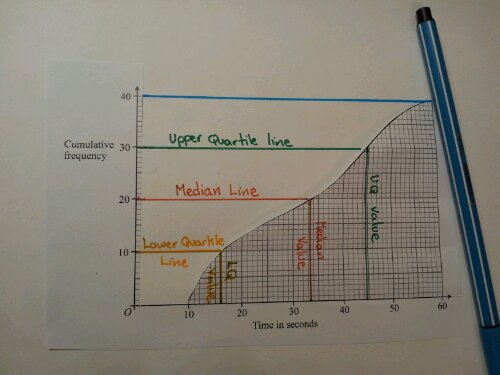
7. Fold the graph back and mark in the vertical lines. Solutions,can now be read from the x-axis.

image

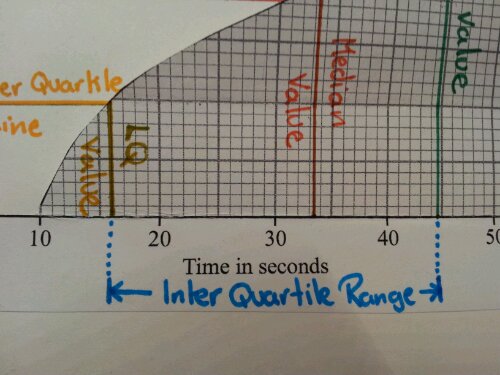
8. The interquartile range can also be highlighted and calculated.

image

Review
This activity covers a fair few learning styles and creates a visual/memorable resource,in their books. Since using it, the number of pupils who quarter the x-axis has dropped significantly. I hope it works for you.