Category Archives: Number

231. Fish Shop Maths

I’ve been using this idea since I first started teaching and I’ve finally got around to typing it up!

fish_chips

Image Credit:http://coachandhorsesn16.com/eat/fish-n-chips/

I introduce order of operations by creating an imaginary Chip Shop. I usually read out orders and get the students to write down what they think they are on whiteboards. Note that when you read out the orders, the punctuation doesn’t give any hints.

  • ‘Two fish and three chips’ – 2 fish & 3 portions of chips
  • ‘Fish and chips twice’ – 2 fish & 2 portions of chips or 1 fish & 2 portions of chips
  • ‘Five sausage and chips’ – 5 sausages & 5 portions of chips or 5 sausages & 1 portion of chips

This activity always prompts a ‘discussion’ as to who is correct. The misconception of what an order could mean links nicely with the misconception when working out 2 + 3 x 4. You could also adapt the idea for writing algebraic expressions.

A presentation, with questions, is downloadable in three different formats here:

Fish Shop BIDMAS (pptx)

Fish Shop BIDMAS (ppt)

Fish Shop BIDMAS (ppsx)


229. Speed Camera Maths

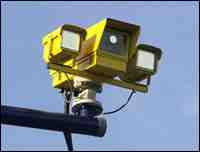
Speed Cameras are so last century: discerning law enforcement agencies favour the Average Speed Camera!

image

These motorway delights timestamp when you go through certain checkpoints and calculate your speed between them. No complicated laser guns required, just number plate recognition and a little distance/time calculation. This already sounds like a KS3/4 class activity or a Mechanics A-Level starter.

Equipment
Squared paper
Pencil
Ruler
Coloured pens
Calculator (optional)

Question
Can you find three different (safe) strategies for staying on the right side of the law through extended roadworks? You must average 40mph over 12 miles (original speed limit 60mph).

Visual Prompt
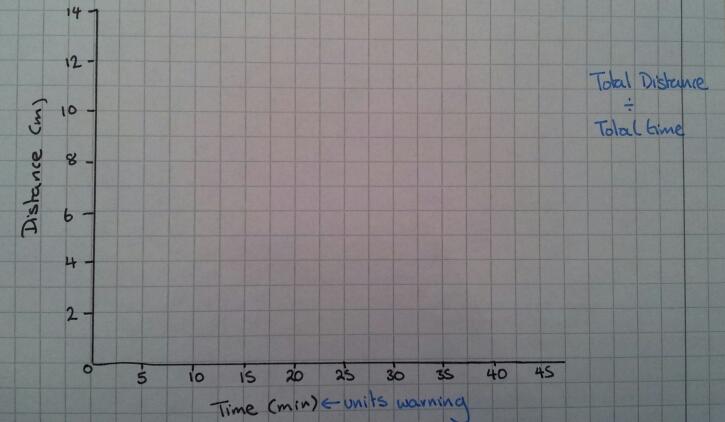
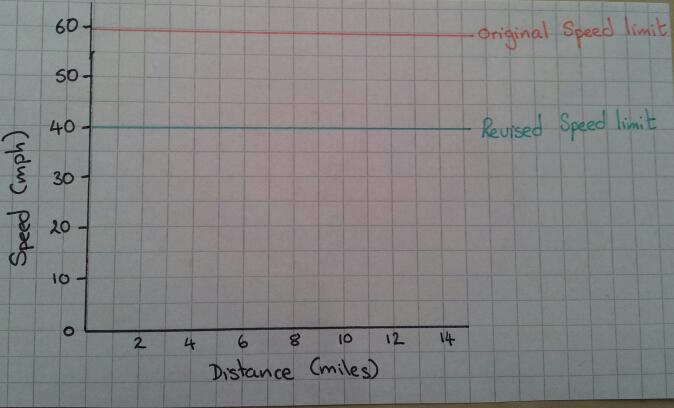
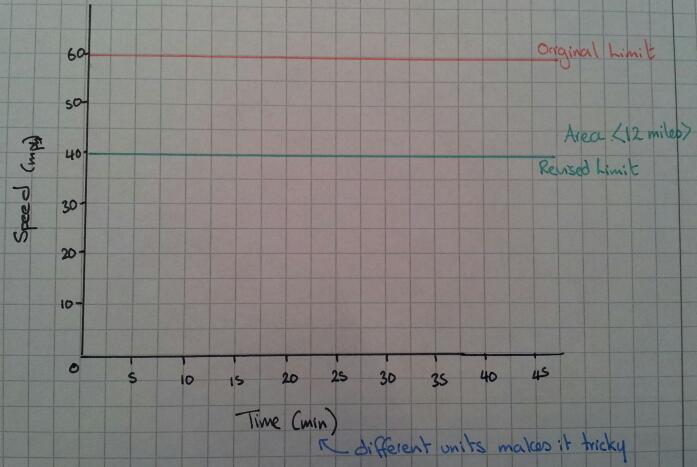
To start off with just draw out blank axes and discuss how you could visually represent this problem.

Idea 1
A distance-time graph

image

Idea 2
A speed-distance graph

image

Idea 3
A speed-time graph

image

The straightforward option
How long should it take you to get through the roadworks if you stick to exactly 40mph? What does this look like on a graph? Which type of graph shows this information best?

Top Gear Alert
The boy racer wants to go fast, but avoid a ticket – what could he do?

Hint
What does ‘Average Speed’ actually mean?
Can you instantly jump between speeds?
Is acceleration going to effect your calculations?
What assumptions should you make about acceleration?
Do you need to work out the area under the graph or the gradient at all? How will you do this?
Can you describe what is going on?
Is it safe/legal?

Outcome
Your students should be able to produce many different graphs of how to stay on the right side of an average speed zone. They should be able discuss their findings with each other. However the morality or safety of their driving ideas may be a topic of discussion for a later PSE lesson …

228. Toblerone Tessellation

Christmas has come early to my local Co-Op. I was intrigued enough to buy and eat the new Christmas chocolate, but not before marvelling at the mathematical elegance of it’s structure:

image

Image credit: http://www.distinctiveconfectionery.com/personalised-christmas-triangular-toblerone-box.html

The slab of equilateral chocolate breaks up into 9 smaller equilateral triangles. Or you could tessellate more of the big triangle.

Break off the corners and you get a hexagon.

Break off one corner and you get a trapezium.

Two triangles together makes a parallelogram … or it a rhombus? Good discussion point there!

The bar weighs 60g – how much does each triangle weigh? What about the weights of the other shapes you could make?

The dimensions are listed as 180x180x10mm. Where would these measurements fit on the triangle? Is it the length, width and height? Why? Can you calculate the dimensions of the other possible shapes?

Once you start thinking about it, there are lots of activities you could do … and there is the potential to eat your work! As usual, if you are going to do this, make sure you are aware of food allegeries.

224. No Nonsense Negatives

Ever had a simple idea for a starter which your class just flies with? It happened today for me:

Background
In the previous lesson students understood the meaning of ‘y=mx+c’, but struggled to rearrange equations in this form. With this in mind, I went back to the basics of manipulating calculations.

Starter question 1
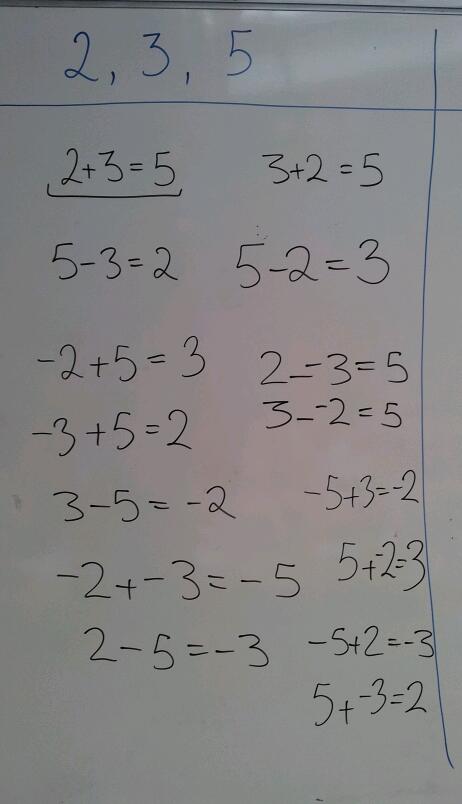
Make as many calculations as you can only using the numbers 2, 3 & 5 (once each) and any symbol you like. The obvious answer is 2+3=5.

Starter question 2
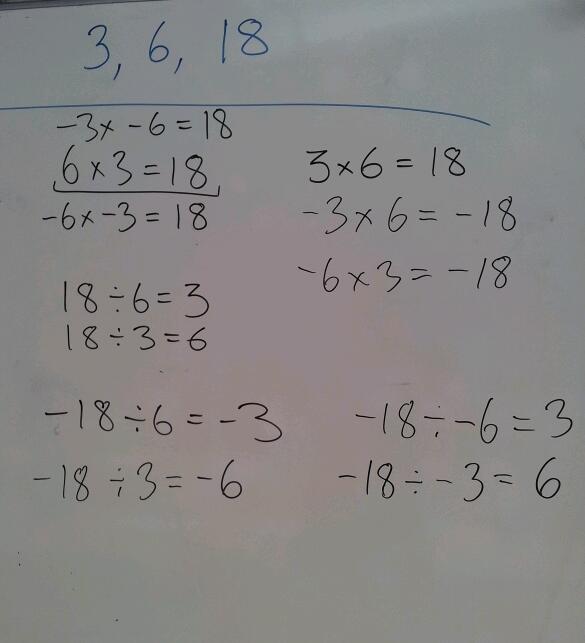
Make as many calculations as you can only using the numbers 3, 6 & 18 (once each) and any symbol you like. The obvious answer is 3×6=18.

The Extension
Most groups quickly found three solutions for each question. Some even used inequalities. To extend their understanding I suggested that they could use as many of each symbol as they wished – would a sprinkling of minus signs increase the number of results?

Results
The following pictures show the ideas my class came up with. I was using lolly sticks to randomly pick students and no one wanted to be the first to not give an answer.
image

Followed by:
image

We discussed the rearrangements and linked them to rearranging equations. They appreciated that one equation could be written in many different ways. This activity would work equally well to consolidate negative numbers.

223. Let them eat custard!

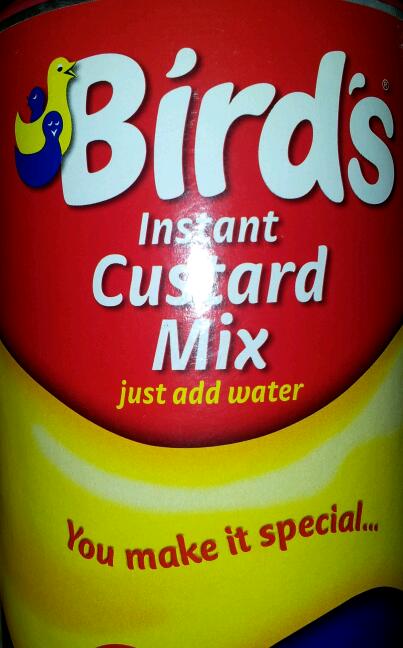
This post isn’t a resource, more of a source of ideas. We tell students that maths is about problem solving, but how many problems are fictitious?
image

Here is a problem, taken directly from ‘real life’ when a friend was making custard on sunday evening.

The question
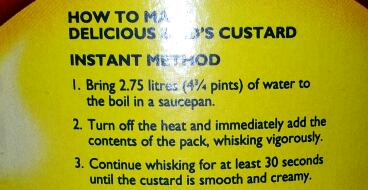
Do you think the instructions are wrong?
image

Does 2.75 litres of water seem right? Use the whole packet? How much is in the packet?

The problem
image

The custard powder had been bought from the wholesalers. It was such good value because it was a catering pack.

  • If the pack weighs 605g, how much would you need for one portion?
  • How much water would you need?
  • How could you decide if 55ml was a decent size portion?
  • How many pint jugs would the fifty-five 55ml portions fill?

If you have access to a wholesaler or talk nicely to the canteen, you will be surprised how much proportion work you can find in catering size value packs

By the way, my friend did a couple of calculations and a bit of estimating resulting in a large, but tasty, bowl of custard.

221. The ‘Average’ wage

Here’s a problem on averages that has been used by many teachers over the years. I like the additional ‘sting in the tail’ as it really makes pupils think about real life and it is an instant use of calculating the mean from an ungrouped frequency table.

hiring

Image Credit: www.vivcorecruitment.co.uk

The Problem
A job advert says that the average worker at OfficesRUs earns over £30 thousand pounds.

OfficesRUs Salaries:

  • Director   £100,000
  • Manager   £50,000
  • Sales Person   £35,000
  • Clerical Assistant   £22,000
  • Trainees   £15,000

Is the advert true?

The Discussion

If pupils calculate the mean they will find it is £44,400 – this makes the advert true

But why would a company have the same number of employees at each pay grade?

The Sting

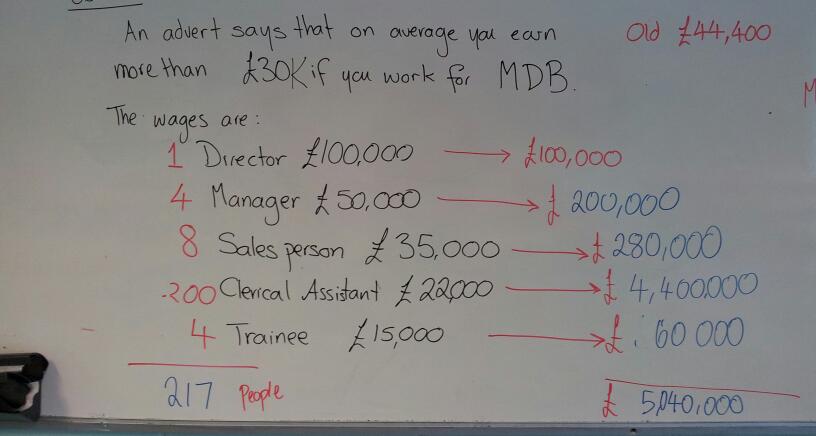
OfficesRUs is a clerical agency, offering temporary clerical staff for other businesses. Their staff numbers are:

  • 1 Director   £100,000
  • 4 Managers   £50,000
  • 8 Sales People   £35,000
  • 200 Clerical Assistants   £22,000
  • 4 Trainees   £15,000

Is the advert still true?

The Result

My class worked out how much each pay grade would get and added them to find the total salary cost. Some pupils then divided by 5, but discovered that the mean would be far greater than the Director’s salary. They then realised they had to total up the employees too. The mean turned out to be less than £30,000. This then leads to a discussion of which measure of average is best in this situation.

This is the working out from my board. The original problem is in black, with the sting and working in red. We linked the individual pay grade calculations to the work we had done on means from ungrouped frequency tables. The layout of the calculations is very similar to our tables.

image

This  was a really good investigative starter to bridge between a theory and problem solving lesson. You could get pupils to see if they can find any examples of job adverts with average salaries in and make up their own problems.


212. Crack the Code 1

I love the worksheets produced by danwalker on TES resources. Basically a set of results are combined to make a numerical code. You could have a ‘Kilner’ stye jar with a changeable combination padlock and a prize locked inside as motivation.

Image credit: www.waragainstwork.com

Image credit: www.waragainstwork.com

I’ve started using this style of activity with sleepy sixth formers, unmotivated low ability Year 10 and excitable Year 9s. Dan Walker has released the following activites on TES resources:

Parametric Equations

Binomial Expansion

Percentages

I’ve now created a Code sheet for Number Patterns. It covers term to term rules, using an Nth term rule, finding an Nth term and finding a specified term.

Number Patterns Crack the Safe (pdf)