Category Archives: Number

195. Marshmallow Maths

It’s our first birthday at the MathsSandpit and this post is party themed. Remember a few years ago, when chocolate fountains were the ‘in thing’ at celebrations and parties. The healthy guests stuck to strawberries drenched in chocolate. The unhealthy went for marshmallows on sticks and … well … all I’ll say is Geraldine Granger (Vicar of Dibley – Chocolate Fountain)

I’m trying to decompartmentalise the maths in my students heads. They struggle to see the links between different topics. So I introduced ‘Marshmalllow Maths’ – they were intrigued/hungry as soon as I mentioned it.
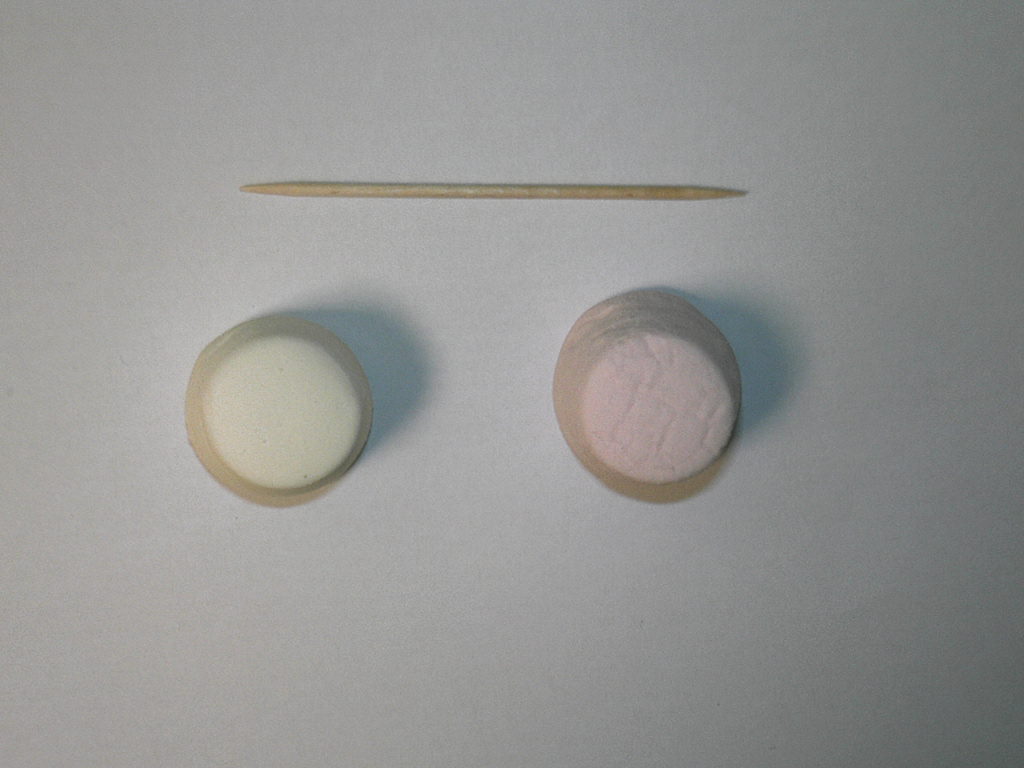
Equipment

  • Cocktail sticks
  • Pink and white marshmallows
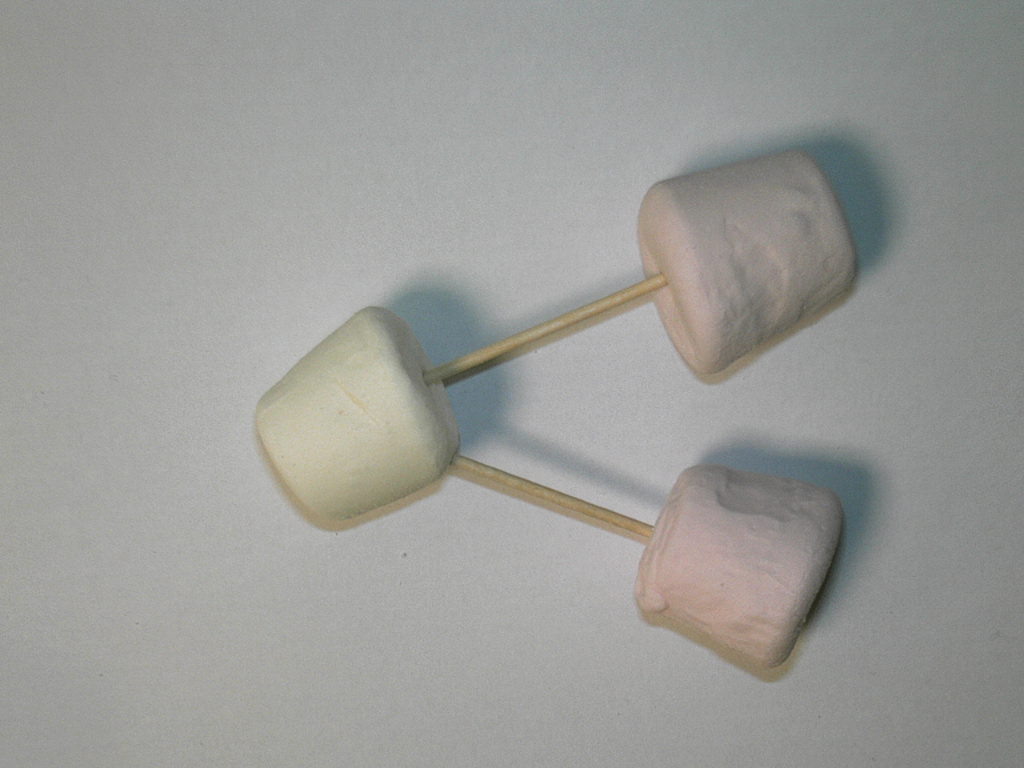
Step 1

Image

Ask your class to connect the marshmallows together


Step 2

What mathematical characteristics do the marshmallows have? I’ve summarised my classes’ responses below:

image

Two marshmallows lead to ratio, percentages, fractions, decimals and probability. The links between these topics start to emerge.

Step 3

Add on another marshmallow

Image

How have the ratios, fractions, decimals, percentages changed?


Step 4

Make another 1:2 ratio marshmallow, identical to the previous one. How have the mathematical facts changed? In fact although the numbers have changed, the proportions have stayed the same which is proved when you simplify the numbers. Physically you can prove it by stacking the structures on top of each other – from above it looks like the original structure.

At this point I went cross-curricular and discussed the similarities between the marshmallow structure and water (H20). I was going to label the marshmallows with H and O, but my food-colouring pen wasn’t working. My logic was that water always has hydrogen and oxygen in the same ratio – this means we know we can drink it. If the ratio suddenly changed to H2O2, we would be in trouble! As far as I can remember H2O2 is hydrogen peroxide and is better for bleaching than drinking. This actually got the idea across quite well – no-one tried to fudge their ratios.


Step 5

I then allowed the class to make their own simple structures using their own piles of marshmallows. They had to make at least three identical structures, work out the related maths and prove that their numbers could be simplified to the basic form. In doing so they also looked at converting ratios to fractions and also found fractions of amounts.


Step 6

Eat marshmallows (whilst doing some related questions).


Optional: Step 7

Calculate the percentage increase in body mass on results day! It was marshmallows today, a chocolate prize for cracking a code earlier in the week and they say they learn better when they eat. I think it’s all a ploy to scrounge more food … but if it works … maybe fruit next time!

190. Visual Compound interest

So you’ve reached that bit of the Number curriculum at the end of Percentages – Simple and Compound interest. The theory is straight forward enough:

  • Simple interest is calculated on the original balance.
  • Compound interest is calculated fresh every year on the current balance.

This shouldn’t be a tricky concept, yet it is frequently  glossed over or partially taught to lower ability students. This is the maths they’ll need to get their head around at the bank in a few years time. So why not replace the scary calculations and rote learning with diagrams, which embed understanding.

Equipment

  • Coloured pens
  • Whiteboard
  • Squared paper
  • Ruler
  • Calculator (Optional)

Simple Interest: Step 1

Draw a square which has sides which are a multiple of ten (I used 10×10). This area represents the original investment.

image

Step 2

Assume the interest rate is 10%. Calculate 10% of the area and shade it in lightly. Basically one column, since it’s a 10×10 grid.

image

Step 3

Add on 10% by drawing the shaded area again. This is the 1st interest payment.

image

Step 4

Repeat Step 3 for the 2nd and 3rd years.

image

Step 5

In summary, a simple interest (10%) investment over 3 years is the same as adding on 30%.

image


Compound Interest: Step 1

Repeat steps 1 -3 of simple interest

image

Step 2

Work out 10% of the height and draw a new row – since the grid is 10 squares high, it’s simply one square high.

image

Notice that the row is wider than the original square – the dotted area indicates the extra interest earned on the previous years interest. This starts the discussion that you are not adding on the same amount each time.

Step 3

Using the same concept as Step 2, work out 10% of the width of the diagram. This time the width is a little more than one square wide.

image

Once again it’s clear to see that you are adding on more than the last year.


Comparison: Simple vs Compound interest

Which is the better investment? It’s pretty clear to see:

image

You can compare these two types of interest using area calculations, rather than long lists of percentage calculations and you can actually ‘see’ the different methods.


187. Clever circles

Here is a quick, multi-function resource for you: a set of overlapping circles for angles, pie-charts and fractions/percentages.

Equipment
Card
Scissors
Pencil
Straight edge or ruler
Pair of compasses
A 360 degree protractor printed on paper (or a tracing paper protractor cut out)

Construction
1. Cut out three identical circles and the paper protractor.

image

2. Stack them on top of each other and put the pointy end of the compasses (or a drawing pin) through the middle. Wiggle it around to make a bigger hole – please don’t stab yourself.

3. Draw a radius on the circles.

image

4. Cut down each radius on the circles and the 0 degree line on the protractor.
5. All done!

Activity 1: Angle Estimation
Slot two circles together:

image

Estimate the orange angle.
What could the blue angle be?
Show me an acute angle.
Show me a blue 170 degree angle.

Activity 2: Reading a protractor scale
Slot the protractor into a circle:

image

How big is the blue angle?
Show me an 80 degree angle.

Activity 3: Pie-charts
Slot the three circles together:

image

What could this pie-chart represent?
Show me a pie chart with two equal sections

Activity 4: Fractions and percentages
Use three circles again:

image

Estimate what percentage is purple.
What fraction could the blue section represent?

186. Fantastical algebra

Have you ever played the parlour game ‘Fantastical Creatures’? Click for a lovely description and example of it by Little Cotton Rabbits.

I’ve adapted this concept for teaching aspects of number and algebra.

Topics
Basic arithmetic
Inverse operations
Order of operations
Setting up simple equations
Using brackets with numbers/letters
Solving single sided equations

Equipment
Strips of paper – one sheet of A4 makes about 6 strips
Coloured pens (optional)

Basic instructions
1. Write an instruction on the top of the strip (portrait orientation). Label it (a).

image

2. Fold over the strip twice to hide the writing. Write (b).

image

3. Pass on the strip, do not unfold it.
4. By the ‘(letter label)’, write the next instruction. The letters help you keep track of how many times it has been passed on.
5. Fold over the strip twice and put a label for the next letter of the alphabet.
6. Repeat steps 3 – 5 as required.

The beauty of this activity is that each problem is constructed by a group of pupils and they are in control of the level of difficulty.

Activity 1: Setting up simple equations

Follow the basic activities with the following instructions:
(a) I think of a number and write an instruction
(b) & (c) Now I write an instruction
(d) The answer is write a number
image

Pupils fold the puzzle up tight and either pass it on one last time or hand them in (to be randomly distributed).

Pupils unfold their mystery puzzle and construct the equation, step by step. My pupils quickly realised the importance of simplifying, but many forgot the importance of using brackets. This was a useful misconception to identify.

image

Pupils then use inverse operations to calculate the unknown.

image

The algebraic operations and numerical operations can then be compared.

image

Activity 2: Problem solving

This follows the same structure as the equation activity, but pupils are describing a geometric problem. In the examples the blue sections are up to the pupils to choose.

Example 1
image

Example 2

image

In the second example pupils can visualise the problem as well as using algebraic terms.

Activity 3: Number Skills

This activity can also be used for setting up BIDMAS problems by omitting the algebra.

182. How much flooring?

I’m sure you’ve done or heard of people using their classroom as a basis for problem solving. How much would it cost to paint/wallpaper/carpet the room?

What about the literal cost of flooring a room?

image

Image credit: Pinterest

Many people have calculated that it is cheaper to use 1 cent coins rather than buy tiles. There are many examples collected together here: Keytoflow

I think this idea could be adapted to look at different sizes of coin, areas and tessellation. Even simple circular coins can tessellate in different ways – how much does this affect the cost? This is also an open task which could lead to some great strategies and discussions.

Update
@LearningMaths suggests students could investigate the percentage area covered by different types of coin. A great extension idea!

178. Santa’s Secret

Santa’s secret is that he can get your class to revise harder topics – without them realising!

Equipment

Activity
Paper chains are made from equally sized strips of paper. Each loop is made from a strip of paper, which has one end glued to the other.

Question 1
How many 3cm by 18cm strips of paper can you cut from a sheet of A4 paper? Remember, each strip is made from one complete piece of paper.

Question 2
If each strip has an overlap of 1cm, what is the circumference of the loop made? What is the diameter?

Question 3
When two loops are attached there is an overlap of 0.5cm. How long would a chain of 12 loops be?
Hint: two loops with diameter 4cm would have a combined length of (4+4-0.5)cm = 7.5cm.

Question 4
A room has dimensions 5m by 7m. How far is it diagonally across the room?

Question 5
How many loops would a paper chain have if it reached diagonally across the room?

Extension
To make the chain hang in U shape, rather than stretching flat across the ceiling, 5 extra loops are added per whole metre of chain. How long would the chain diagonally across the room be? How many loops?

Challenge
How many sheets of paper would be required to make enough paper chain to hang in a U shape joining every corner of the room?