Hey … it’s that time of year again! Baubles and cheesy jumpers are creeping into the most mundane of places. How about a more mathematical festive season?
Image credit: http://technabob.com/blog/
Here is a round up of the Sandpit’s Christmas resources:
The proofs for these rules are relatively simple, but getting a class of teenagers to engage with it is a different matter! These worksheets give you the proofs, step by step, but all jumbled up. Students must rearrange the stages in order to create a proof. It worked brilliantly!
I have recently been teaching lower ability Year 9 students how to calculate the mean from grouped and ungrouped data tables. I didn’t want to teach them a method to learn by rote, so I used a more investigative approach.
The second table had more information covered up. After a discussion the groups decided there wasn’t enough information and they would have to guess what the missing numbers were.
The third table had minimal information. Each group used their own method to find the missing values. Some chose the largest value in the range, some guessed what the results could have been in each group and one group decided to calculate two means – one using the largest value and one using the smallest.
We collected our results together on the board and discussed their accuracy. The class decided to use the middle of each range to calculate the estimated mean. They had gone from no understanding of estimated mean to formulating their own method.
Are you fed up of explaining the difference between a histogram and a bar graph/chart?
Cheer up! Help is at hand…
I teach a class of bright students with very little self-belief in their abilities and total fear of leaving their comfort zone. Instead of telling them what to do and set page X of textbook Y, I let them tell me what was going on and let them take small steps. After all, you wouldn’t take a beginner climber up the North face of the Eiger, would you?
First I gave the students individual time to write down what they observed. They then compared their answers in pairs/threes. Finally, I collected their observations together on the board (where I had projected up the comparison worksheet).
This hands on approach allowed the students to understand how a histogram is constructed. There were fewer students thinking that histograms are just bar-charts where the bars touch.
This worksheet allows students to get the feel for calculating frequency densities without stress. The instructions are gradually removed, until students are just working from a data source. Then students practise drawing histograms.
It is also a handy revision resource – my students referred back to this worksheet when they were stuck in subsequent lessons, rather than ask me!
Here’s a quick post for all those of you teaching Arithmetic Sequences. Whether you are teaching Level 3 Algebra or the C1 A-Level module, the jump from GCSE Nth term to the form ‘a + (n-1)d’ can be unnecessarily tricky. To help with this I’ve written a starter booklet for Arithmetic Sequences. You can download it here:
By the way, if your students confuse the vocabulary ‘sequence’ with ‘series’ get them to think about television. A normal television series ends, so an arithmetic series must end too!
There are assorted holidays coming up and the weather is getting grim. Time to put your feet up and exercise your brain.
If you like killer Sudokus, logic problems and applied Maths, you’ll love this book. It follows the adventures of Dorothy Gale as she battles her wits against Dr Oz in her journey through the alien world of Oz. The problems are graded so you can work your way up to the harder questions.
I have used problems from this book with all ages of senior school student from able Year 8 to Further Maths A-level students. A word of warning though – check the difficulty level before you let students loose on the problems!
Whether you are on half term holiday this week or next, I’m sure you’ll have time for this little number skills starter.
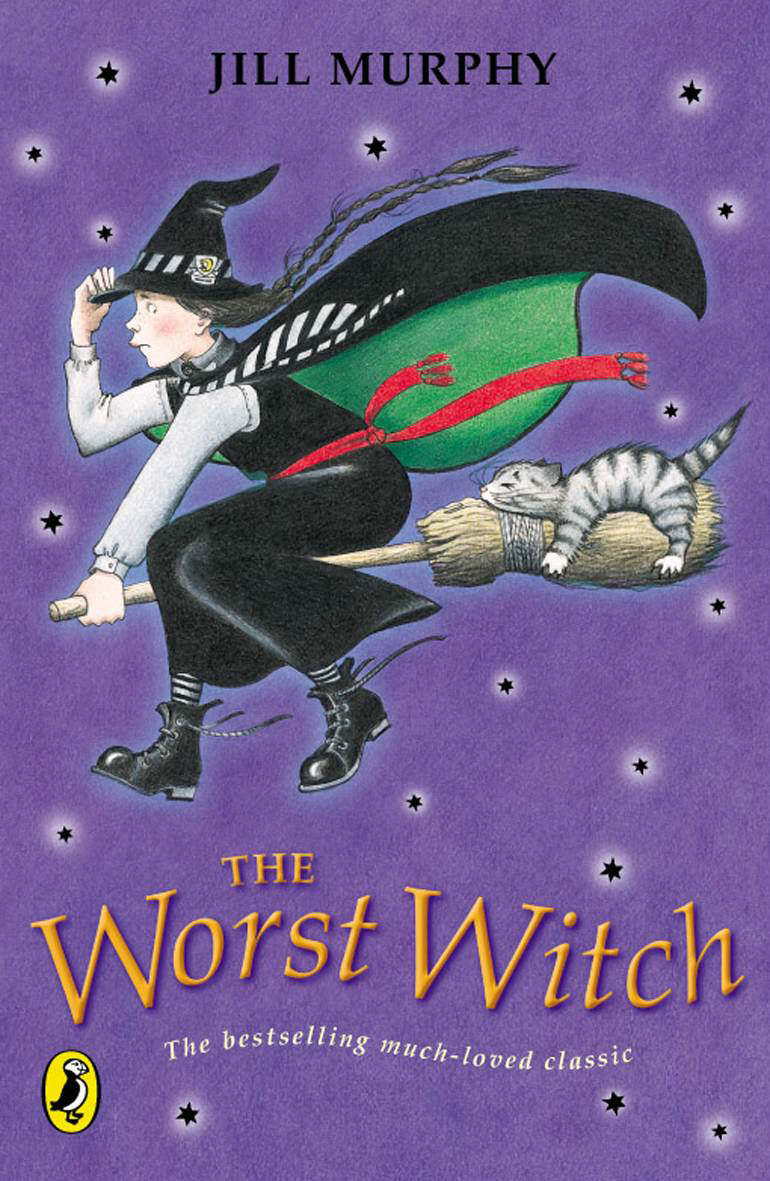
Image Credit: Jill Murphy, ‘The Worst Witch’ – a children’s classic, which I highly recommend.
Can you help Wanda, the Grand High Witch, to find the local reporter hiding at her Halloween Girls Night Out? Solve the number problems and unveil the imposter.