Category Archives: Resource

191. Fallen Revision

Which Maths teachers out there are fed up of stressing the same basic exam/test skills? Come on, there must be more than that? You there at the back. That’s more like it!

Unfortunately, us teachers don’t understand student basics:

* Pencils are for chewing, flicking or breaking.
* Rulers are for poking and twanging
* Working out is detrimental to doodling time
* And as for Units – wasn’t that mentioned in PSCHE to do with alcohol?

Sound familiar?

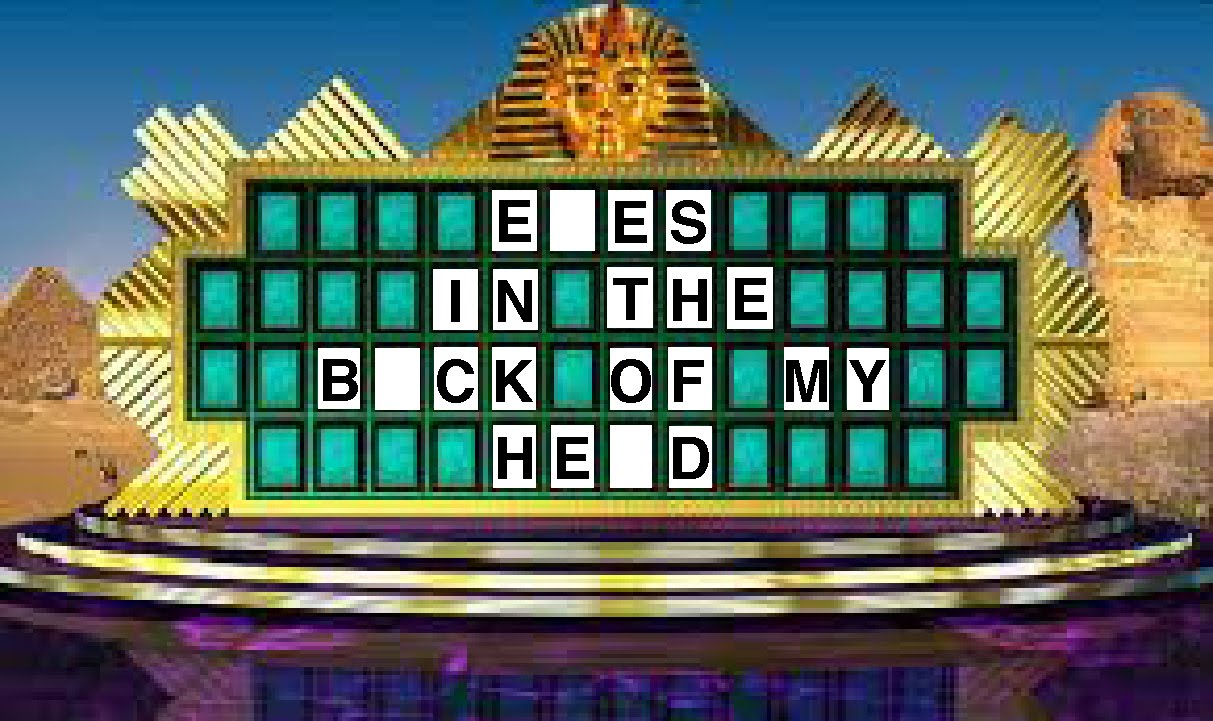
This term I’ve made my class reflect on the basics using a ‘Fallen Phrase’ puzzle template from Discovery Puzzlemaker. The skeleton of the phrase is given, but the missing letters are stacked at the bottom of each column – a bit like a collapsed ‘Wheel of fortune’ puzzle.

Wheel of fortune

The puzzle covers all the basic skills, but it is difficult. My students had to really think what I nag them about, rather than just rearrange the letters.

I just hope all their hard work pays off in their test.

Revision Hints fallen phrase.

Visit the Discovery puzzlemaker site.

188. Top Teachmeet Trumps Resource


I’m currently trying out ideas from the #mathsmeetnorthwest TeachMeet. Emma Weston did an excellent presentation on ‘Marking for motivation and progress’. She inspired me to look for a Top Trumps activity for my class – they needed some consolidation of solving equations with an unknown on each side and with brackets. I found this brilliant solving equations Top Trumps by Dusher on TES resources.

The Marvel comic themed algebra cards have three tiers of difficulty and went down a storm. My class would have happily played all lesson, if I had let them.


Who would have thought that equations could be so engaging?

187. Clever circles

Here is a quick, multi-function resource for you: a set of overlapping circles for angles, pie-charts and fractions/percentages.

Equipment
Card
Scissors
Pencil
Straight edge or ruler
Pair of compasses
A 360 degree protractor printed on paper (or a tracing paper protractor cut out)

Construction
1. Cut out three identical circles and the paper protractor.

image

2. Stack them on top of each other and put the pointy end of the compasses (or a drawing pin) through the middle. Wiggle it around to make a bigger hole – please don’t stab yourself.

3. Draw a radius on the circles.

image

4. Cut down each radius on the circles and the 0 degree line on the protractor.
5. All done!

Activity 1: Angle Estimation
Slot two circles together:

image

Estimate the orange angle.
What could the blue angle be?
Show me an acute angle.
Show me a blue 170 degree angle.

Activity 2: Reading a protractor scale
Slot the protractor into a circle:

image

How big is the blue angle?
Show me an 80 degree angle.

Activity 3: Pie-charts
Slot the three circles together:

image

What could this pie-chart represent?
Show me a pie chart with two equal sections

Activity 4: Fractions and percentages
Use three circles again:

image

Estimate what percentage is purple.
What fraction could the blue section represent?

185. I’ve lost a Dime


I haven’t actually lost a dime, rather I’m missing a Dime – specifically the second Dime probability pack. It was a great teaching resource for experimental probability from the first school I taught at. Unfortunately it is no longer available, although it is listed on the Tarquin archive site. Each student had a plastic tube with different coloured beads, a related experiment card and a record card. They could investigate the meanings of key vocabulary, carry out repeated trials and use this amazing graph paper, designed by Geoff Giles, to record results:

image

The graph paper works a little like a bagatelle or pinball machine. You start at the top ‘pin’. A success means move along the line to the next pin on the right, a fail means move to the left. You always move in a downwards direction. The more trials that are recorded, the further down you go. When you reach the bottom you will have carried out 50 trials and will be able to read off the experimental probability as a decimal. I found this blog (medianchoices of ict) with links to the Nrich website and interactive probability graphs. The graph paper from the Nrich site is here: RecordSheet.


Activity

I decided to recreate the old Dime investigation sheets:
image

Students start by explaining what their experiment is and define what is a success/fail. They give the theoretical probability as a fraction and decimal, then predict the number of successes in 100 trials.


Students then carry out their experiment, recording their results in the tally chart and graph. After 50 trials, they write down the fractional experimental probability of success using the tally total and the decimal probability from the graph – hopefully they are the same! Students then reflect on their work and consider how to improve their results.

Download the worksheet here: Experimental Probability investigation

Sample

image

182. Chrismaths 12

On the twelfth day of Christmas Maths Sandpit gave to me .. some Time Lords a-leapfrogging!

Image credit: blastr.com

Download the poster: On the twelfth day of Christmas


As you’ve been downloading the posters, you’ll have noticed I haven’t strictly kept to the verses of ‘The Twelve days of Christmas’. However, if you do a little bit of research you’ll find that the verses have changed since 1780 and around the world there are variations. The lost verses include ’11 badgers baiting’, ’12 bells a ringing’, ‘8 hounds a running’ and ‘9 bears a beating’!

180. Chrismaths 11

On the eleventh day of Christmas the Muppets gave to me …

image

Image credit: The Muppets

Download the poster: On the eleventh day of Christmas


Hint: There are 10 types of people in the world – those who understand __ __ __ __ __ __ and those who don’t.