Category Archives: Problem Solving

236. An Emerald Adventure

There are assorted holidays coming up and the weather is getting grim. Time to put your feet up and exercise your brain.

Mathematics of Oz

If you like killer Sudokus, logic problems and applied Maths, you’ll love this book. It follows the adventures of Dorothy Gale as she battles her wits against Dr Oz in her journey through the alien world of Oz. The problems are graded so you can work your way up to the harder questions.

You can download a free sample here: Cambridge Press

Buy on Amazon (UK)

I have used problems from this book with all ages of senior school student from able Year 8 to Further Maths A-level students. A word of warning though – check the difficulty level before you let students loose on the problems!

233. Stealthy Cone Investigation

I like to encourage students to discover rules and formulae for themselves. It’s important that students understand where the maths comes from so they can apply their skills effectively. They also don’t have to rely on remembering a rule (which they may forget when they are stressed).

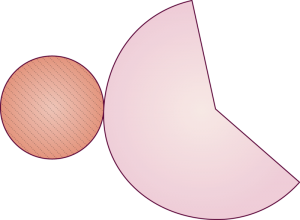
net of a cone

Image credit: http://www.ck12.org/geometry/Surface-Area-and-Volume-of-Cones/

This resource is a neat and effective way to investigate the surface area of a cone through measuring circles and creating a 3D shape. Students get a physical feel for how the dimensions fit together. Throughout the lesson I let students choose their degree of accuracy in cutting, measuring and calculating. Of course, when we discussed the ‘solution’ at the end of the session it was impossible for me to put one correct answer on the board. So I generalised using a and b for the radii – explaining that everyone could check their method in general terms. The lovely ‘penny drop’ moment happened when my a’s and b’s suddenly became a general rule. I’d conned the class into using algebra because of the accuracy issue.

Download the worksheet and answers here: Surface_area_of_a_cone

Hint: Copying onto coloured paper or card makes this activity stand out in their notes.

230. Resource of the week

I came across this splendid resource on Similar Triangles, by cturner16, on the TES website:
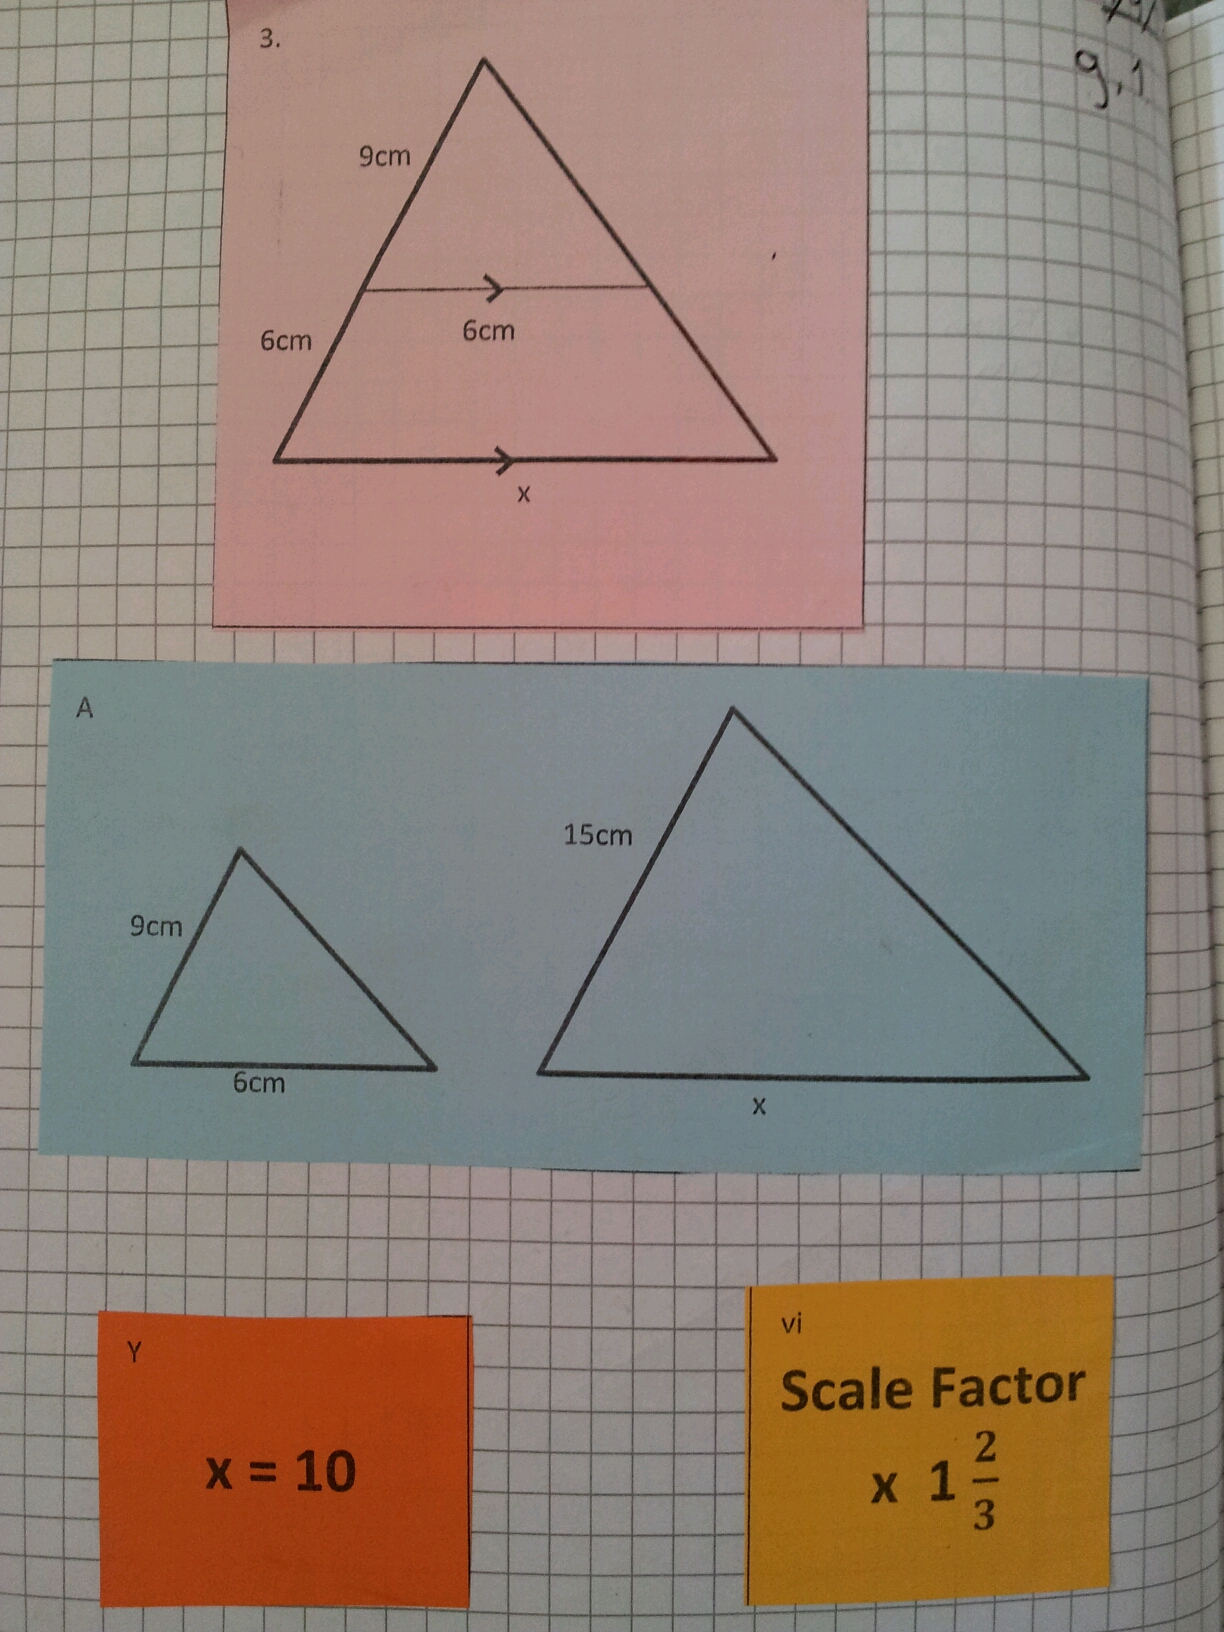
Similar triangles matching activity

The cards start with a standard diagram of overlapping triangles and you match it up with the individual triangles. The final step is to work out the scale factor and the missing side. It follows the exact steps you would want students to follow when working on these problems.

Now, I know my class well and to avoid the standard bickering, mess and ‘I didn’t think you meant pick up every sheet when you said pick up every sheet’, I copied every set on a different colour:

image

The colour made it so much easier to manage and discuss. There are six problems, so if your students work in 2’s or 3’s, they each get 3 or 2 sets to stick in their book. The problems are full of misconceptions and interesting scale factors. I’m really glad I used it!

Thank you cturner16!

229. Speed Camera Maths

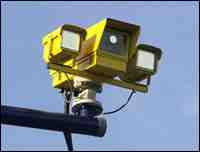
Speed Cameras are so last century: discerning law enforcement agencies favour the Average Speed Camera!

image

These motorway delights timestamp when you go through certain checkpoints and calculate your speed between them. No complicated laser guns required, just number plate recognition and a little distance/time calculation. This already sounds like a KS3/4 class activity or a Mechanics A-Level starter.

Equipment
Squared paper
Pencil
Ruler
Coloured pens
Calculator (optional)

Question
Can you find three different (safe) strategies for staying on the right side of the law through extended roadworks? You must average 40mph over 12 miles (original speed limit 60mph).

Visual Prompt
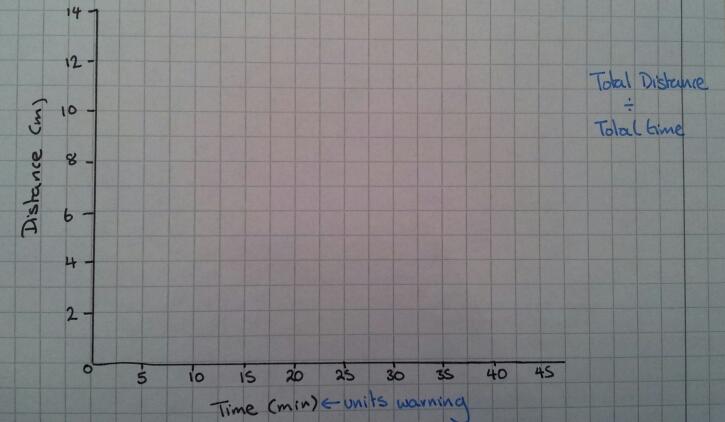
To start off with just draw out blank axes and discuss how you could visually represent this problem.

Idea 1
A distance-time graph

image

Idea 2
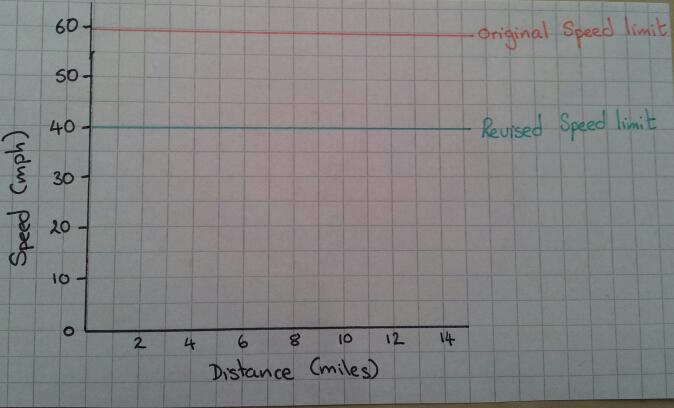
A speed-distance graph

image

Idea 3
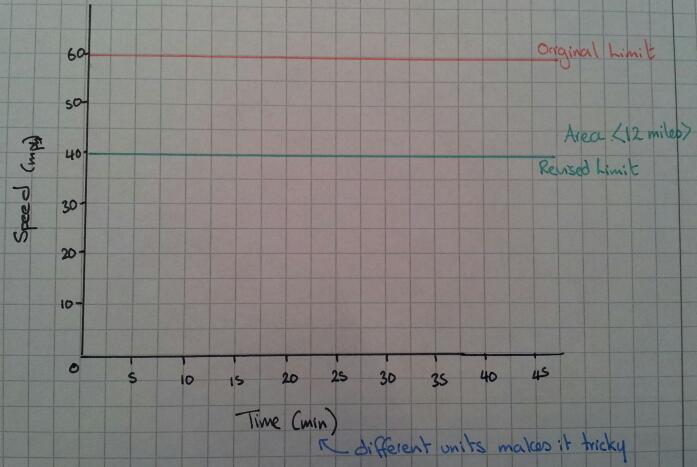
A speed-time graph

image

The straightforward option
How long should it take you to get through the roadworks if you stick to exactly 40mph? What does this look like on a graph? Which type of graph shows this information best?

Top Gear Alert
The boy racer wants to go fast, but avoid a ticket – what could he do?

Hint
What does ‘Average Speed’ actually mean?
Can you instantly jump between speeds?
Is acceleration going to effect your calculations?
What assumptions should you make about acceleration?
Do you need to work out the area under the graph or the gradient at all? How will you do this?
Can you describe what is going on?
Is it safe/legal?

Outcome
Your students should be able to produce many different graphs of how to stay on the right side of an average speed zone. They should be able discuss their findings with each other. However the morality or safety of their driving ideas may be a topic of discussion for a later PSE lesson …

225. Surveying the Monkeys

Designing good survey questions is an excellent way to discuss bias and structure, however carrying out the survey is always the tricky bit.

  • Do you ask the class next door? Always seems more of a social exercise than work
  • Do you set it as homework? Bit hit and miss: mum, dad, nan, dog & a couple of fictional people
  • Do you survey your form? Will they take it seriously?

No matter how you do it, the results are always sparse and barely useable for a data processing task. How can you get a reasonable data set, generated by pupils, for pupils to use?

I’ve mentioned SurveyMonkey in a previous blog post. It is an online data collection tool with free and subscription services.  I asked my Year 9 pupils to write five themed questions, which I then typed into SurveyMonkey. Each set of questions was on a separate page.

image


I then used our home/school communication system to email a link to the survey to every pupil in their year group, with a covering email. You could distribute the link by asking your fellow maths teachers to tell their classes.

I set the first page of the survey as a list of maths teachers. When my class did the survey they were taken to a class list which they ticked off their name and then did the survey. All other classes were taken straight to the survey. In this way the survey results are anonymous, but I know whether my class have completed it (this was their homework). After two weeks we had 100 completed surveys, out of about 200 pupils. This is an amazing completion rate!

While the data was being collected we looked at data processing skills that would be necessary to collate and process the results. The image below is a sample of the collected data printed from Excel.


image

After the results were in I printed out a copy of each set of questions and an Excel spreadsheet of their survey results for each group. The themes chosen were: Movies, Music, Shopping, Animals & Sport.
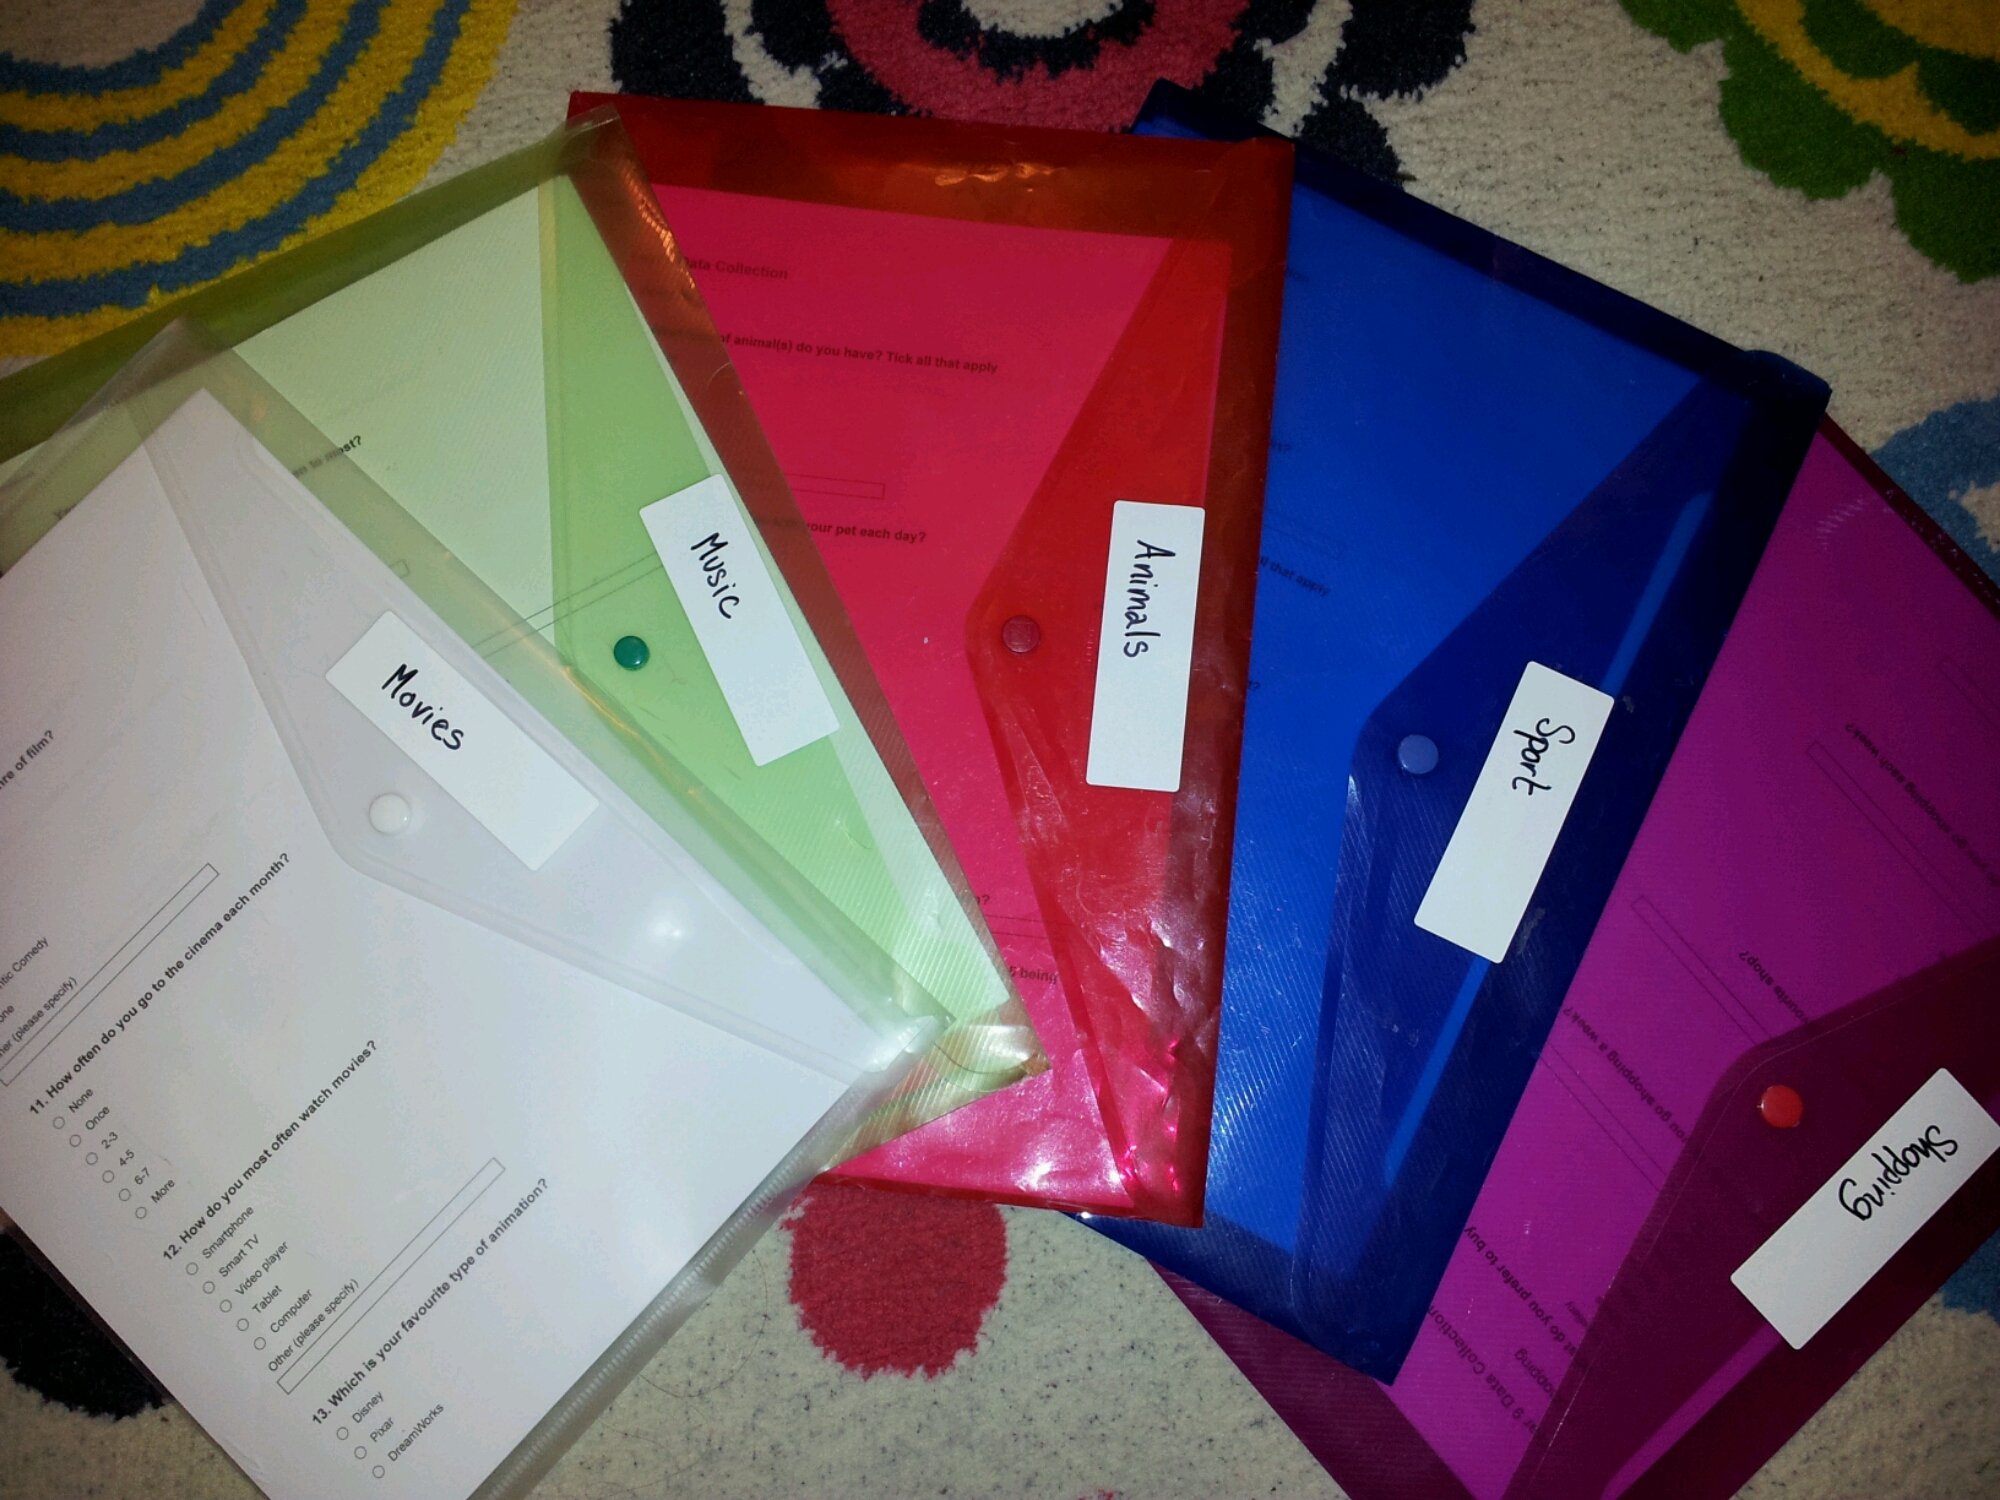
image

It’s now time for my class to report back on their theme, after dealing with a large data set with anomalies and relate it to their year group. When they have finished I will add a picture of their wall displays. I’m looking forward to seeing how they develop their ideas.

224. No Nonsense Negatives

Ever had a simple idea for a starter which your class just flies with? It happened today for me:

Background
In the previous lesson students understood the meaning of ‘y=mx+c’, but struggled to rearrange equations in this form. With this in mind, I went back to the basics of manipulating calculations.

Starter question 1
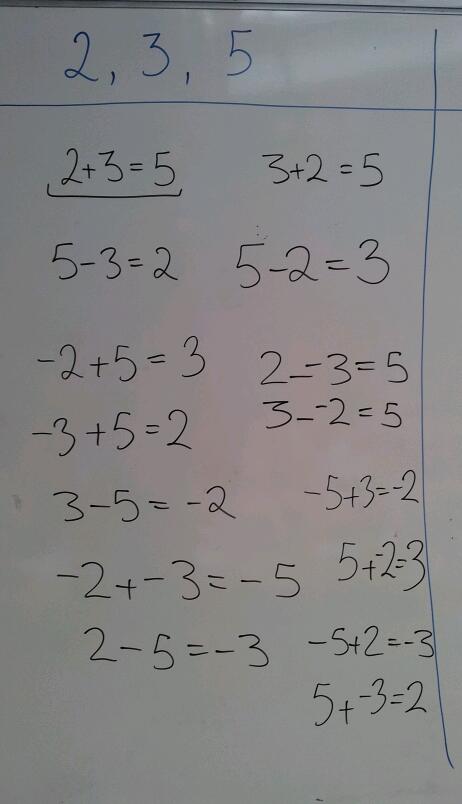
Make as many calculations as you can only using the numbers 2, 3 & 5 (once each) and any symbol you like. The obvious answer is 2+3=5.

Starter question 2
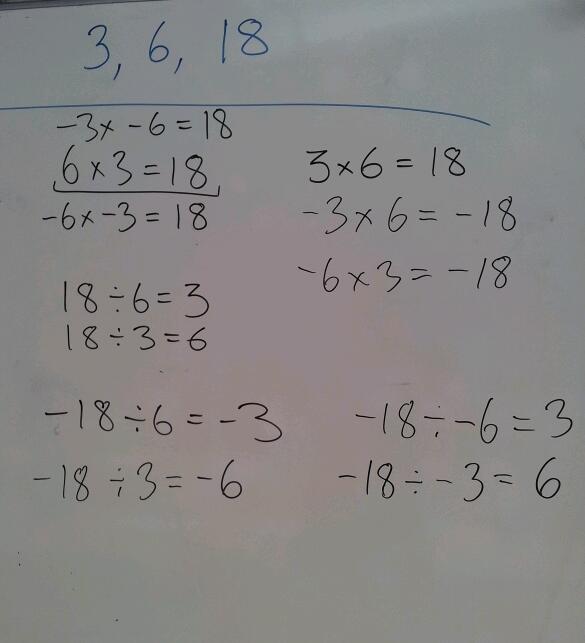
Make as many calculations as you can only using the numbers 3, 6 & 18 (once each) and any symbol you like. The obvious answer is 3×6=18.

The Extension
Most groups quickly found three solutions for each question. Some even used inequalities. To extend their understanding I suggested that they could use as many of each symbol as they wished – would a sprinkling of minus signs increase the number of results?

Results
The following pictures show the ideas my class came up with. I was using lolly sticks to randomly pick students and no one wanted to be the first to not give an answer.
image

Followed by:
image

We discussed the rearrangements and linked them to rearranging equations. They appreciated that one equation could be written in many different ways. This activity would work equally well to consolidate negative numbers.

223. Let them eat custard!

This post isn’t a resource, more of a source of ideas. We tell students that maths is about problem solving, but how many problems are fictitious?
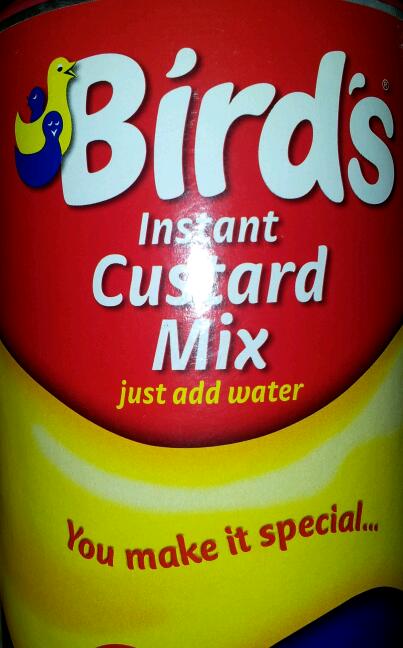
image

Here is a problem, taken directly from ‘real life’ when a friend was making custard on sunday evening.

The question
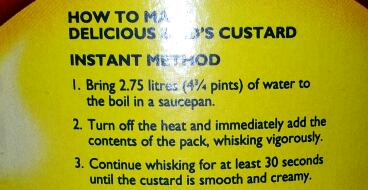
Do you think the instructions are wrong?
image

Does 2.75 litres of water seem right? Use the whole packet? How much is in the packet?

The problem
image

The custard powder had been bought from the wholesalers. It was such good value because it was a catering pack.

  • If the pack weighs 605g, how much would you need for one portion?
  • How much water would you need?
  • How could you decide if 55ml was a decent size portion?
  • How many pint jugs would the fifty-five 55ml portions fill?

If you have access to a wholesaler or talk nicely to the canteen, you will be surprised how much proportion work you can find in catering size value packs

By the way, my friend did a couple of calculations and a bit of estimating resulting in a large, but tasty, bowl of custard.