Category Archives: Problem Solving

190. Visual Compound interest

So you’ve reached that bit of the Number curriculum at the end of Percentages – Simple and Compound interest. The theory is straight forward enough:

  • Simple interest is calculated on the original balance.
  • Compound interest is calculated fresh every year on the current balance.

This shouldn’t be a tricky concept, yet it is frequently  glossed over or partially taught to lower ability students. This is the maths they’ll need to get their head around at the bank in a few years time. So why not replace the scary calculations and rote learning with diagrams, which embed understanding.

Equipment

  • Coloured pens
  • Whiteboard
  • Squared paper
  • Ruler
  • Calculator (Optional)

Simple Interest: Step 1

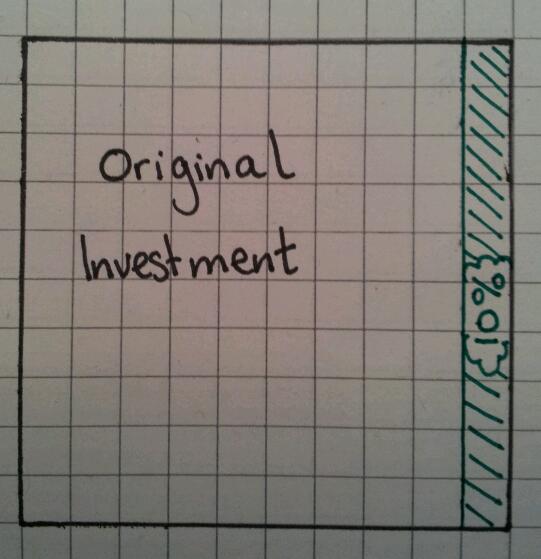
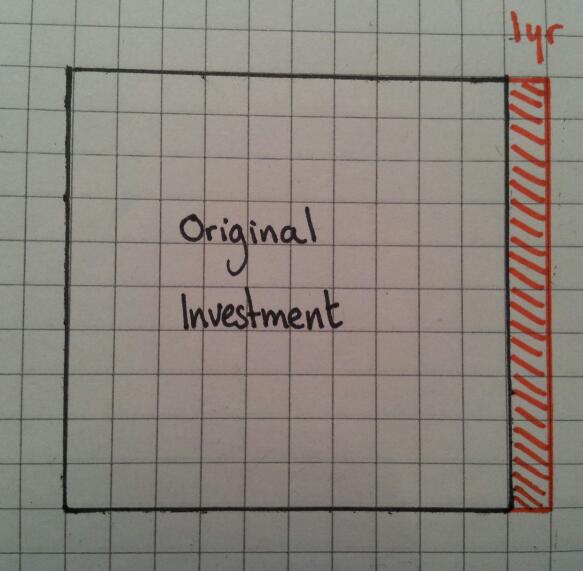
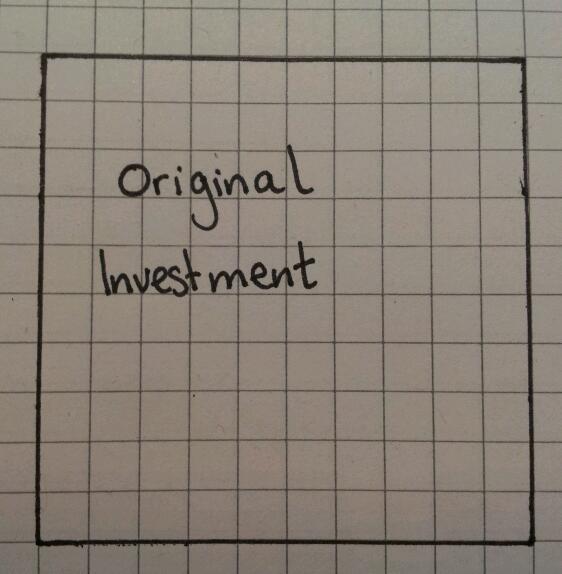
Draw a square which has sides which are a multiple of ten (I used 10×10). This area represents the original investment.

image

Step 2

Assume the interest rate is 10%. Calculate 10% of the area and shade it in lightly. Basically one column, since it’s a 10×10 grid.

image

Step 3

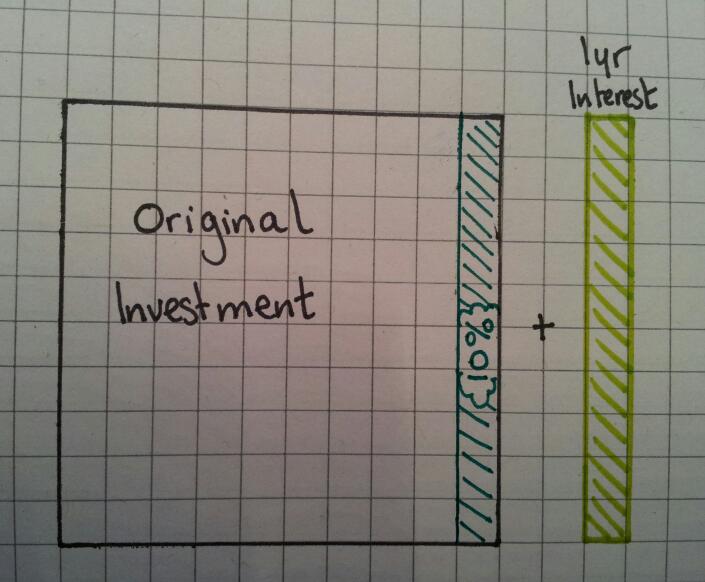
Add on 10% by drawing the shaded area again. This is the 1st interest payment.

image

Step 4

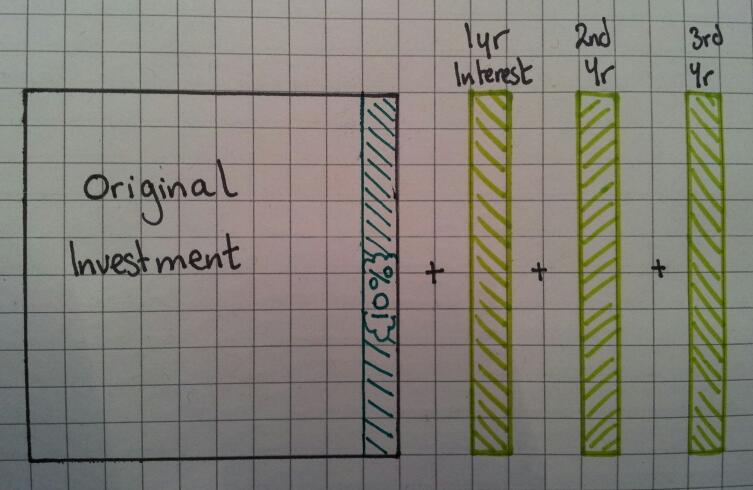
Repeat Step 3 for the 2nd and 3rd years.

image

Step 5

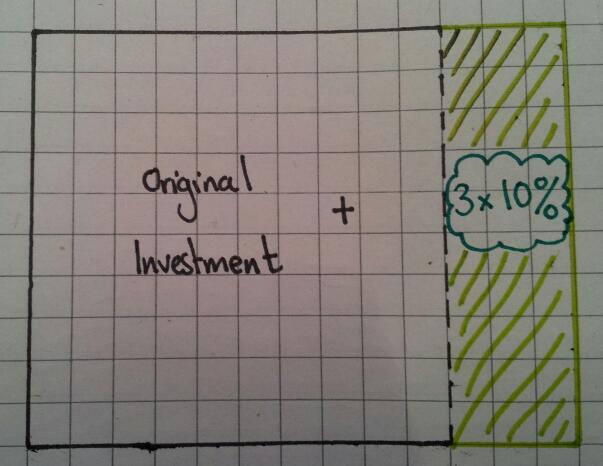
In summary, a simple interest (10%) investment over 3 years is the same as adding on 30%.

image


Compound Interest: Step 1

Repeat steps 1 -3 of simple interest

image

Step 2

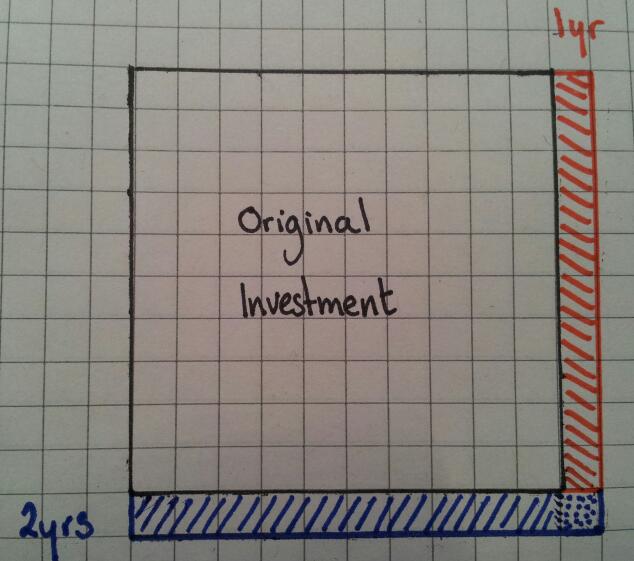
Work out 10% of the height and draw a new row – since the grid is 10 squares high, it’s simply one square high.

image

Notice that the row is wider than the original square – the dotted area indicates the extra interest earned on the previous years interest. This starts the discussion that you are not adding on the same amount each time.

Step 3

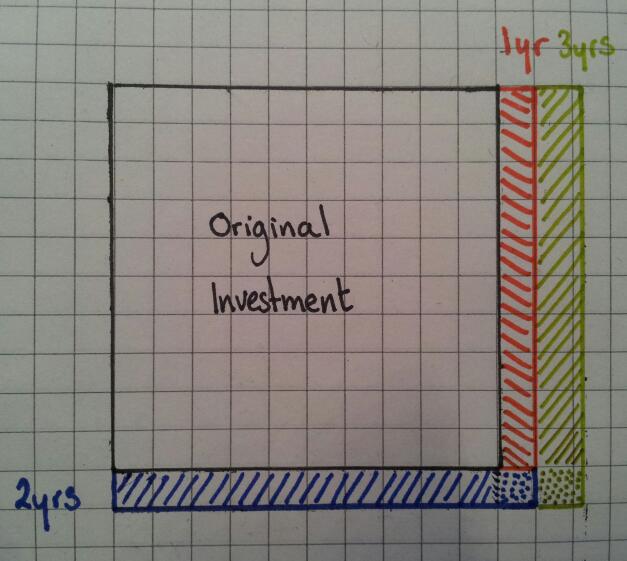
Using the same concept as Step 2, work out 10% of the width of the diagram. This time the width is a little more than one square wide.

image

Once again it’s clear to see that you are adding on more than the last year.


Comparison: Simple vs Compound interest

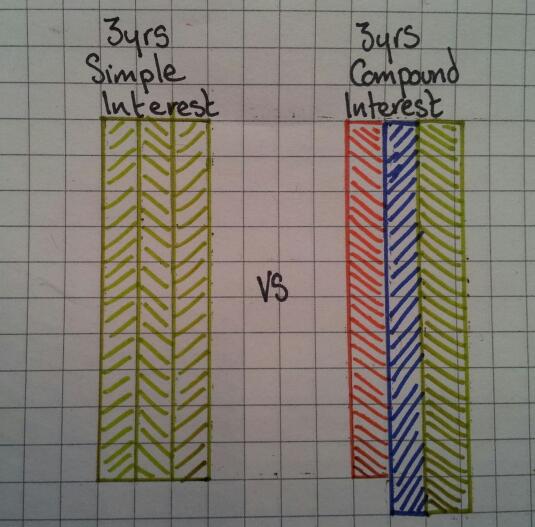
Which is the better investment? It’s pretty clear to see:

image

You can compare these two types of interest using area calculations, rather than long lists of percentage calculations and you can actually ‘see’ the different methods.



188. Ducks, chalk and gravity

So how did TeachMeet result in me standing in a supermarket one evening doing a price comparison of duct tape?

Let us go back in time to #mathsmeetnorthwest. Dave Usher did a brilliant presentation on ‘Big Maths’, including the use of gaffer (duct) tape in lessons. I thought this was a genius idea – sticky, sturdy and temporary. I didn’t get a chance to buy any at the weekend, so I ended up in the supermarket on a weeknight.

But what to buy?

Cheap own brand duct tape at £2.95 for 15m or branded ‘Duck’ tape at £3.95 for 25m?

I started school the next day with one idea on how to use it, which quickly developed into three..

Lesson 1: Averages

Equipment: Duct tape, liquid chalk marker

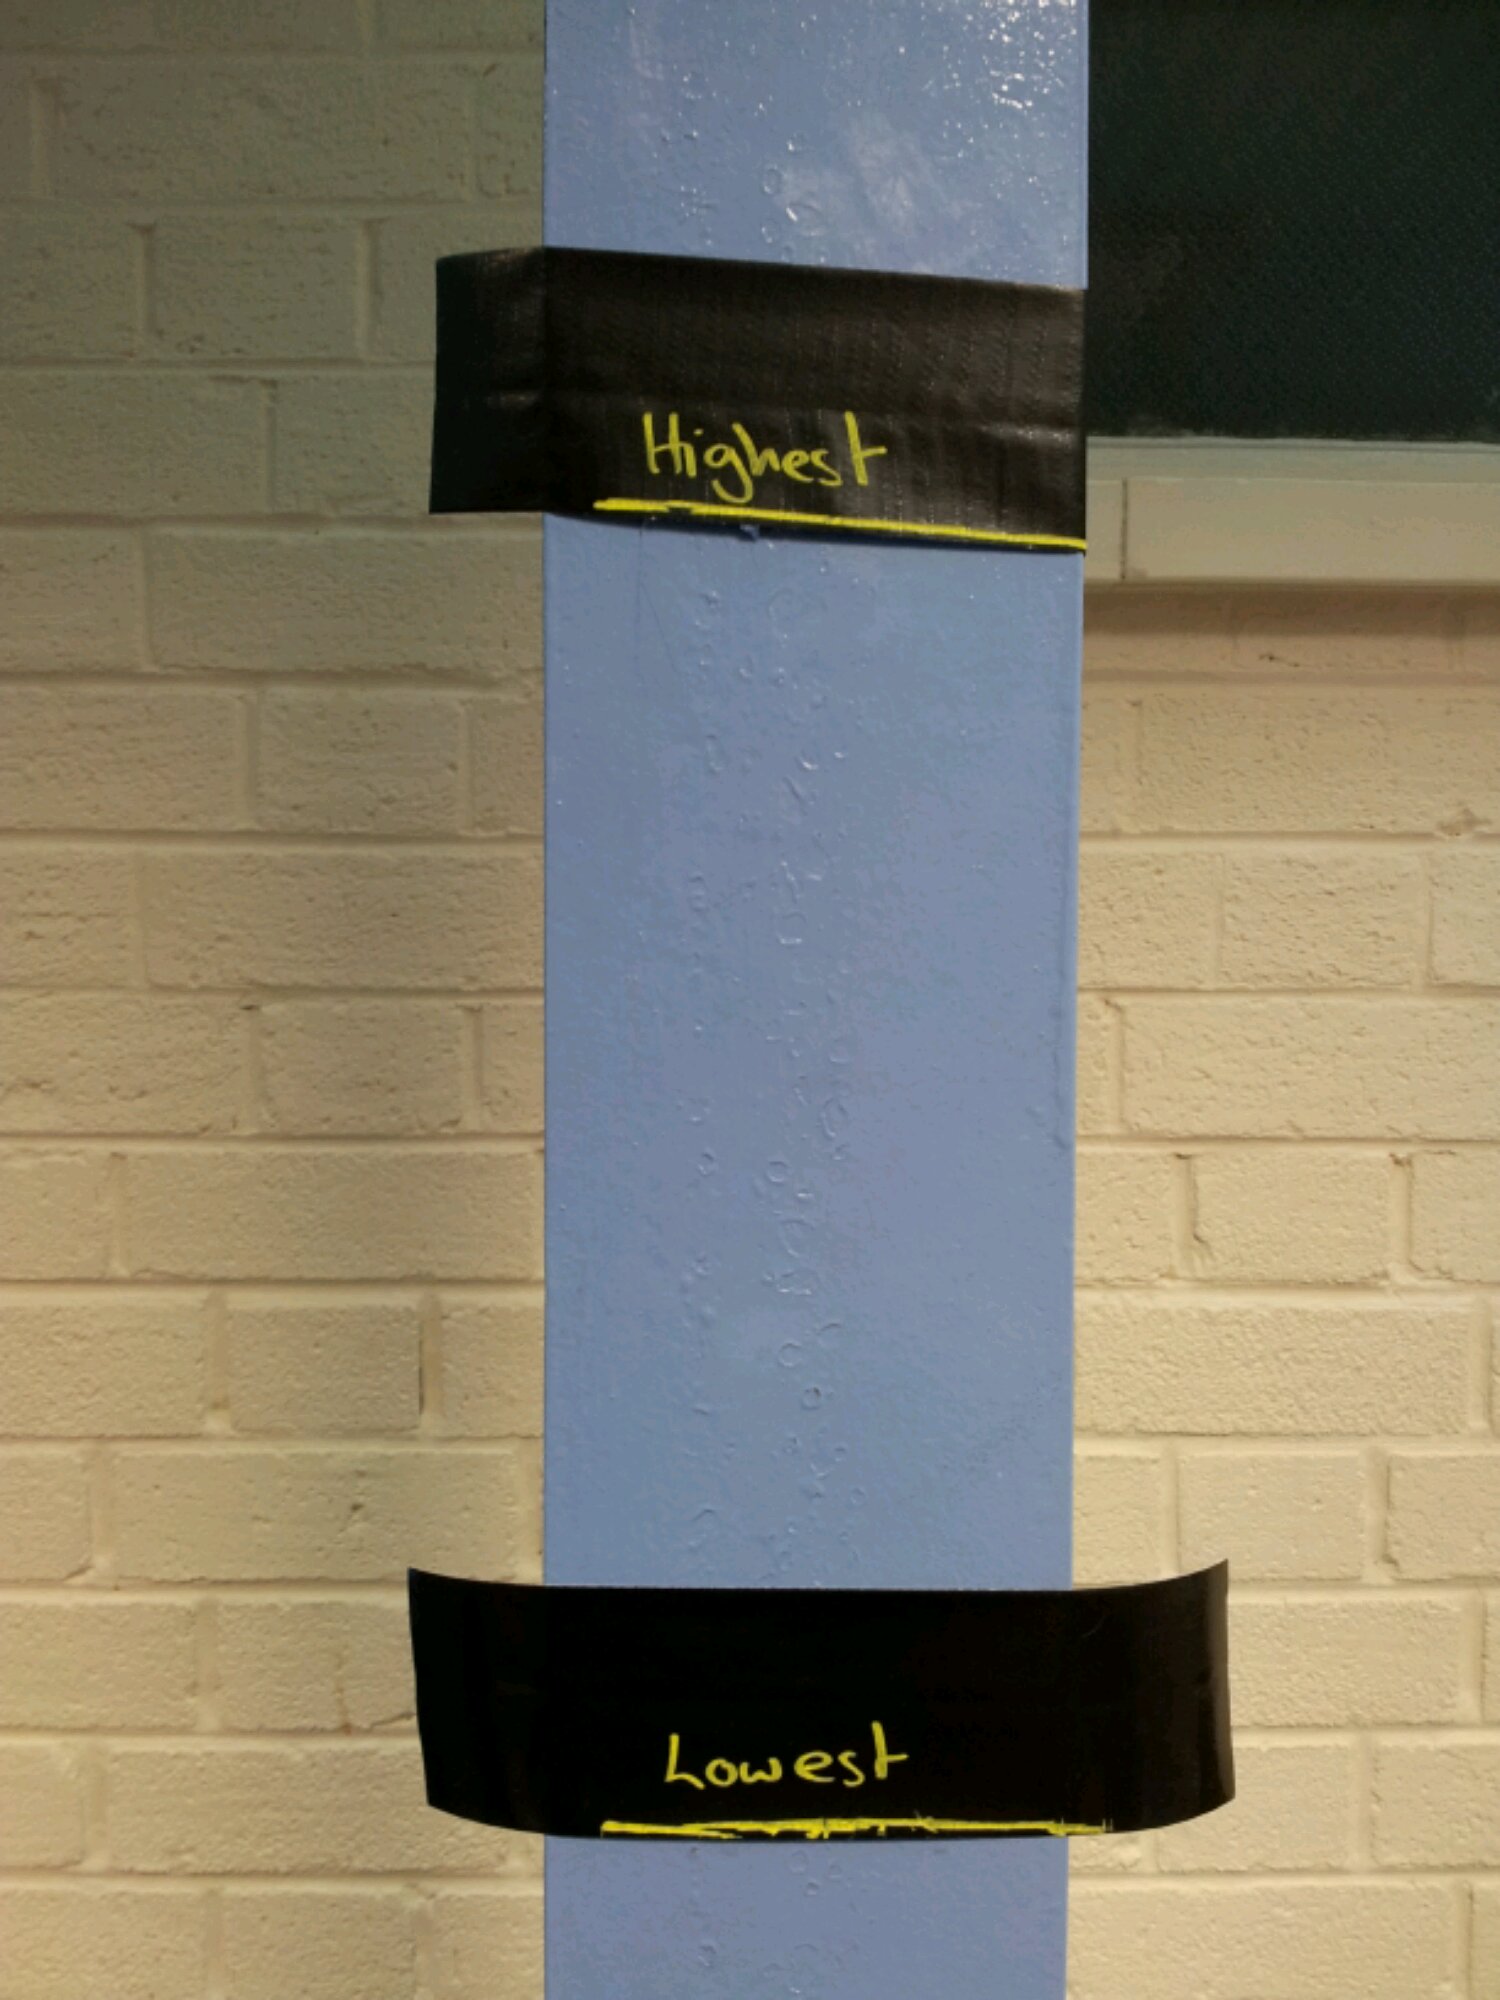
I did averages and range indoors. This meant I couldn’t chalk the walls or floor. However I could mark out key features with tape. I used the activity Averages and marked out the median, the highest and lowest values on the floor. It was at this point I figured out I could write on black duct tape with liquid chalk marker – brilliant! We labelled the wall with the highest and lowest heights of the class so we could see the actual range of heights.

image


Lesson 2: GCSE Revision

Equipment: Exam papers, scissors, glue, wall paper, duct tape

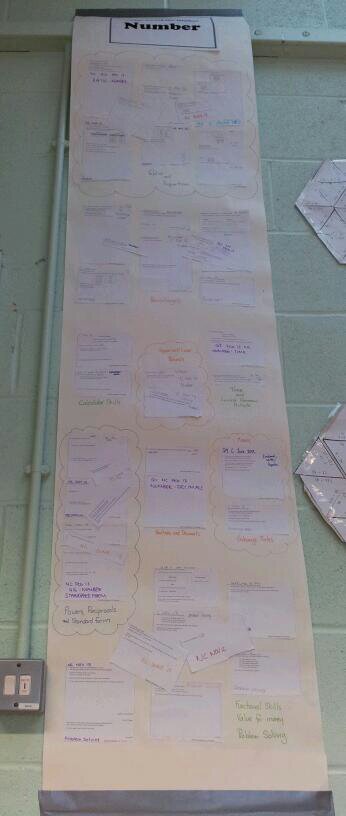
I have been using the Foundation GCSE Review with my Higher GCSE resit group. Reviewing ten Higher GCSE papers involves over 200 questions – that’s a big wall display! Both of the TeachMeets I have attended have used the idea of learning wallpaper. So that’s what we used – I’m grateful that some of my students are over 6ft tall or the wall display wouldn’t have gone up.

image

Now the duct tape was used to secure the top of the wall display and to ‘passer-by’ proof the bottom. It should last longer now that the lower end is reinforced.

image


Lesson 3: A-Level Mechanics

Equipment: Duct tape, liquid chalk, mobile phones, calculators, soft ball (I used a ball of wool)

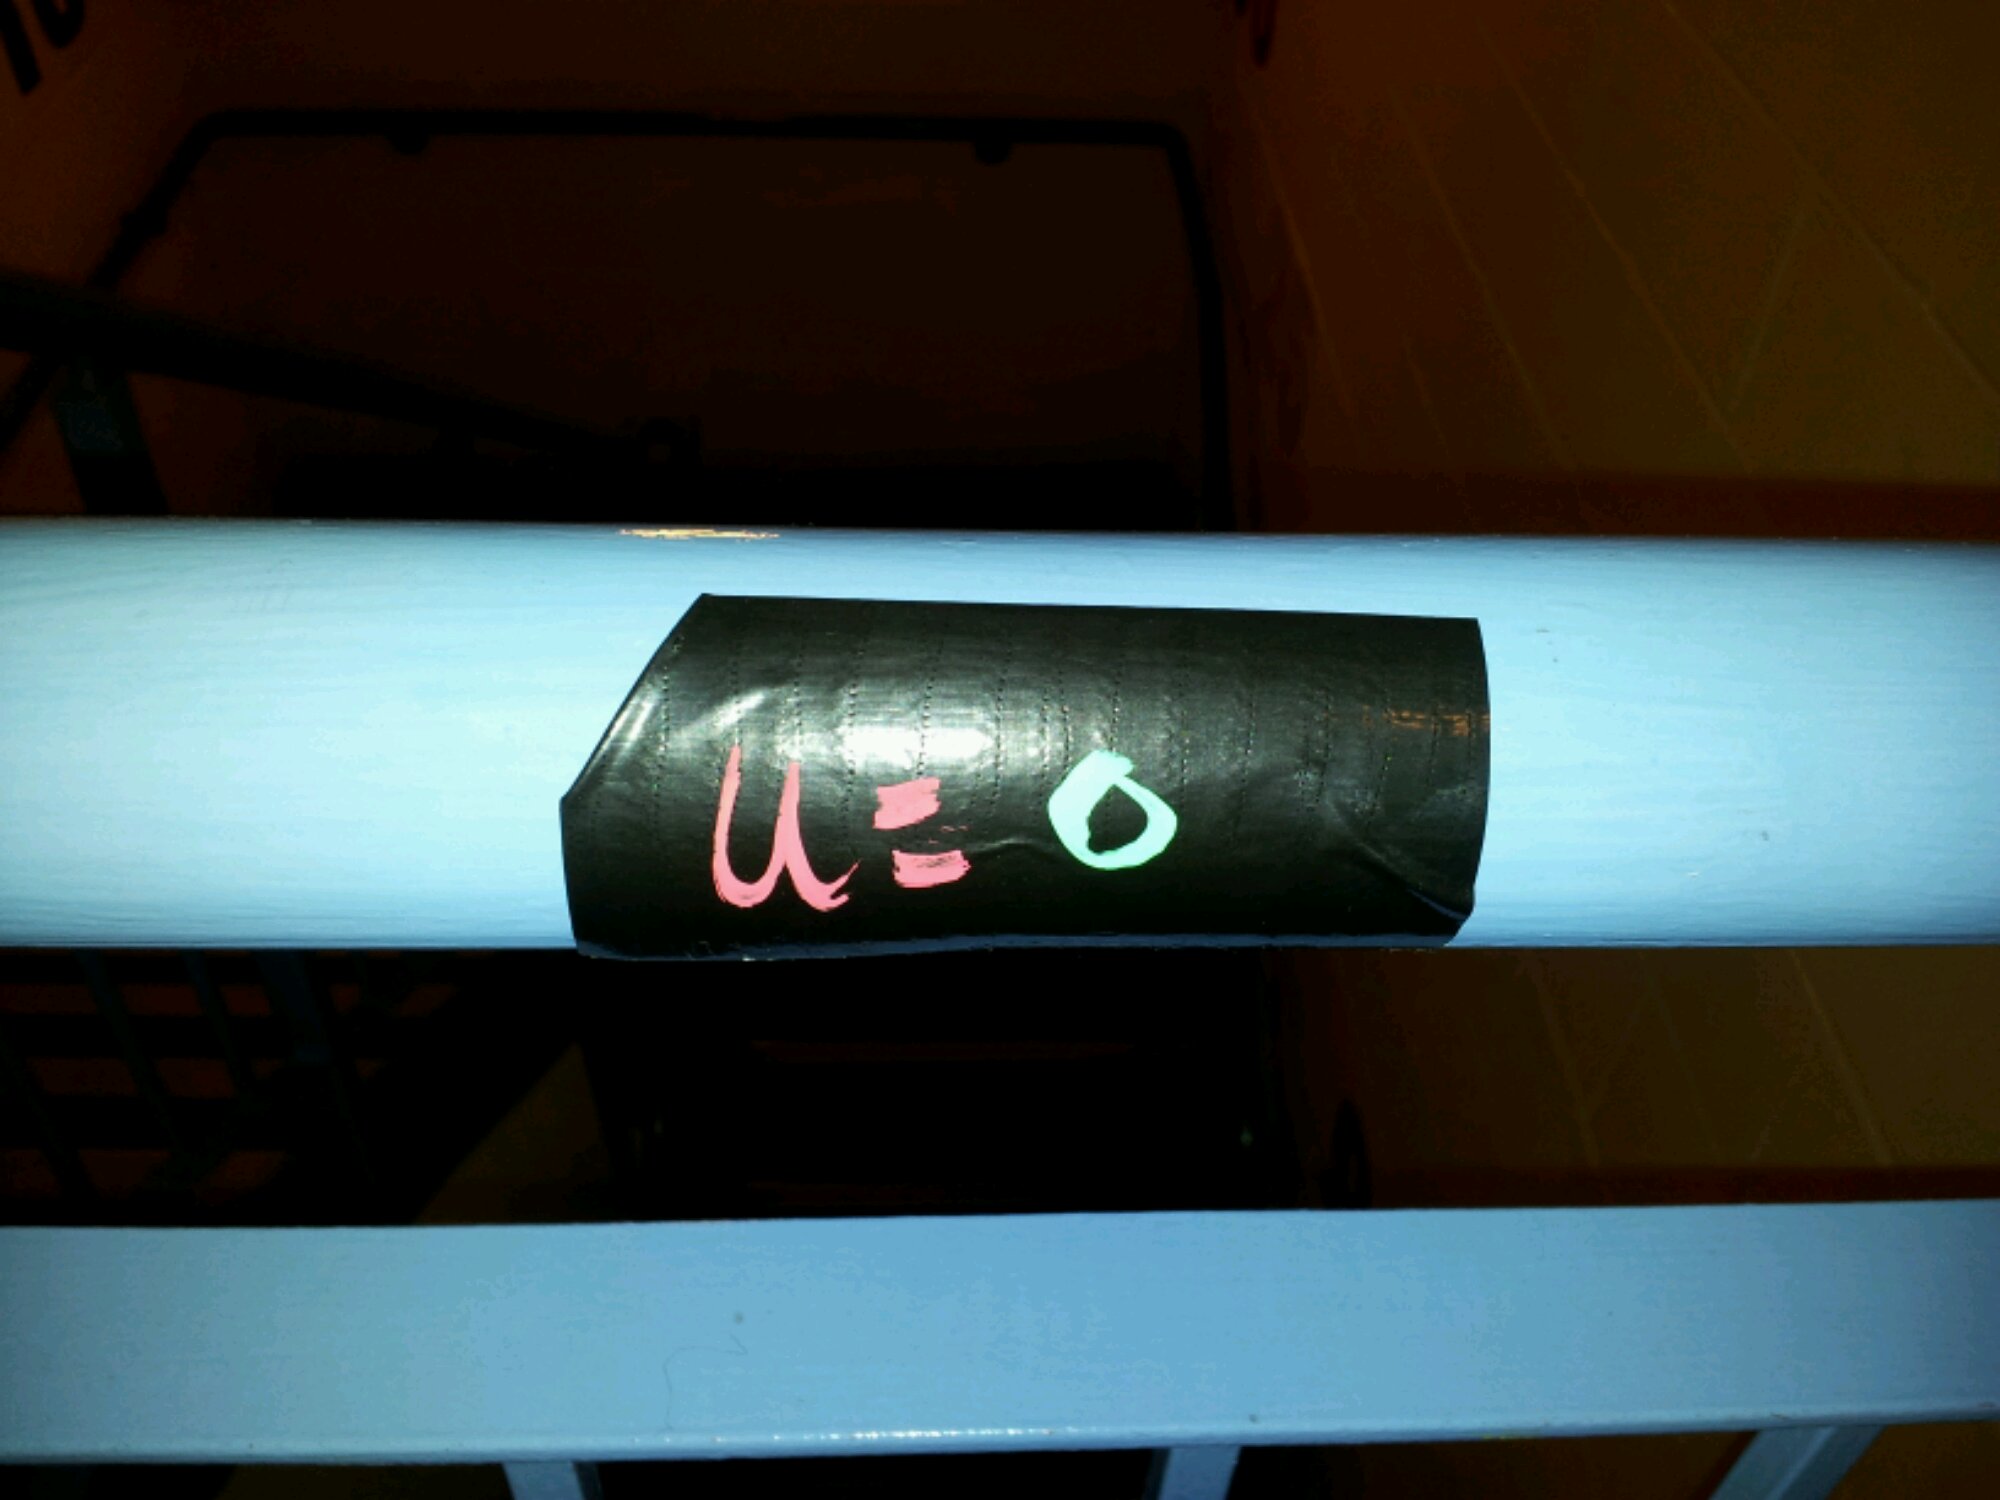
It’s all very well drawing diagrams for A-Level Mechanics questions, but how about a life size diagram? We were looking at vertical motion under freefall/gravity. I gave the students pieces of duct tape chalk labelled with a, s, u, v, t. We went to the staircase and labelled the wall with the tape – so u (initial velocity) was taped to the top of the bannister and v (final velocity) went on the floor at the bottom of the stairs, etc.

image

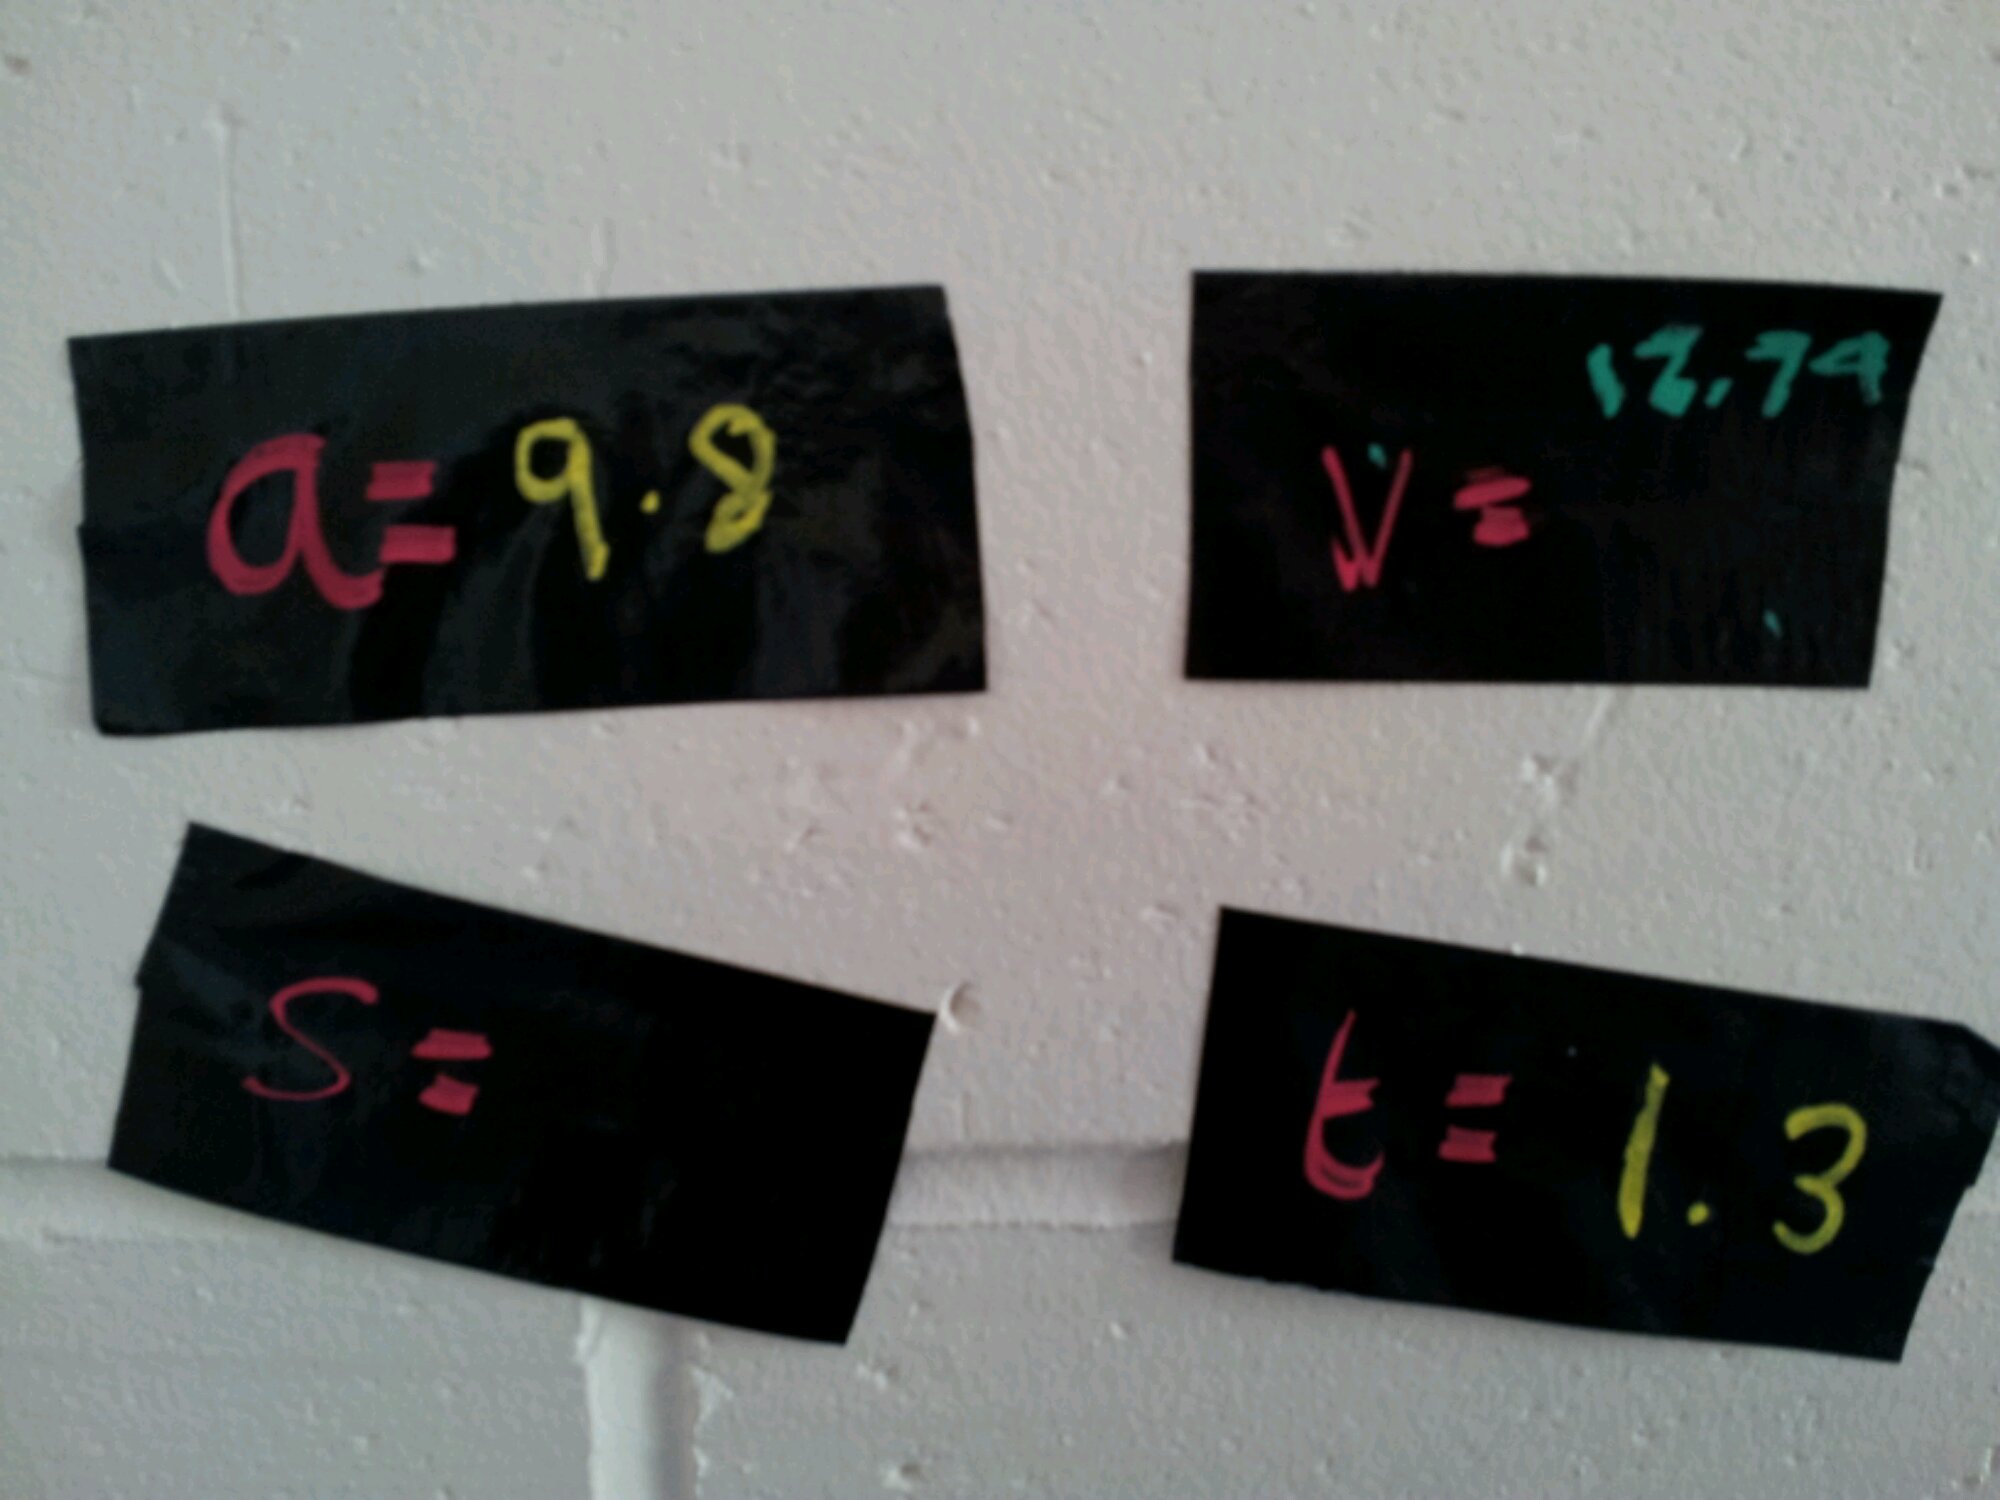
The students then labelled what they knew: a=g, u=0, v=?, t=?, s=?
image

The students used mobile phones to time the drop from the bannister to the floor and calculated the distance and final velocity. The physical activity allowed us to think about how to draw these kinds of diagram.

And finally …
Just some pictures of an alternative whiteboard:

image

image

185. I’ve lost a Dime


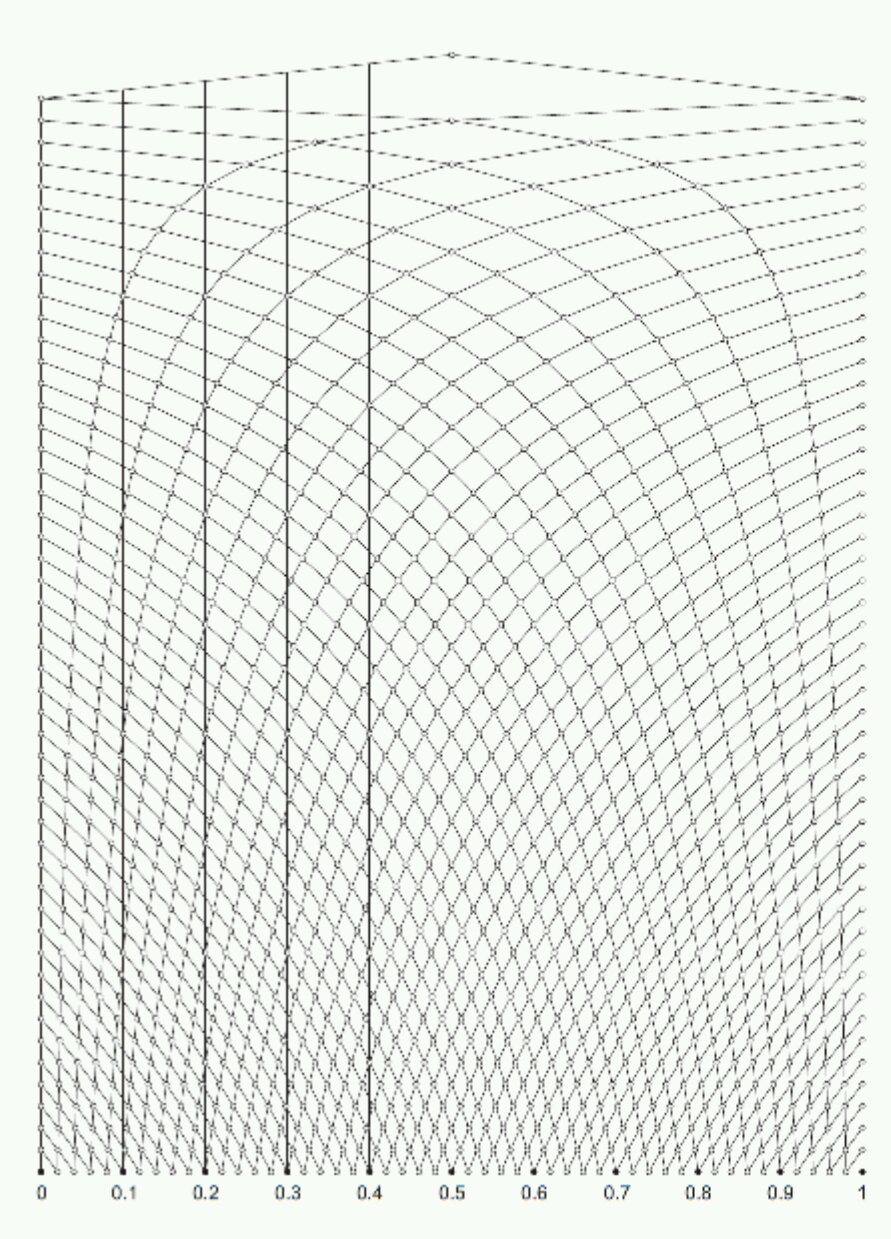
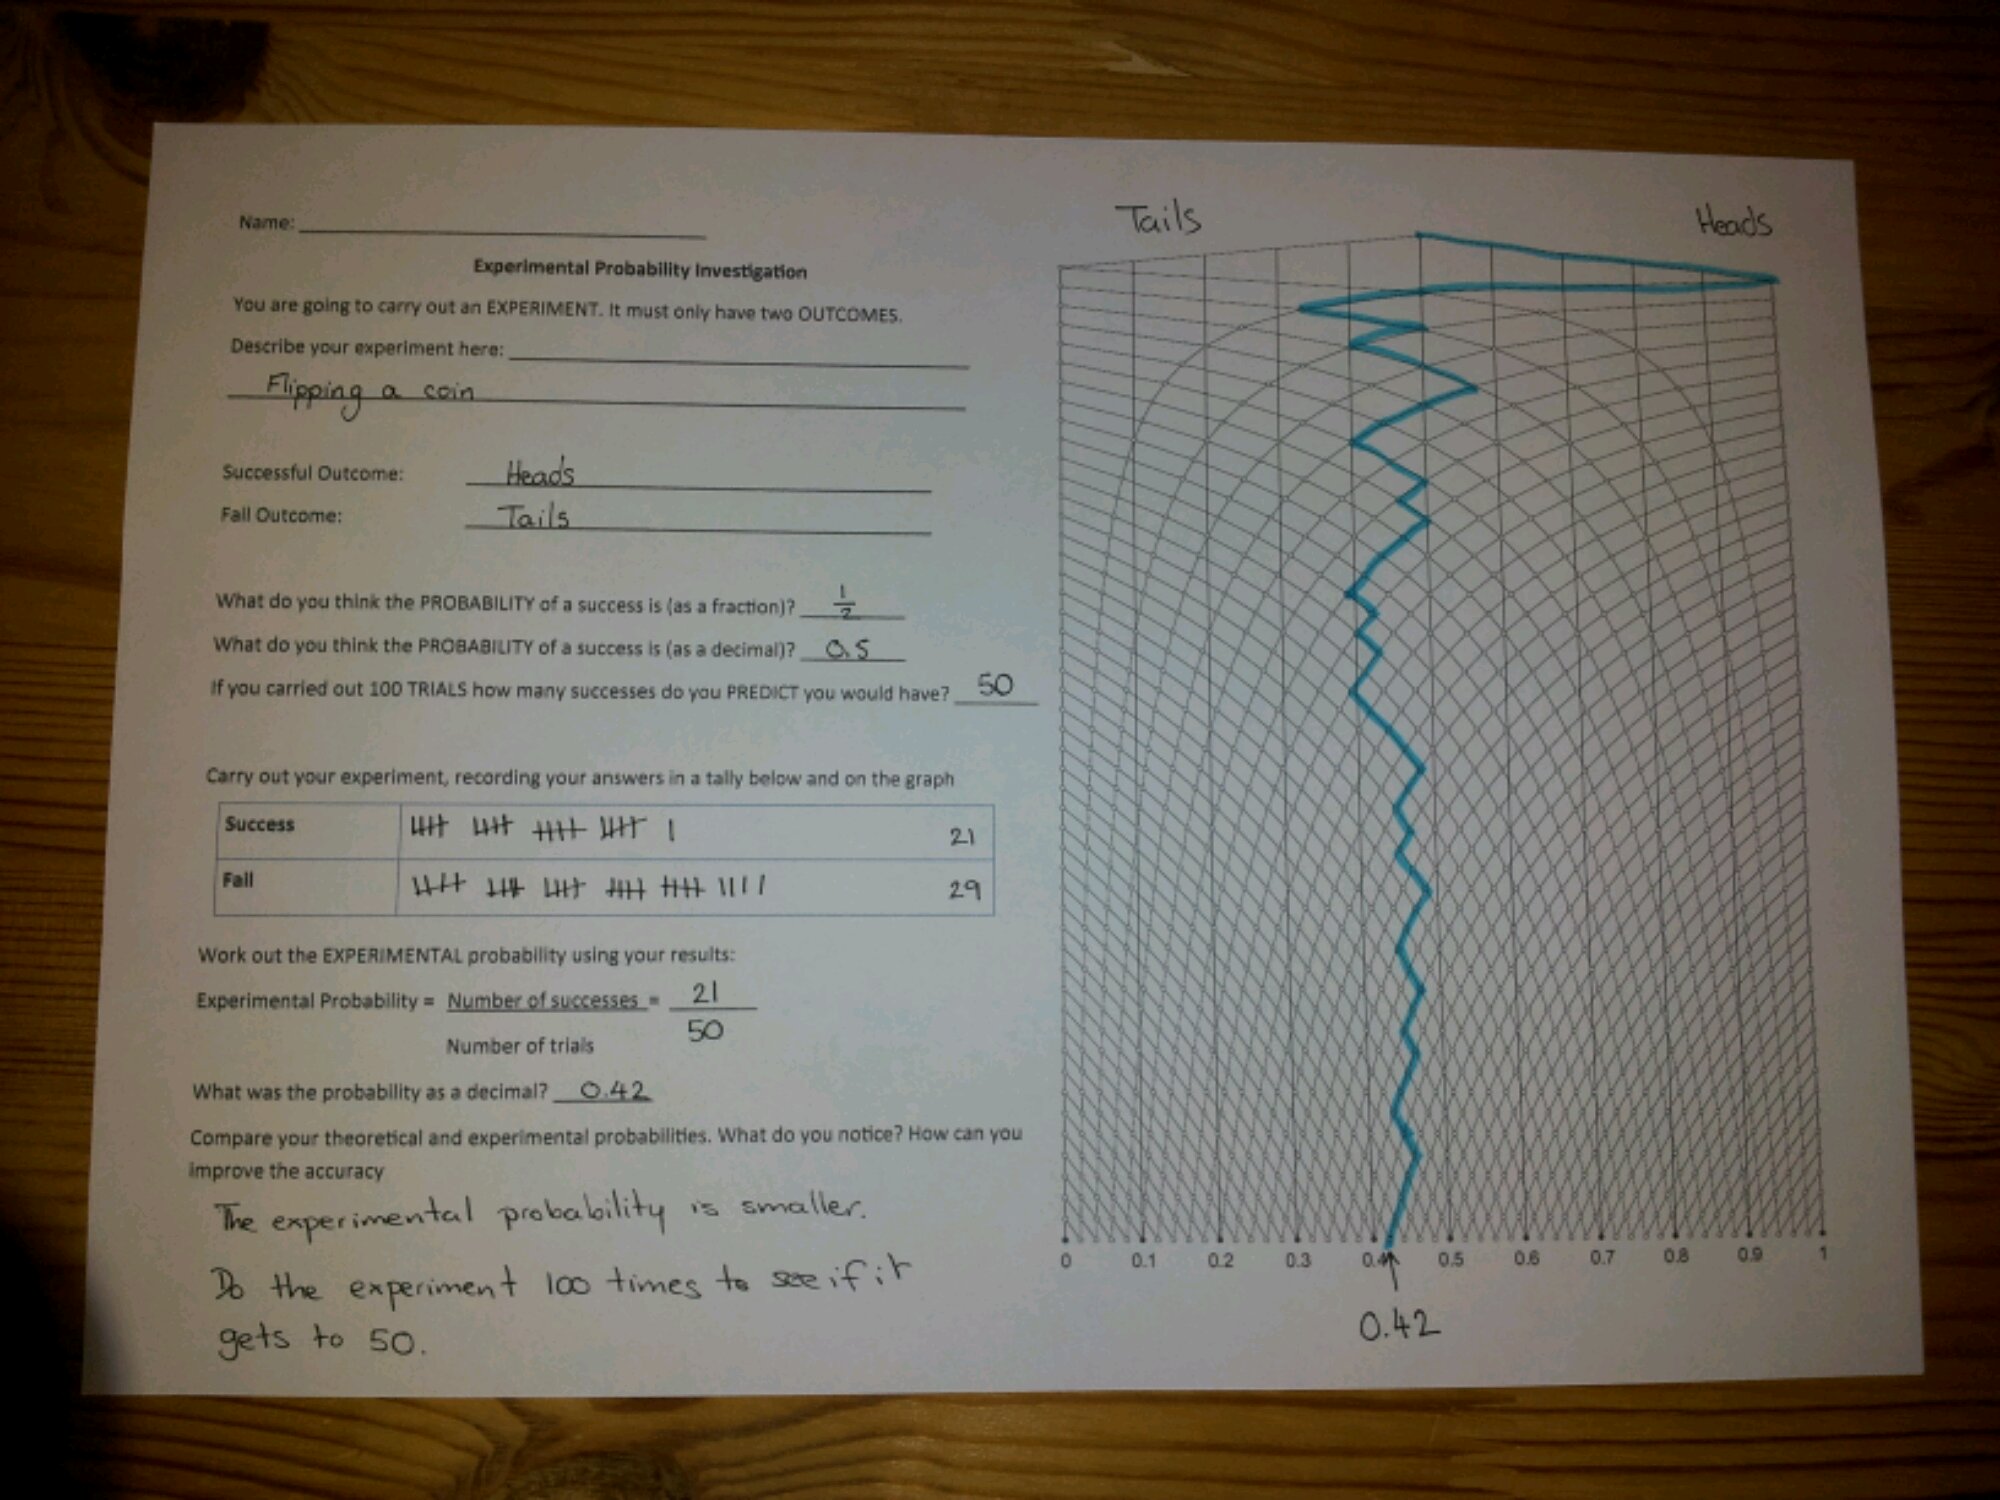
I haven’t actually lost a dime, rather I’m missing a Dime – specifically the second Dime probability pack. It was a great teaching resource for experimental probability from the first school I taught at. Unfortunately it is no longer available, although it is listed on the Tarquin archive site. Each student had a plastic tube with different coloured beads, a related experiment card and a record card. They could investigate the meanings of key vocabulary, carry out repeated trials and use this amazing graph paper, designed by Geoff Giles, to record results:

image

The graph paper works a little like a bagatelle or pinball machine. You start at the top ‘pin’. A success means move along the line to the next pin on the right, a fail means move to the left. You always move in a downwards direction. The more trials that are recorded, the further down you go. When you reach the bottom you will have carried out 50 trials and will be able to read off the experimental probability as a decimal. I found this blog (medianchoices of ict) with links to the Nrich website and interactive probability graphs. The graph paper from the Nrich site is here: RecordSheet.


Activity

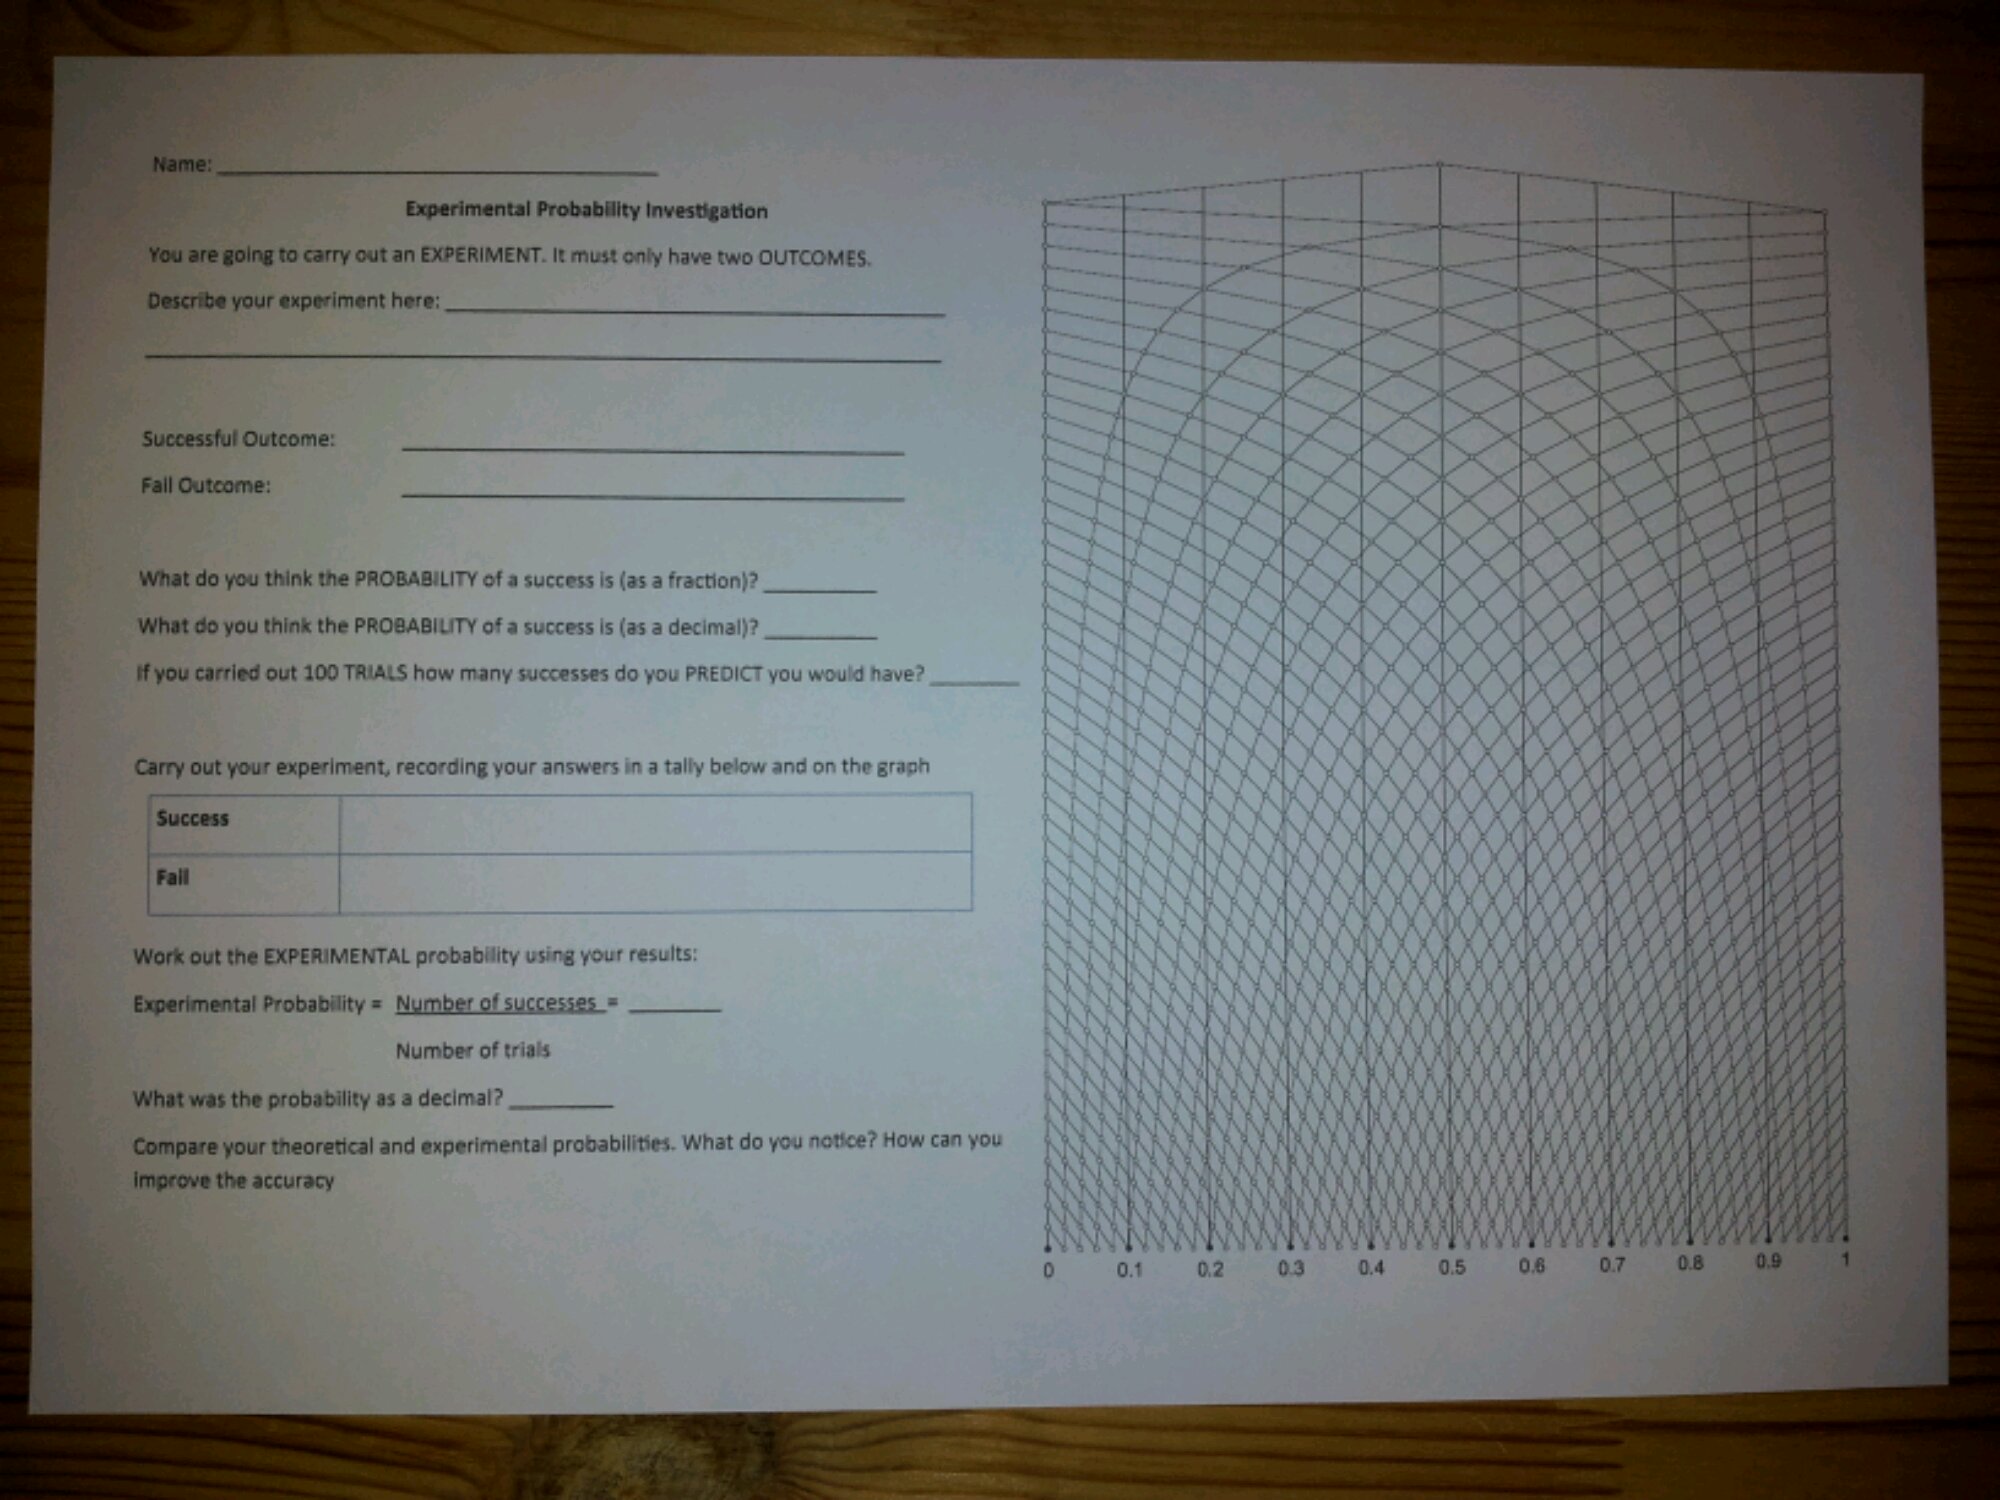
I decided to recreate the old Dime investigation sheets:
image

Students start by explaining what their experiment is and define what is a success/fail. They give the theoretical probability as a fraction and decimal, then predict the number of successes in 100 trials.


Students then carry out their experiment, recording their results in the tally chart and graph. After 50 trials, they write down the fractional experimental probability of success using the tally total and the decimal probability from the graph – hopefully they are the same! Students then reflect on their work and consider how to improve their results.

Download the worksheet here: Experimental Probability investigation

Sample

image

182. How much flooring?

I’m sure you’ve done or heard of people using their classroom as a basis for problem solving. How much would it cost to paint/wallpaper/carpet the room?

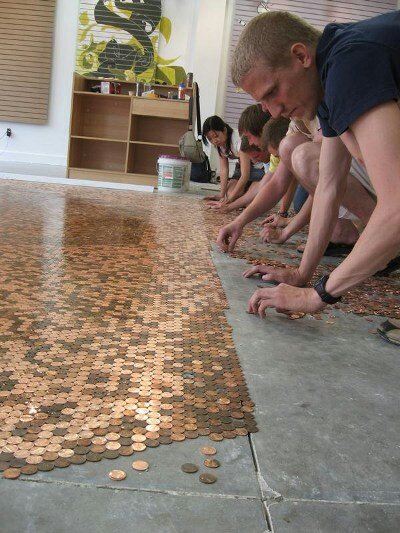
What about the literal cost of flooring a room?

image

Image credit: Pinterest

Many people have calculated that it is cheaper to use 1 cent coins rather than buy tiles. There are many examples collected together here: Keytoflow

I think this idea could be adapted to look at different sizes of coin, areas and tessellation. Even simple circular coins can tessellate in different ways – how much does this affect the cost? This is also an open task which could lead to some great strategies and discussions.

Update
@LearningMaths suggests students could investigate the percentage area covered by different types of coin. A great extension idea!

182. Chrismaths 12

On the twelfth day of Christmas Maths Sandpit gave to me .. some Time Lords a-leapfrogging!

Image credit: blastr.com

Download the poster: On the twelfth day of Christmas


As you’ve been downloading the posters, you’ll have noticed I haven’t strictly kept to the verses of ‘The Twelve days of Christmas’. However, if you do a little bit of research you’ll find that the verses have changed since 1780 and around the world there are variations. The lost verses include ’11 badgers baiting’, ’12 bells a ringing’, ‘8 hounds a running’ and ‘9 bears a beating’!

180. Chrismaths 11

On the eleventh day of Christmas the Muppets gave to me …

image

Image credit: The Muppets

Download the poster: On the eleventh day of Christmas


Hint: There are 10 types of people in the world – those who understand __ __ __ __ __ __ and those who don’t.