Category Archives: Number

52. Special Offer 2

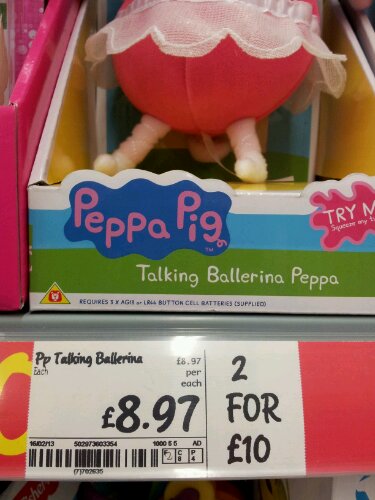
I think you’ll agree that this is a pretty good offer:

image

A total saving of £7.94.

How about this one?

image

I know these are meant to be mix and match offers, but the numbers are just funny.

(PS: I hope the discount algorithm on the till system doesn’t automatically apply the offer price if you buy two of the second toy.)

50. When will I ever use this …

image

A prescription says to take 2 pills every 4 hours, but don’t take more than 8 pills in 24hrs. There are 100 pills in a prescription.

If you start taking them on the 22nd March, when do you stop taking them? Assume you start taking them at midday and are in bed by 2230.

You can’t get a more real-life maths problem than that!

49. Trial by rice

Trial and improvement seems to be a bit of a marmite topic. You get it or you don’t! It’s a bit abstract, has scary algebra and those little numbers floating in the air – what are they about then?

Practical trial and improvement

Try doing T&I using a more practical/visual approach.

Equipment
Scales
Jug or bowl
Rice or other dried pulse
A big spoon
A medium spoon
A small spoon
(In fact as many different sizes as you want)

Task
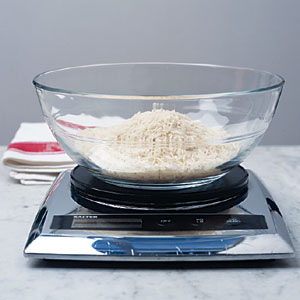
Tell the group you want a precise amount of rice in the jug eg 246g.
They can only use the spoons provided. Each spoon must be full – no half measures.
image

1. Ask a pupil to estimate what they think 246g is, without looking at the scale.

2. Using the big spoon, pupils try to get as close as they can by adding/subtracting spoonfuls. When they cannot get any closer, change to the medium spoon.

3. Repeat the previous step with the medium spoon.

4. Repeat the previous step with the small spoon.

(If you have smaller spoons, just keep going)

The Maths Bit
Each step in the process is equivalent to a step in the process of T&I.

1. Initial estimate of the solution
2. Narrowing to the nearest 10
3. Narrowing to the nearest whole number
4. Narrowing to the nearest 0.1
(More spoons, more decimal places)

This activity isn’t designed to help with substitution, but it does get across the concept of why you do each stage. It is a good memory aid too. Now when I revisit T&I and get the usual blank looks of ‘Seriously Miss, we have never done this before’ I just mention the rice measuring lesson and a series of little lightbulbs go on.

48. Percentage book

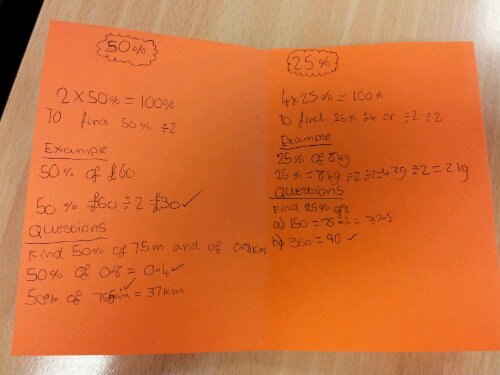
I’ve found that copying examples and methods into a useable revision resource can be tricky for younger pupils or those with concentration issues. They don’t refer back to their notes because they are either incomplete, unreadable, unfindable in their book or just lost.

I saw instructions for making simple books from a single sheet of paper and wondered if it was worth a try.

Non calculator percentage book

Making the book
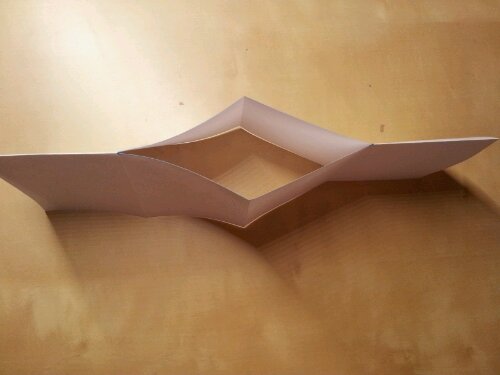
Fold a sheet of paper into eight as shown. The sample here is A4, but I used A3 in class.

image

Cut along the middle two quarters (blue line in the picture) and fold in half lengthways.

image

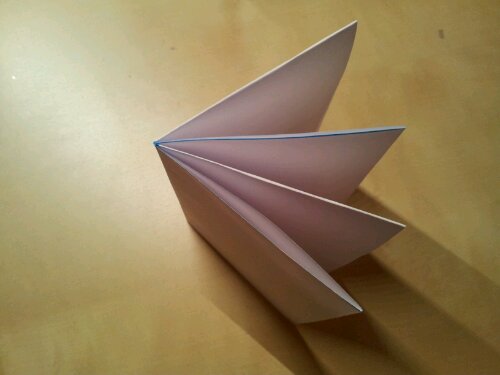
Fold this into an X shape.

image

Arrange into a book.

image

Instructions
Clearly label the cover – you want your pupils to find this easily.

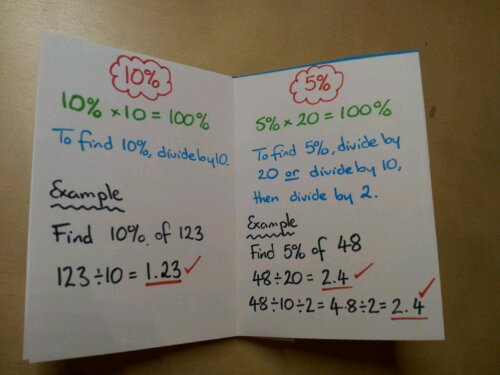
As we filled in each page, I explained why we did each process. Because their books were larger, the bottom of their pages had questions too.

image

We covered 50%, 25%, 10%, 5%, 30% and the last page was a challenge/extension task: 17.5%.

The back page was left blank so that they could stick the mini-books into their exercise books.

Example

image

45. Show me the money

If you offer personal finance as a compulsory part of the curriculum, stop reading now.

‘Pay day loan’ companies have been the subject of several news stories over the last few months. Do they make money from those suffering from financial strife? Are the people who take them out too short-sighted to see the long term impact? Are they bad at Maths?

Personally, I don’t think there is a simple answer to any of it. That is the reason I’ve started including pay day loans when I do percentages with KS4 pupils.

Loan calculator
This idea arose when I was revising with older pupils who had the skills to work out percentages, but were struggling to apply them.

I showed them the loan calculator sliders on Wonga.

image

I asked the class to estimate how much different loans would cost for different numbers of days. They showed their answers on whiteboards. I then showed the actual amount owed and we discussed it.

The questions they came up with and how they justified their choices were brilliant.

Student Examples
If you are always £100 short at the end of the month and continually paid off the loan with interest, what would you owe after a year?
(They spotted that after each month you would need £100, plus an extra months interest etc)
What is the APR? What does APR mean?
(It was 4214% on the day we discussed it)
Why do you pay fees on a loan?
Are pay day loans a bad thing as a one off, emergency solution?
(They were split on their answer to this one)

Some of these questions wouldn’t be relevant in a GCSE, but they are life skills which will hopefully benefit them in the future.

By the way, they were ‘gobsmacked’ when they realised how much interest you pay back on a mortgage and what percentage of your wages go on monthly repayments!

43. Visualising percentages

Percentages are all to do with proportion, but this seems to escape the understanding of some. If you calculate 20% of £15, this is different to 20% of £25. The 20% is not a fixed quantity. How can you explain this to visual learners?

Visual Percentages/Proportion

Equipment
Pencil
Ruler
Paper – squared makes the task easier
Coloured pencils (optional)

Calculations
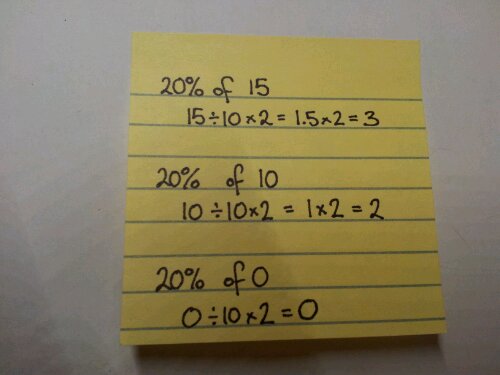
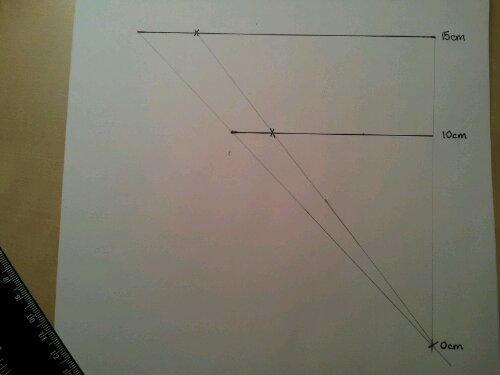
Find 20% of 15, 10 and 0.

image

Construction
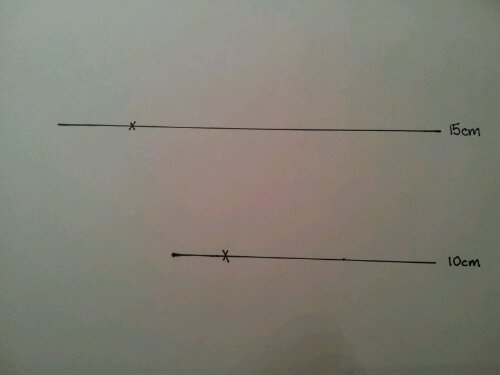
Draw a 15cm line, mark 3cm along it.
Move down 5cm.
Draw a line, mark 2cm along it.

image

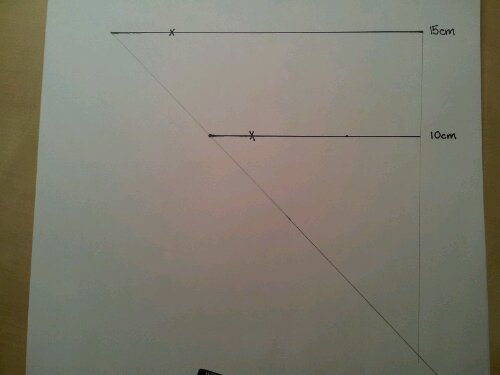
Join the ends of the lines with a ruler and indicate this with a cross.
image

This should be 10cm lower than the bottom line.
Repeat, joining the 3cm and 2cm points.
image

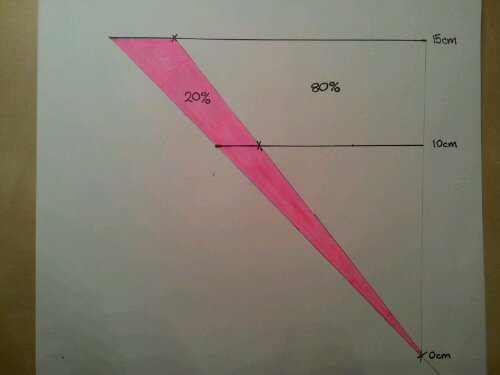
Shade in the smaller triangle.
Label the lines.
image

The Maths bit
The width of the triangle indicates the whole amount (100%).
The shaded width represents 20%.
The unshaded width represents 80% (Ask students if they know why).

The whole diagram represents 20% of any number from 0 to 15.
This can be adapted for any number and percent. It visually shows that as a number gets bigger the percent increases proportionally.

You can also use this to investigate fractions.

Note: This is for comparing widths. You can challenge your students to prove whether it is also true for the areas of the triangles.