Tag Archives: practical

54. Space saving displays

I used to teach in a corner classroom: 8 windows, lovely light quality, nice views, only one maths display board.

We had to get creative about how to display work.

Peelable glass paints were useful for making temporary stained glass effect displays on the windows. They were time-consuming and tricky to do with large groups.

Hanging displays were very useful. The longest display I’ve ever done consisted of 30 strips of A4 length card, with a transformation repeating pattern on each. The card was hole punched at either end and then attached with a piece of string to the next one (treasury tags would have been quicker). It took a lot of blu-tak to put it up, but it went nearly the whole way around the room.

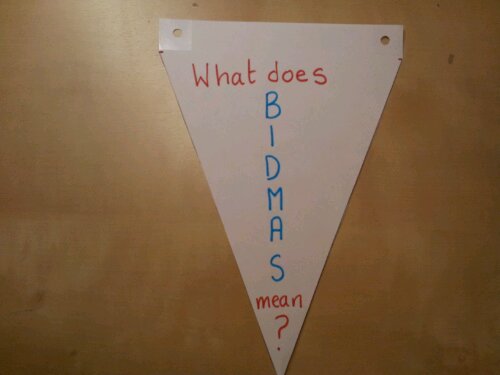
My children were making Easter bunting and it got me thinking. Why don’t we use bunting to summarise key facts in class? It’s easy to make, cheap, you can colour code by topic and you can add to it all term by connecting another fact onto the end. It won’t take up precious wall display space as you can hang it above displays, around boards or even across the room.

Equipment
Card (size and color of your choice)
Scissors
Ruler
Hole punch
Tape (optional)
String or treasury tags

Decision time
Decide on your theme:
– one colour for all?
– one colour per topic?
– one colour per grade?
– traffic light for difficulty?

Decide on your shape:
– classic isosceles triangle?
– rectangles for more writing area?
– different shapes for different shape facts?

Isosceles triangle instructions
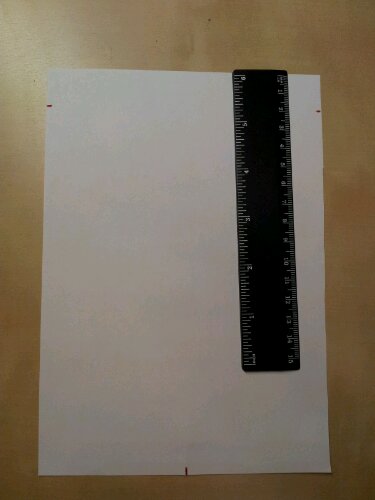
The instructions were made using A5 card.
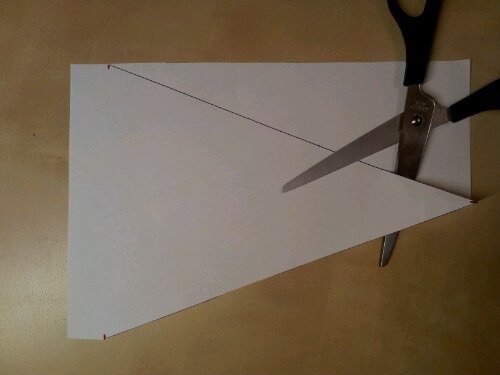
Measure roughly 2-3cm down from the narrow end of your card.

Mark the midpoint of the bottom of the card.
image

Join up these three points and cut out.
image

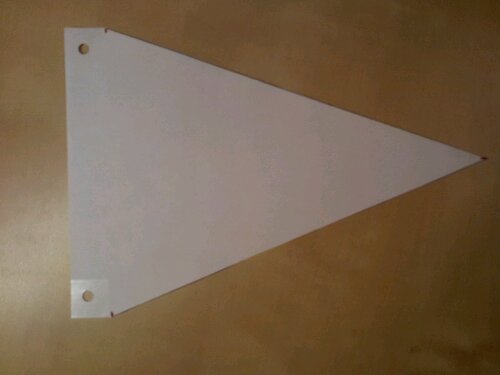
Wrap a small piece of tape around either side of the top of the shape. This strip across the top reinforces the flag. The holes won’t be too close to a point, nor will they tear easily.

Hole punch the tape.
image

Repeat for as many flags as you need.
image

Connect them together by threading onto a long piece of string, if you want a fixed length display.
Connect them by treasury tag or knotted string, if you want an extendable display.

If you made one of these for each unit, you could store them away and get them out for test revision or recaps.

48. Percentage book

I’ve found that copying examples and methods into a useable revision resource can be tricky for younger pupils or those with concentration issues. They don’t refer back to their notes because they are either incomplete, unreadable, unfindable in their book or just lost.

I saw instructions for making simple books from a single sheet of paper and wondered if it was worth a try.

Non calculator percentage book

Making the book
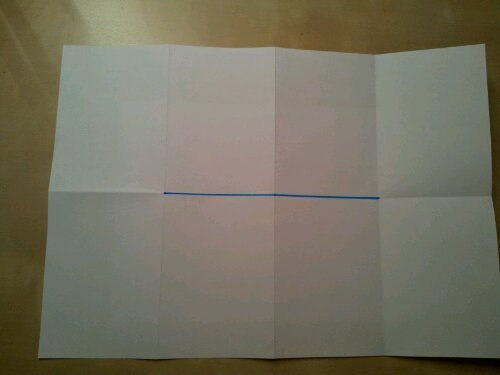
Fold a sheet of paper into eight as shown. The sample here is A4, but I used A3 in class.

image

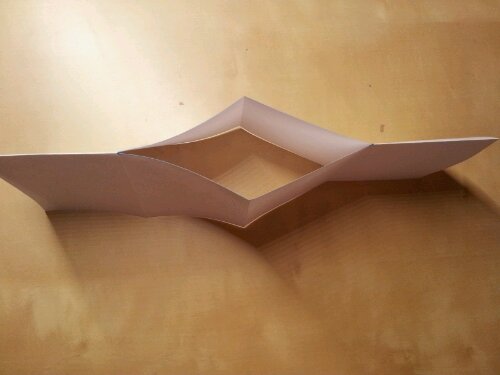
Cut along the middle two quarters (blue line in the picture) and fold in half lengthways.

image

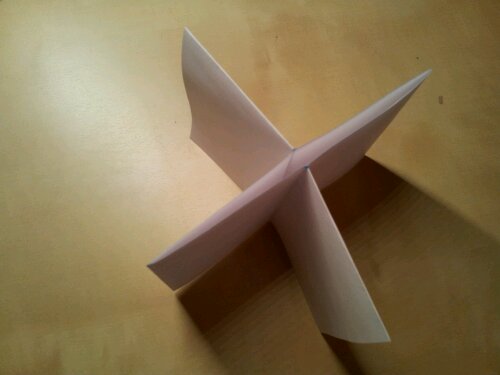
Fold this into an X shape.

image

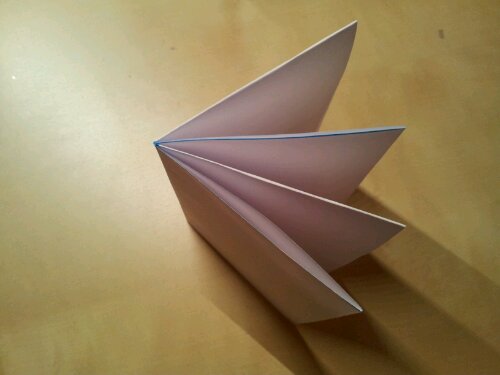
Arrange into a book.

image

Instructions
Clearly label the cover – you want your pupils to find this easily.

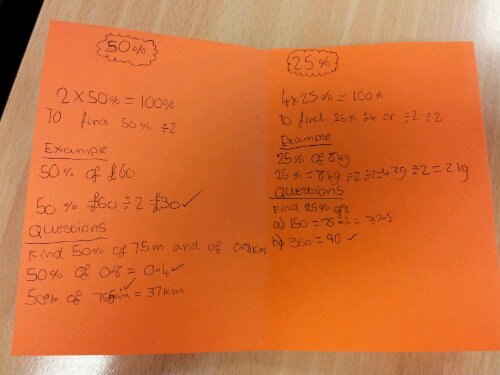
As we filled in each page, I explained why we did each process. Because their books were larger, the bottom of their pages had questions too.

image

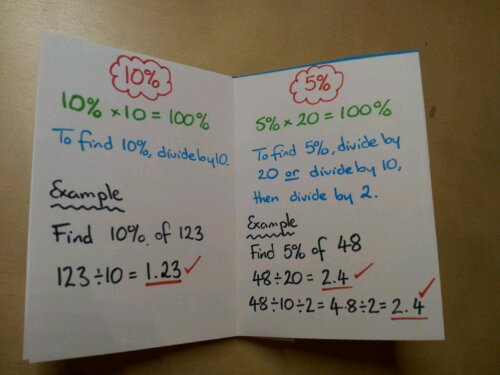
We covered 50%, 25%, 10%, 5%, 30% and the last page was a challenge/extension task: 17.5%.

The back page was left blank so that they could stick the mini-books into their exercise books.

Example

image

46. Pursuit Curve from the past

This project hit all the buttons for me (Maths, Craft, Art, fair bit of Black).
image

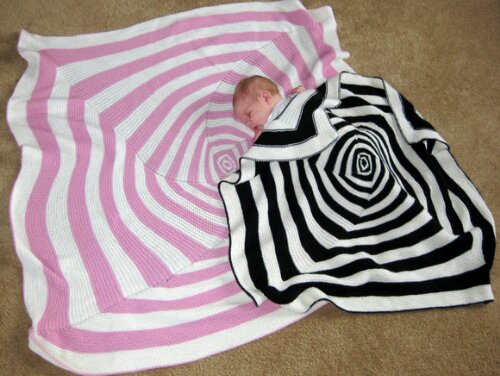
The pattern is in the Knitty archive – OpArt. I made my version for the first-born child of friends.

Longer ago than I care to remember I collaborated on a instructional for pursuit curves on PrimaryResources.co.uk.

Although they aren’t a key part of the Maths curriculum, pursuit curves shouldn’t be overlooked or dismissed as an end of term activity. To produce an accurate picture, pupils need to carefully use measuring and drawing equipment – this makes it a good way to start a measures topic.

43. Visualising percentages

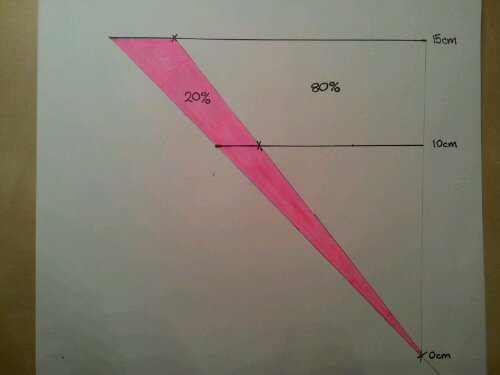
Percentages are all to do with proportion, but this seems to escape the understanding of some. If you calculate 20% of £15, this is different to 20% of £25. The 20% is not a fixed quantity. How can you explain this to visual learners?

Visual Percentages/Proportion

Equipment
Pencil
Ruler
Paper – squared makes the task easier
Coloured pencils (optional)

Calculations
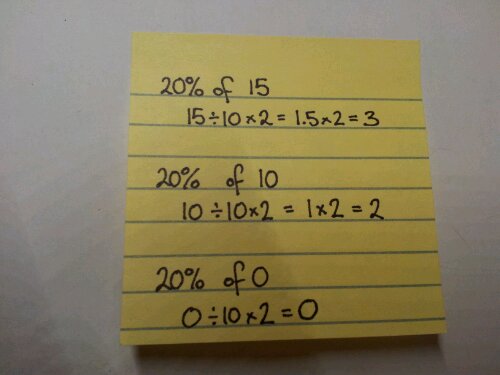
Find 20% of 15, 10 and 0.

image

Construction
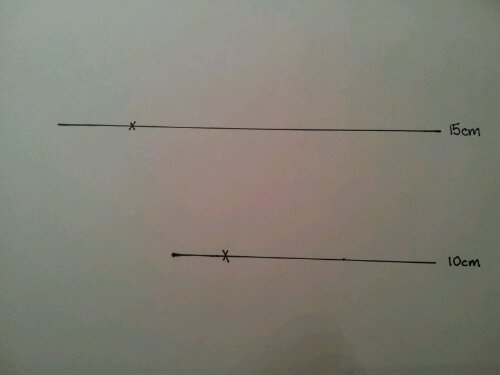
Draw a 15cm line, mark 3cm along it.
Move down 5cm.
Draw a line, mark 2cm along it.

image

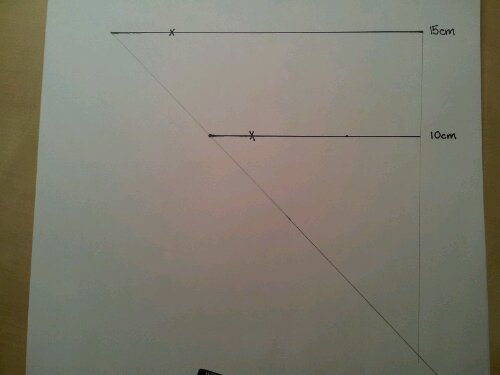
Join the ends of the lines with a ruler and indicate this with a cross.
image

This should be 10cm lower than the bottom line.
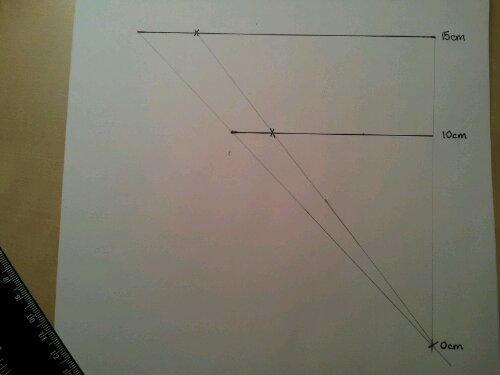
Repeat, joining the 3cm and 2cm points.
image

Shade in the smaller triangle.
Label the lines.
image

The Maths bit
The width of the triangle indicates the whole amount (100%).
The shaded width represents 20%.
The unshaded width represents 80% (Ask students if they know why).

The whole diagram represents 20% of any number from 0 to 15.
This can be adapted for any number and percent. It visually shows that as a number gets bigger the percent increases proportionally.

You can also use this to investigate fractions.

Note: This is for comparing widths. You can challenge your students to prove whether it is also true for the areas of the triangles.

41. Revision traffic lights

Visual revision aid today!

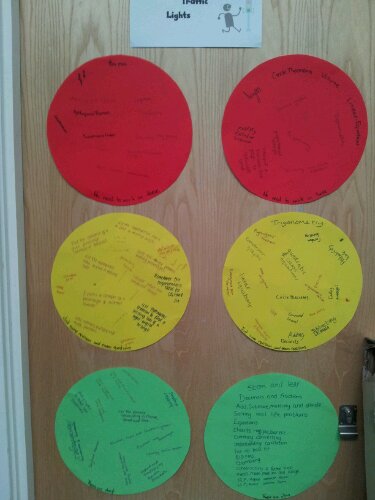
I asked my GCSE students to ‘traffic light’ all the learning objectives from the course. The categories were:
Red – I really need help with this.
Amber – I’m okay with this, but I will need to revise before trying exam questions.
Green – I’m fine to try GCSE questions on this.

They worked together to write up their top responses on coloured paper. There are two of each colour so they didn’t get too crammed.

image

Now I know where they need help/ a confidence boost and the class can see their concerns addressed as we work through their lists. Of course, I’ll add in topics they missed.

This activity gives them a sense of ownership of their learning.

39. So simple a child could do it

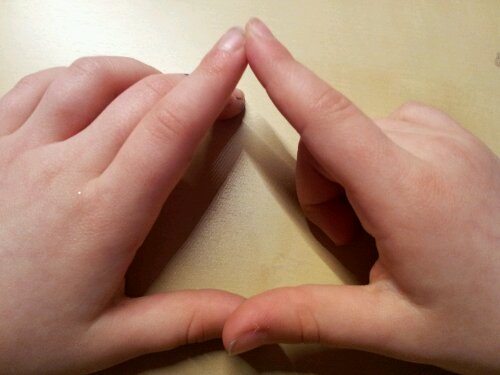
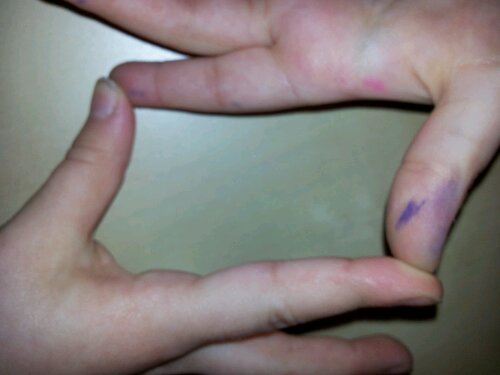
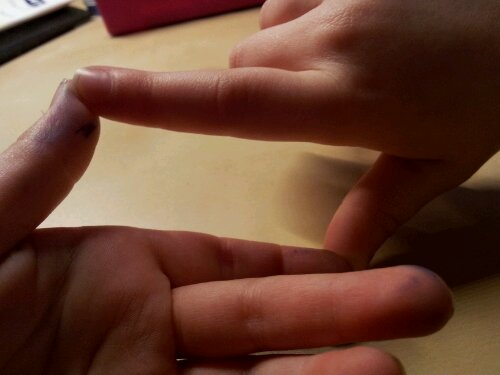
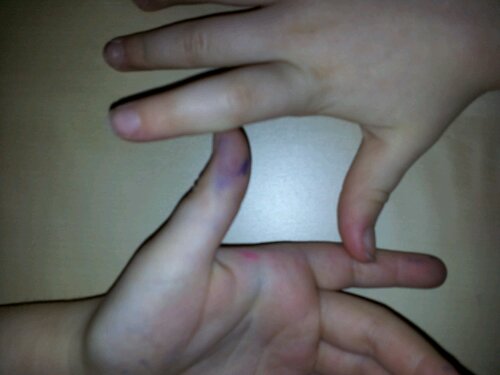
Forget making hearts with your hands – that’s so 2012! Triangles and quadrilaterals are the way to go.

This is quicker than getting whiteboards out, can be used as a memory aid and keeps mischievious fingers busy.

Getting started
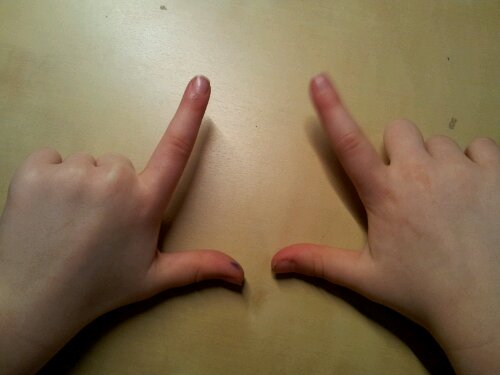
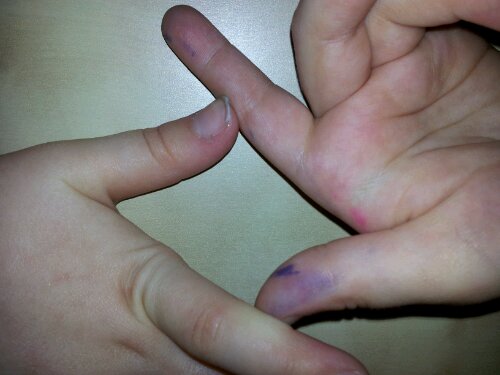
The basic L shapes (my assistant had been busy with felt tip pens before being photographed).

image

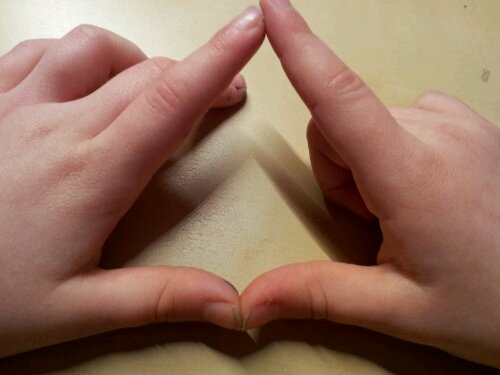
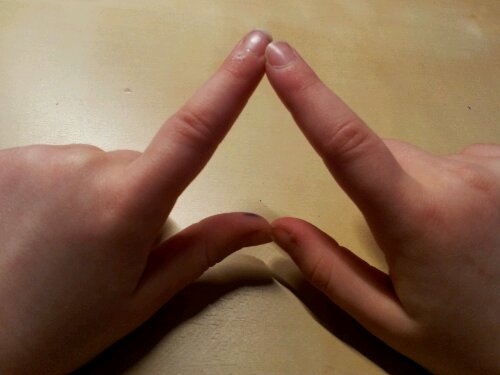
Isosceles Triangle

image

Index figures and thumbs together.

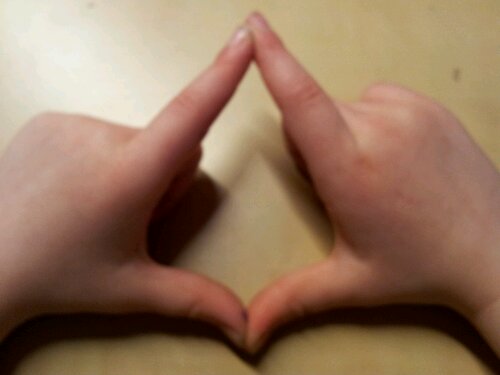
Equilateral Triangle

image

Index figures together, thumbs overlapping.

Rectangle

image

Index fingers and thumbs joined at 90 degrees.

Parallelogram

image

As for the rectangle, but opposite angles equal (as opposed to 90 degrees).

Square

image

Thumbs part way down index fingers at 90 degrees.

Rhombus

image

As for the square, but opposite angles equal (rather than 90 degrees).

Arrowhead Kite

image

Index fingers together, thumbs together, all pointing upwards.

Kite

image

Index fingers pointing up, thumbs pointing down.

14. JDs Tree Diagram

My friend JD came up with this visual way of explaining tree diagrams. I’m reproducing it here with permission (Thanks!). It helps if you have a school uniform with a tie and jumper, however this could easily be done with coats and hats.

Set Up
You need 6 volunteers, dressed as listed:
1. (No jumper, no tie) x 2
2. (No jumper, tie) x 2
3. Jumper, tie
4. Jumper, no tie

(This can be adapted for listing multiple outcomes too)

Activity
Draw a V shape on the ground.
Explain that in the morning you have choices when you get dressed. Each branch represents a choice.
Choice 1: Do you put your tie on or not?
Get a student wearing a tie to stand at the end of one branch and one without a tie to stand at the end of the other

Draw a V from each student.
Choice 2: Do you put your jumper on or not?
Get the class to decide who stands where

Discussion
If all the choices are equally likely, what is the probability of getting in trouble with your teacher over uniform?
Can you prove this by looking at the probabilities of the individual events?
What would happen if the outcomes were not equally likely?

It’s a good idea to try and take a picture of what this looks like to display in class. You could also annotate it with fractions and overall probabilities.