When you Google the phrase ‘Circle Theorem paper plates’ you will see some stunning work from teachers (and their pupils) from around the world. Today I tried this idea out and I can vouch for its usefulness as a revision tool.
If you are short on display space or need a stable, minimum staple solution, try this:
Use split pins to join the plates together. They are stronger than tape and more flexible than staples, which can tear.
Get creative – I made a triangle, but you could make a chain, other shapes or even an archway around your door frame. Once you have connected your plates, you need far less staples or sticky tack to attach them to the wall.
If you want more foldables after the Paper Maths session, run by the lovely @MsSteel_Maths, I can recommend this resource: Foldables by Dinah Zike
(Note: this pdf is widely available and a version of it is free to download from Dinah Zike’s website, however if you represent Ms Zike and there is a copyright issue please contact me in the comments below)
Are you a fan of ‘The Mr Men’? Are you a hopeless Maths geek? Get yourself over to SolveMyMaths!
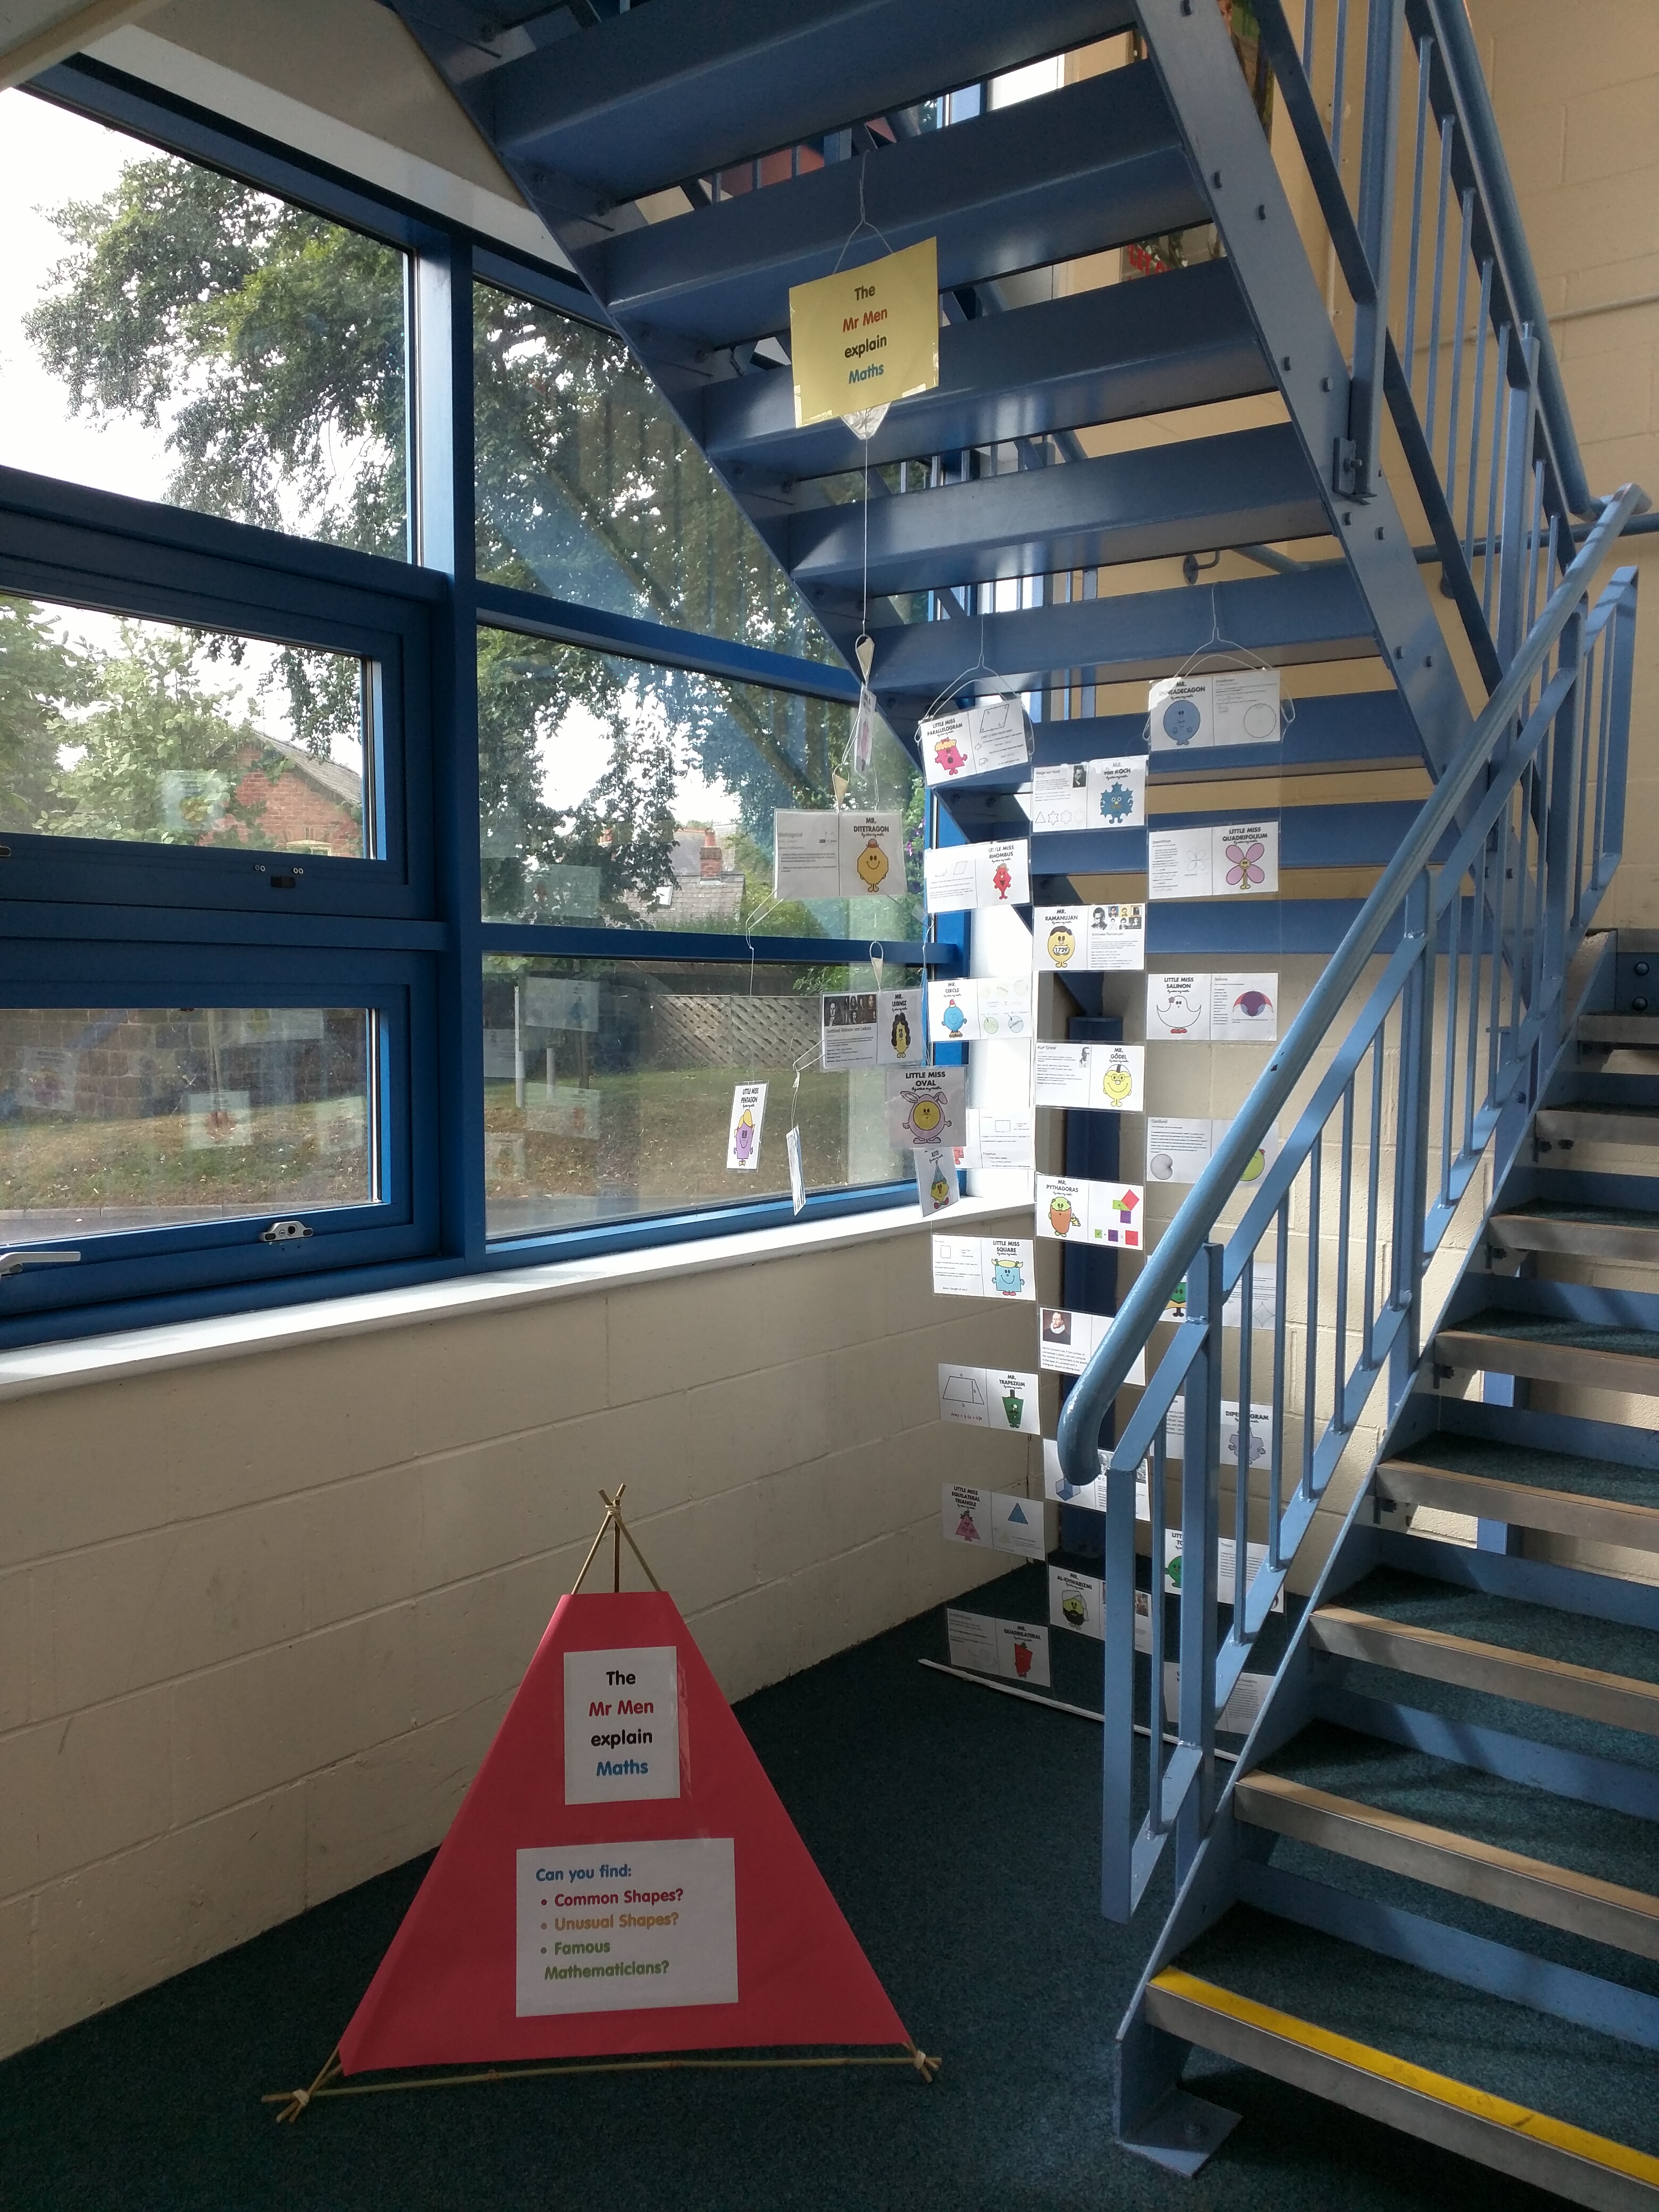
I’m sure I’ve mentioned the brilliant Maths Mr Men and Little Missesbefore. Here is what I did with the set I printed and laminated (click on each picture to enlarge):
There are three sections to this display: the title tetrahedron, the mobile and the invisible wall.
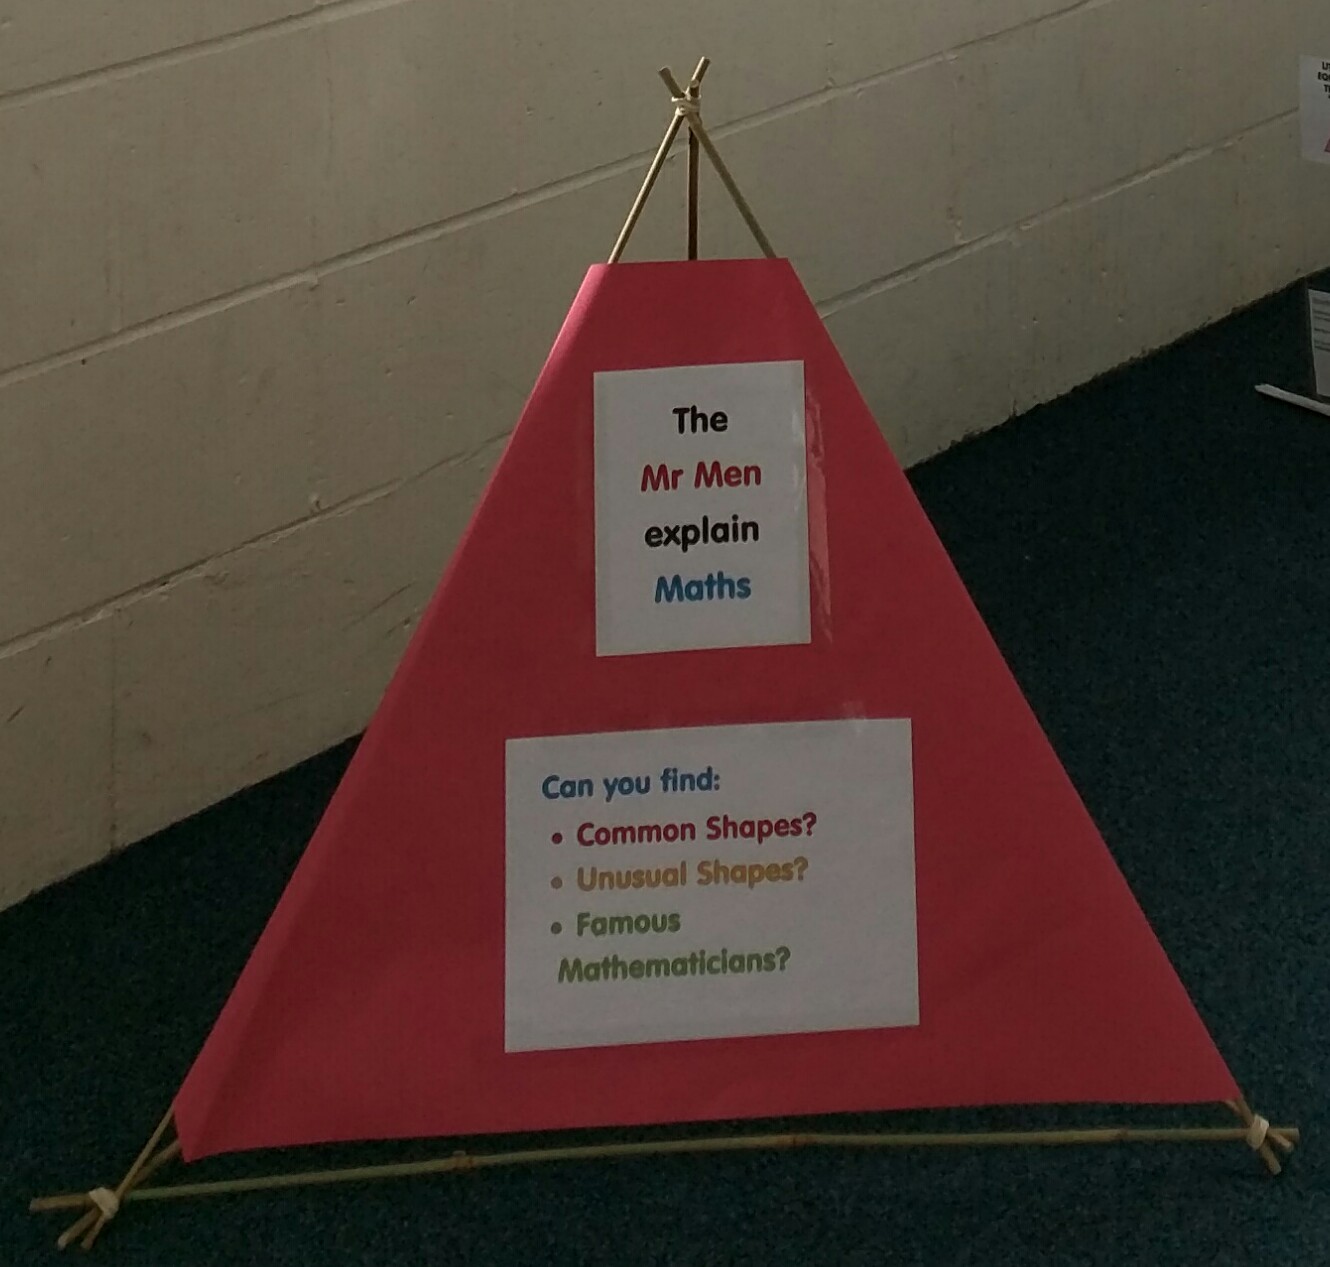
Title tetrahedron
You will need: six garden canes, four strong elastic bands, sugar paper, tape and your title.
It’s a straightforward tetrahedron made from canes, with the corners secured with elastic bands. Then stick your title to the paper and wrap it around one face, trimming sticky-out bits and securing with tape. It ‘s a good way to make sure no one accidentally walks into your mobile.
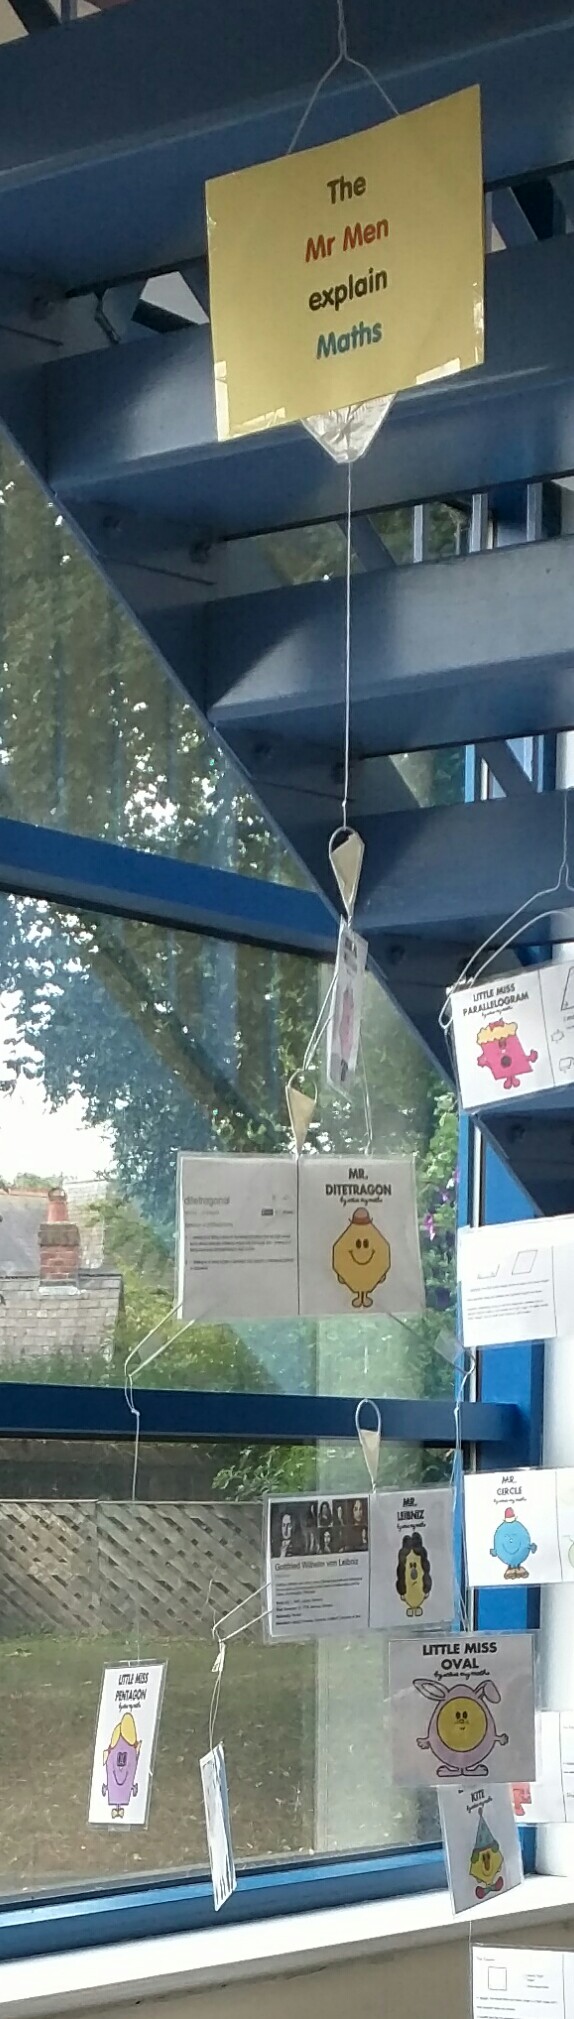
The mobile
You will need: four wire coat-hangers, tape, Mr Men cards, fishing line and your title
My mobile is long and narrow because of the space I hung it in. The title hanger has been stretched into a rhombus shape and had a long loop of fishing line attached. The ends of the line were covered in white duct tape which you can see at the bottom of the title as a white triangle. The title was attached front and back.
The lower hangers were bent into a ‘C’ shape by pushing the straight base of the hanger upwards. Tape was wrapped near the ends of each arm to ensure the hanging shapes don’t slide along. Fishing line is threaded through the loops at the end of the arms and knotted. The knots are concealed inside the Mr Men cards, which were one sided. When I attach the remaining hangers to other things I squeeze the hook closed and cover the join in duct tape – it saves it unhooking later.
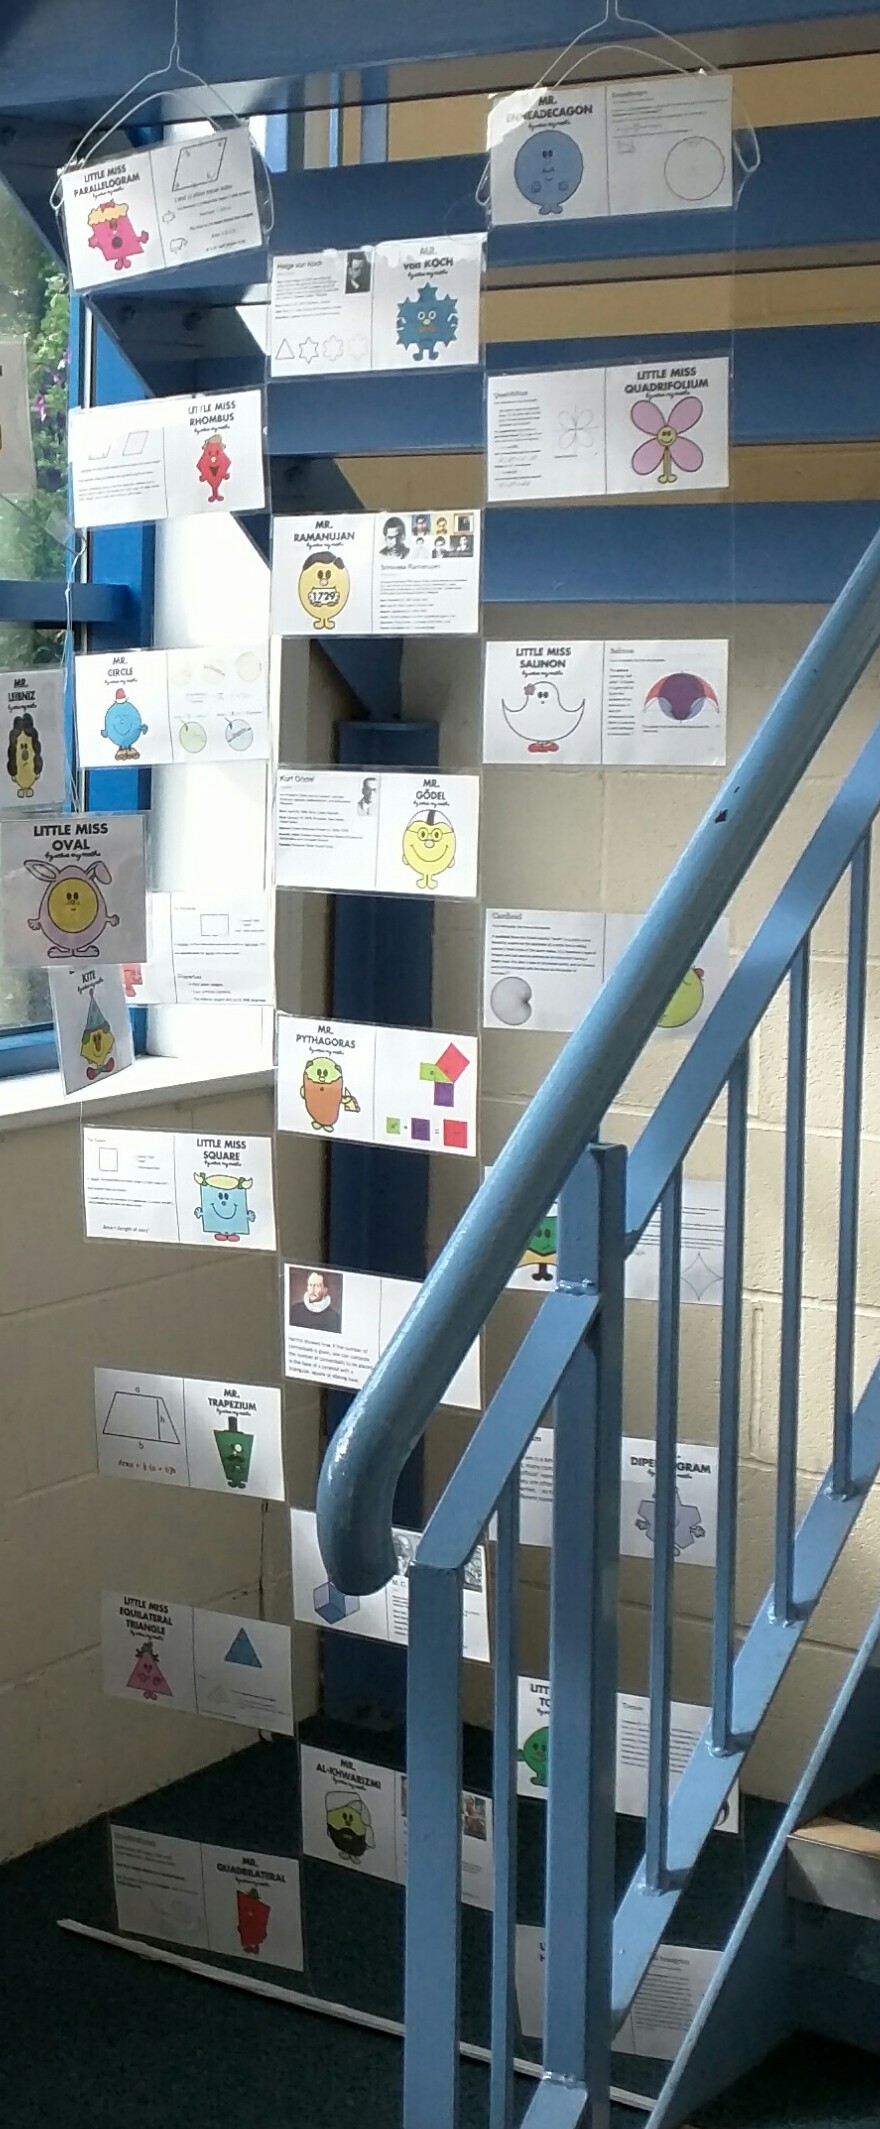
Invisible wall
You will need: duct tape, fishing line, wide Mr Men cards, sellotape, two coat-hangers and an old metre stick (or equivalent).
I found an old, split metre stick in the back of the stockcupboard and covered it in duct tape to make it safe. I marked out three Mr Men card widths across and attached long lengths of fishing line. The knots were held secure and camouflaged by more duct tape. I bent the two coathangers into the C-shapes mentioned earlier and hung them in the final position. The next bit is tricky – you need to knot your fishing line to each arm of the coat-hangers whilst ensuring you keep the line parallel and the hangers level. I found standing on the metre stick was very helpful!
That’s your invisible ‘wall’ set up – now for the wall display!
Attach your first two Mr Men cards between lines 1 & 2 and 3 & 4 by wrapping tape around the ends of the cards, encasing the line at the very end. Attach your third card above the first row between lines 2 & 3. Keep repeating until you wall is complete. I decorated the hangers with extra cards.
Safety
As you can see, my display is hanging off a metal stair case. For safety, I flattened the coat-hanger hook against the stair rise and sealed it with duct tape so no one will catch their toes.
Observation
I’ve already seen a student stand in-front of the display and discuss it with her teacher and lots of students are actively looking/reading as they go up the stairs. It’s only been up two days and it is a talking point. It’s sure to grow as there are more Mr Men & Little Misses that I haven’t yet printed.
My (not so little) monkeys in KS3 have been discovering and using Pythagoras’ Theorem. They usually deal with open questions quite well, however this one took a fair bit of discussion. This challenge requires no worksheets or fancy resources, just write it on the board. The context is modified, but the essential question remains the same.
Challenge
Zookeepers have attached eight bolts in a cuboid formation (sides 3m, 4m and 5m) to the trees in a chimpanzee enclosure. The keepers attach taut ropes between the bolts for the chimps to climb on. Each length of rope is individually cut. No length is lost in knots.
What is the maximum length of any one piece of rope?
What is the total amount used, if every corner is joined without duplication?
Solution
The first step to solving it is a good diagram of the problem. Students then need to break it down into triangles. The solution has several levels of difficulty:
Total of the edges of the cuboid
Total of the diagonals on the faces
Total of the diagonals across the inside of the cuboid
This diagram demonstrates the levels of the problem – have fun!
Joey? Why yes! Joey Tribbianni from ‘Friends’ (random 90s TV reference). When the friends came to London, from New York, Joey demonstrated his unique technique for navigation:
He jumps into the map! And that is what my students did for vectors.
In the first lesson we started looking at the basics of vectors. I found this PowerPoint from TES resources to be really good for starting discussions: Introduction to Vectors by rhemsley
In the second lesson, we started to solve problems and moved outside.
Objective
To develop problem solving skills with vectors.
To understand how vectors relate to more complex diagrams
Resources
Chalk (coloured is good)
Vector questions from a textbook, worksheet or exam database
Mini whiteboards – optional for working out/calculations on the move
Activity
I drew one side of a regular (ish) hexagon on the wall (I really would like an outside chalk board). We labelled the ends A & B and the vector joining them was a. I decided to use a different colour chalk for each vector to make them stand out.This was followed by vector b (joining B & C) and vector c (joining C & D). To be honest, I had to get a student to draw in D and the line – I’d accidentally* drawn the diagram higher than my arm reach.
(*I’m over 5ft 6in, but my lively lads are nearly 6ft – gallantry meant they felt they had to help and hence engaged with the task very quickly!)
Back to the problem:
This hexagon wasn’t going to draw itself, but which of the existing vectors to use to create point E? I explained that vectors a, b & c are our building blocks, which helped us move on.
The students were quick to identify vector a. They were very picky about the direction too. My gallant helpers added it to the diagram. We used the same logic to finish off the hexagon.
The students then went away with their worksheets and drew out their own versions of this diagram. As I walked around there were some heated debates as to which vector went where and in which direction. They addressed many misconceptions before they even looked at the question – it comes back to the old rule of ‘ Write down what you know’. They’d already answered questions on the diagram that they hadn’t yet been asked.
The questions were based on this diagram:
They started easy and quickly moved on to trickier concepts:
Why can’t you just invent a letter for BE?
Does it matter which route you take around the diagram?
Can vectors be simplified like algebra?
All of these questions can be solved by ‘doing a Joey’.
When I teach vectors I always use the analogy that vectors are like a one-way system of roads. For example, the vector from E to B is drawn in, but has no specific vector – this is like a closed road, you must detour down the other roads to get there.
As you walk down the other roads (vectors), are you going the correct way?
If the answer is ‘yes’, just make a note of the vector and carry on.
If the answer if ‘no’, then a minus sign gives you the permission to go the wrong way – write the the vector with a negative. (This then leads to the follow up discussion of why this works through use of column vector examples)
There is more than one route. What do you chose?
Clockwise or anticlockwise?
EDBC or EFAB?
Walk them both and see what happens – you can see that the vectors are the same, just arranged differently.
Finally, when you start to compare different routes, you can see that vectors cancel out, just like algebra. In fact, it quickly becomes clear that basic rules for simplification still apply.
Student Reaction
The sight of pupils walking around diagrams looked like something from a Monty Python funny walk sketch. As we walked back to class, after half an hour in the sun, I overheard two different groups of students. One group said: ‘That was a really good lesson’ and ‘Yeah, I enjoyed that!’ – that may have been the sunshine though. Another group however said: ‘I get it now. I didn’t get it last lesson the board, but now I get it!’ – and that wasn’t just about the sunshine!
We may only be a few weeks into the summer term, but I can safely say this is my book of the term. A gently inspiring, pick up a pencil and relax book.
‘This is not a Maths book’ by Anna Weltman (RRP £9.99) takes all the beautiful ideas we maths teachers wish we could use more often and collects them into a wonderful book.
The pages are full colour and the paper quality is excellent – almost tactile. And the best bit is that no-one can tell you off for doing students’ work or wasting your time making that wall display just right. It’s your book … just for you … you can be as possessive and OCD about the colouring pencils as you want!
It would make a good end of term prize too – a bit different to the usual geometry set or calculator. If you are a forward planner, you could even buy this book for your mathematical someone in a departmental ‘Secret Santa’.
*HEALTH WARNING*
You may require nerves of steel to complete this dramatic construction of a distance-time graph. A mental swear box may also be handy for everytime you resist the urge to say what you are thinking. Strong coffee is not advisable as you want to be the image of serenity, not a jittery wreck.
Ready? We shall begin …
Aim
To construct distance-time graphs from collected data and interpret the speed from a graph.
Equipment
Metre sticks or tape measure
Open area outside
Pencils
Paper (squared/graph etc)
Ruler
Calculator
Stopwatch (or mobile phone app)
Chalk (optional)
Spreadsheet (optional)
Activity – in theory
Group your students in threes. They will rotate roles between runner, timer and recorder.
Pick four points in your school yard that are a reasonable distance apart. Chalk X’s and A to D next to them. Your graph will start at A and end at D. If you have the space you can create more than just four points.
Students are responsible for measuring the distance between A & B, B & C and C & D. These are the three activity stations.
Students take it in turns in their groups to run (walk, hop, dance etc) between two points. The time for each student at each station is recorded.
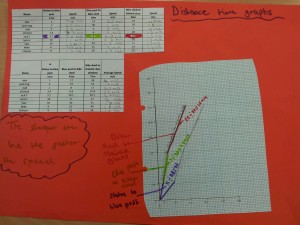
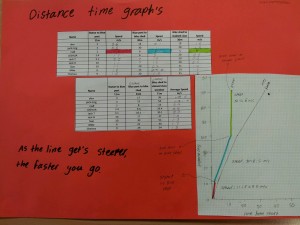
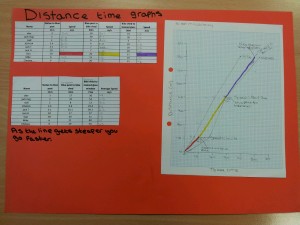
Once the data is collected, students gather the information in a table – cumulative time & distance columns will be helpful for plotting a distance time graph.
Each student draws three graphs, on the same axes, to represent the speeds of their group.
Each student then calculates their speed for each station. They can compare their calculations with their group and what is going on in the graph. Hopefully they will deduce that the gradient of the graph represents the speed.
Activity – in practice
Where to start?
Please … don’t be disheartened if your activity starts like mine did! We got organised and went outside. I designated groups to stations and they started measuring, moving onto the next station when they were done.
One group came up to me and complained that the distances were all the same. Rather than hold onto the end of the tape measure at the start, then measure, this group put the end on the ground, spooled out the tape measure and walked to the next station – trailing the end of the tape along the floor.
A second group complained that the other groups were spending too long on measuring when they were waiting for a tape measure. I’d counted them out one per group – where was it?
‘Oh, we left that in the classroom’.
Mental gnashing of teeth.
‘Would that be the locked classroom?’ I ask
‘Yeah … we’ll get it’ off run two students
They come back complaining the classroom is locked!
Okay … we get the measuring done. Then they start running and timing. I check on one group and notice they are merrily taking all of their times away from ten minutes. They explain the mobile phone is counting down from ten minutes. Although I was impressed by their ingenuity, maybe changing the phone mode would have been more appropriate.
And let’s not mention the student who, on the final station, accidentally wiped all the results off the mini-whiteboard …
Then a miracle happened!
I collected their data together on a spreadsheet and projected it on the board. We discussed any anomalies and how we would progress. We decided neat printouts would help. They drew their graphs, colour coded their data and observed the gradient link to speed. I was very impressed by the speed at which they grasped this concept and proud of their (eventual) independent work.