Category Archives: Resource

355. Toyota logic

My fabulous colleague, Mr G, has recently been to the local Toyota factory to find out about the Lean model.

The key principles involve efficiency of process. He told me about a school using the Lean model that had tape diagonally along the spines. Students put their folders back in order and the teacher can instantly see if a file is missing. Genius!

Now I happened to be about to cover my textbooks with sticky back plastic. I put duct tape around the spine before covering them. Each book has tape 1cm lower than the previous.

Now you are thinking – that looks nice, but it will never work.

I’ve got news for you – every time I use the textbooks with my class of 34 Year 9 students, they put the books back in order. On the first day I made a big deal of how tidy the books looked and challenged them to put them back tidy. And they did – every lesson!

352. Functions refresher

We recently finished teaching the AS Maths syllabus to Year 12. My colleague and I decided how to split up the start of the second year of the course. I’m starting with the modulus function.

I took one look at the skills needed at thought “Uh-oh”. The students are going to be out of practice with this. They are a lovely group, with a wide range of ability, but we’ve been very focussed on Applied Maths recently.

Option A: Go for it and patch up the vocabulary as we go (getting very frustrated – they knew this last October)

Option B: Break them in gently, recap the skills and vocabulary and extend them further

Option C: Reteach the work from last October.

Yes, you guessed it. I went with Option C. I found a brilliant task on piecewise function graphs on the Underground Maths website.

Image credit: https://undergroundmathematics.org/

There are four graphs given. The basic task is to interpret the functions relating to each graph, through description or function.

I photocopied the graphs onto card and sliced them up. Each group had a set of cards. One person described a graph and the others had to accurately draw it. Some students went straight onto squared paper, others drafted it out on mini whiteboards. They repeated this until all the graphs were drawn and everyone had had a go at describing (the describer stuck in their card, so that they had a complete set). Whilst they were doing this, I moved around and encouraged the use of mathematical vocabulary.

Note: it was interesting to see how many students had forgotten the significance of open and shaded circles to denote boundaries of inequalities.

The second task was to match up the function cards with the graphs. Once again, accuracy was key as not all graphs had functions and not all functions had graphs. There were also some that nearly, but not quite matched. This activity really brought out the key skills relating to domain, range and function notation that I was looking for. The extension task was to complete the missing pairs.

But, did it work? I can confirm that the following lesson the class made very good progress investing the modulus function and it’s graph, even going as far to solve equations. They knew what the notation meant, how to plot it and how to interpret the graphs.

I really like the Underground Maths website as it has great resources, good support material and always makes students think. Most of the time it gets teachers thinking too!

350. Quadratic factor puzzle

Back in posts 95. Quadratic puzzles and 322. Quadratic puzzles I’ve looked at how to approach factorising and solving quadratic equations/expressions in a ‘gentle’ way.

Time to take off the kid gloves!

I have an awesome class of 13 year olds who are starting out on quadratic manipulation. They are great, but there are a significant number who rush their work and skip steps of working out because they ‘know what they are doing’. Really? Let’s see …

I gave the class twelve quadratic expressions and asked them to factorise them, then to spot any common themes. What I didn’t tell them was that all of the factors used were combinations of x, 2x, +/-1 and +/-5. If they were sloppy with their attention to detail, their solution would look like the solution to a different expression. Essentially a difficult easy task.

It soon sorted out those who had at true understanding of factorising a quadratic from those who’d lucked their way through easier questions.

I’ve shared the presentation and pdf version below. I’ve added in two slides where you can cut out the expressions to use as more of a card sort. You’ll notice that there are no 4x^2 expressions – I was focussing on solutions with only one x co-efficient greater than one. Although I used this as a starter, you may wish to use it as a longer activity, depending on your class.

Solving quadratic expressions (PPT)

Solving quadratic expressions (PDF)

347. Maximising space

As you start to plan the layout of your (new) classroom, I have a handy little tip for you. It’s really useful to have key dates up in the room, but where to put them. Print them out and you lose valuable wall display space, odds are you’ll forget to update it during the year. Put it on the whiteboard and you risk some scamp (or over enthusiastic colleague) wiping them off the board.

How about a blackboard?

This is sticky back blackboard vinyl that you can get very cheaply from places like ‘The Works’ or Amazon. You can cut it to size and put it on any flat surface. I’ve put it on the back of my desk and used chalk pens. Once they dry they take some effort to remove.

Students have already noticed it and have said they like having a big picture of what’s going on next term.

345. Practical percentage skills

It’s perfectly obvious that fluency in the use of multiplication tables directly impacts students ability to divide. This grows into confidence with algebra and reverse operations. Students are able to see the links between the concepts. Our understanding of the importance of such skills is part of the success of programmes such as TTRockstars and Numeracy Ninjas.

Why is it then that so many textbooks, websites and resource banks keep the manipulation of percentages as separate skills sets? Percentage increase / Percentage change / Reverse percentages. We know that when concepts overlap, fluency increases when these links are pursued. So that’s what I set out to do.

I have a bright Year 8 class and started working on percentages with them. It didn’t take much to have them confident using equivalent decimal multipliers to find percentages of amounts. Using a multiplier for increase/decrease was a walk in the park. Then finding percentage change came up. Over the years I’ve seen a lot of students get very confused with half remembered methods:

“Which do I take away?”

“What number do I divide by?”

“Is this calculation the right way around?”

I tend to teach new value divided by old value and interpret the answer. It got me thinking – why am I teaching them this? They can increase by a percentage using a multiplier, why can’t they rearrange their working to find the actual percentage? Same goes for reversing a percentage.

After a good discussion, I used this worksheet to recap and develop their skills:

Percentages Linking concepts questions

Percentages Linking concepts answers

Warning: “Original Amount” section, question (d) is a tricky one.

As with all new approaches, it’s always good to see if it worked. I set the following task from Don Steward’s website:

MEDIAN percent problems

I have GCSE students who wouldn’t know where to start on those questions, yet my Year 8 with their ‘have a go’ attitude were absolutely awesome. I’m definitely using this method again!

342. Revision jotters

With the exams looming large, I thought I’d share how my class have been revising. To give you some context roughly a third of the class are doing Foundation GCSE, aiming for at least a Grade 4. The rest are doing Higher and aiming for a Grade 5 or better. We have three, one hour, lessons a week. I’m rotating between doing an exam paper, a whole class revision activity (eg a revision clock) and tiered revision.

I know if I tell the students to revise independently the results are going to be mixed. Some will be brilliant, some will be more laid back. To resolve this I pick a topic (or two) from each tier that I know they need to improve on from or that they have requested. It’s helpful if there is a theme to the work. I’ve recently done things like y=mx+c (F) with plotting inequalities (H).

Now the genius part: PixiMaths revision jotters

How to run the session

Photocopy a big stack of revision jotters. If you are doing black and white copying, use the b&w version. We requested the b&w version and, because PixiMaths is awesome, it is now on the website.

Clearly put on the board which topic each tier is revising

Eg Foundation: exact trig values, Higher: trig graphs

Give students 5-10 minutes to fill their revision jotters with everything they know. Have textbooks or maths dictionaries available to fill in the gaps. You may find that Higher students want to do the Foundation topic too – no problem, just make sure they have two jotters. Due to the complexity of the Higher topic, they will need more time to make initial notes.

My students are allowed headphones in revision sessions. At this point it’s headphones in for Higher and out for Foundation.

Do a skills recap on the board (exact trig values), with maybe an exam question too. Students can ask questions on the topic and add to their jotter. Then have a worksheet for students to do eg Corbett Maths or KeshMaths GCSE exam questions booklets. They can refer to their revision jotter or scan the Corbett Maths QR code for extra help.

Swap over. Headphones in for Foundation and out for Higher.

Repeat the process for Higher, with drawing trigonometric graphs. Issue an appropriate worksheet.

Once you’re done, make a judgement call. Are there students who could push it further? Maybe transform a trig graph or problem solve? Go for it. Foundation are busy, Higher are busy, spend some time stretching your most able. Every mark counts.

A huge thank you to PixiMaths for the revision jotters (and everything else).

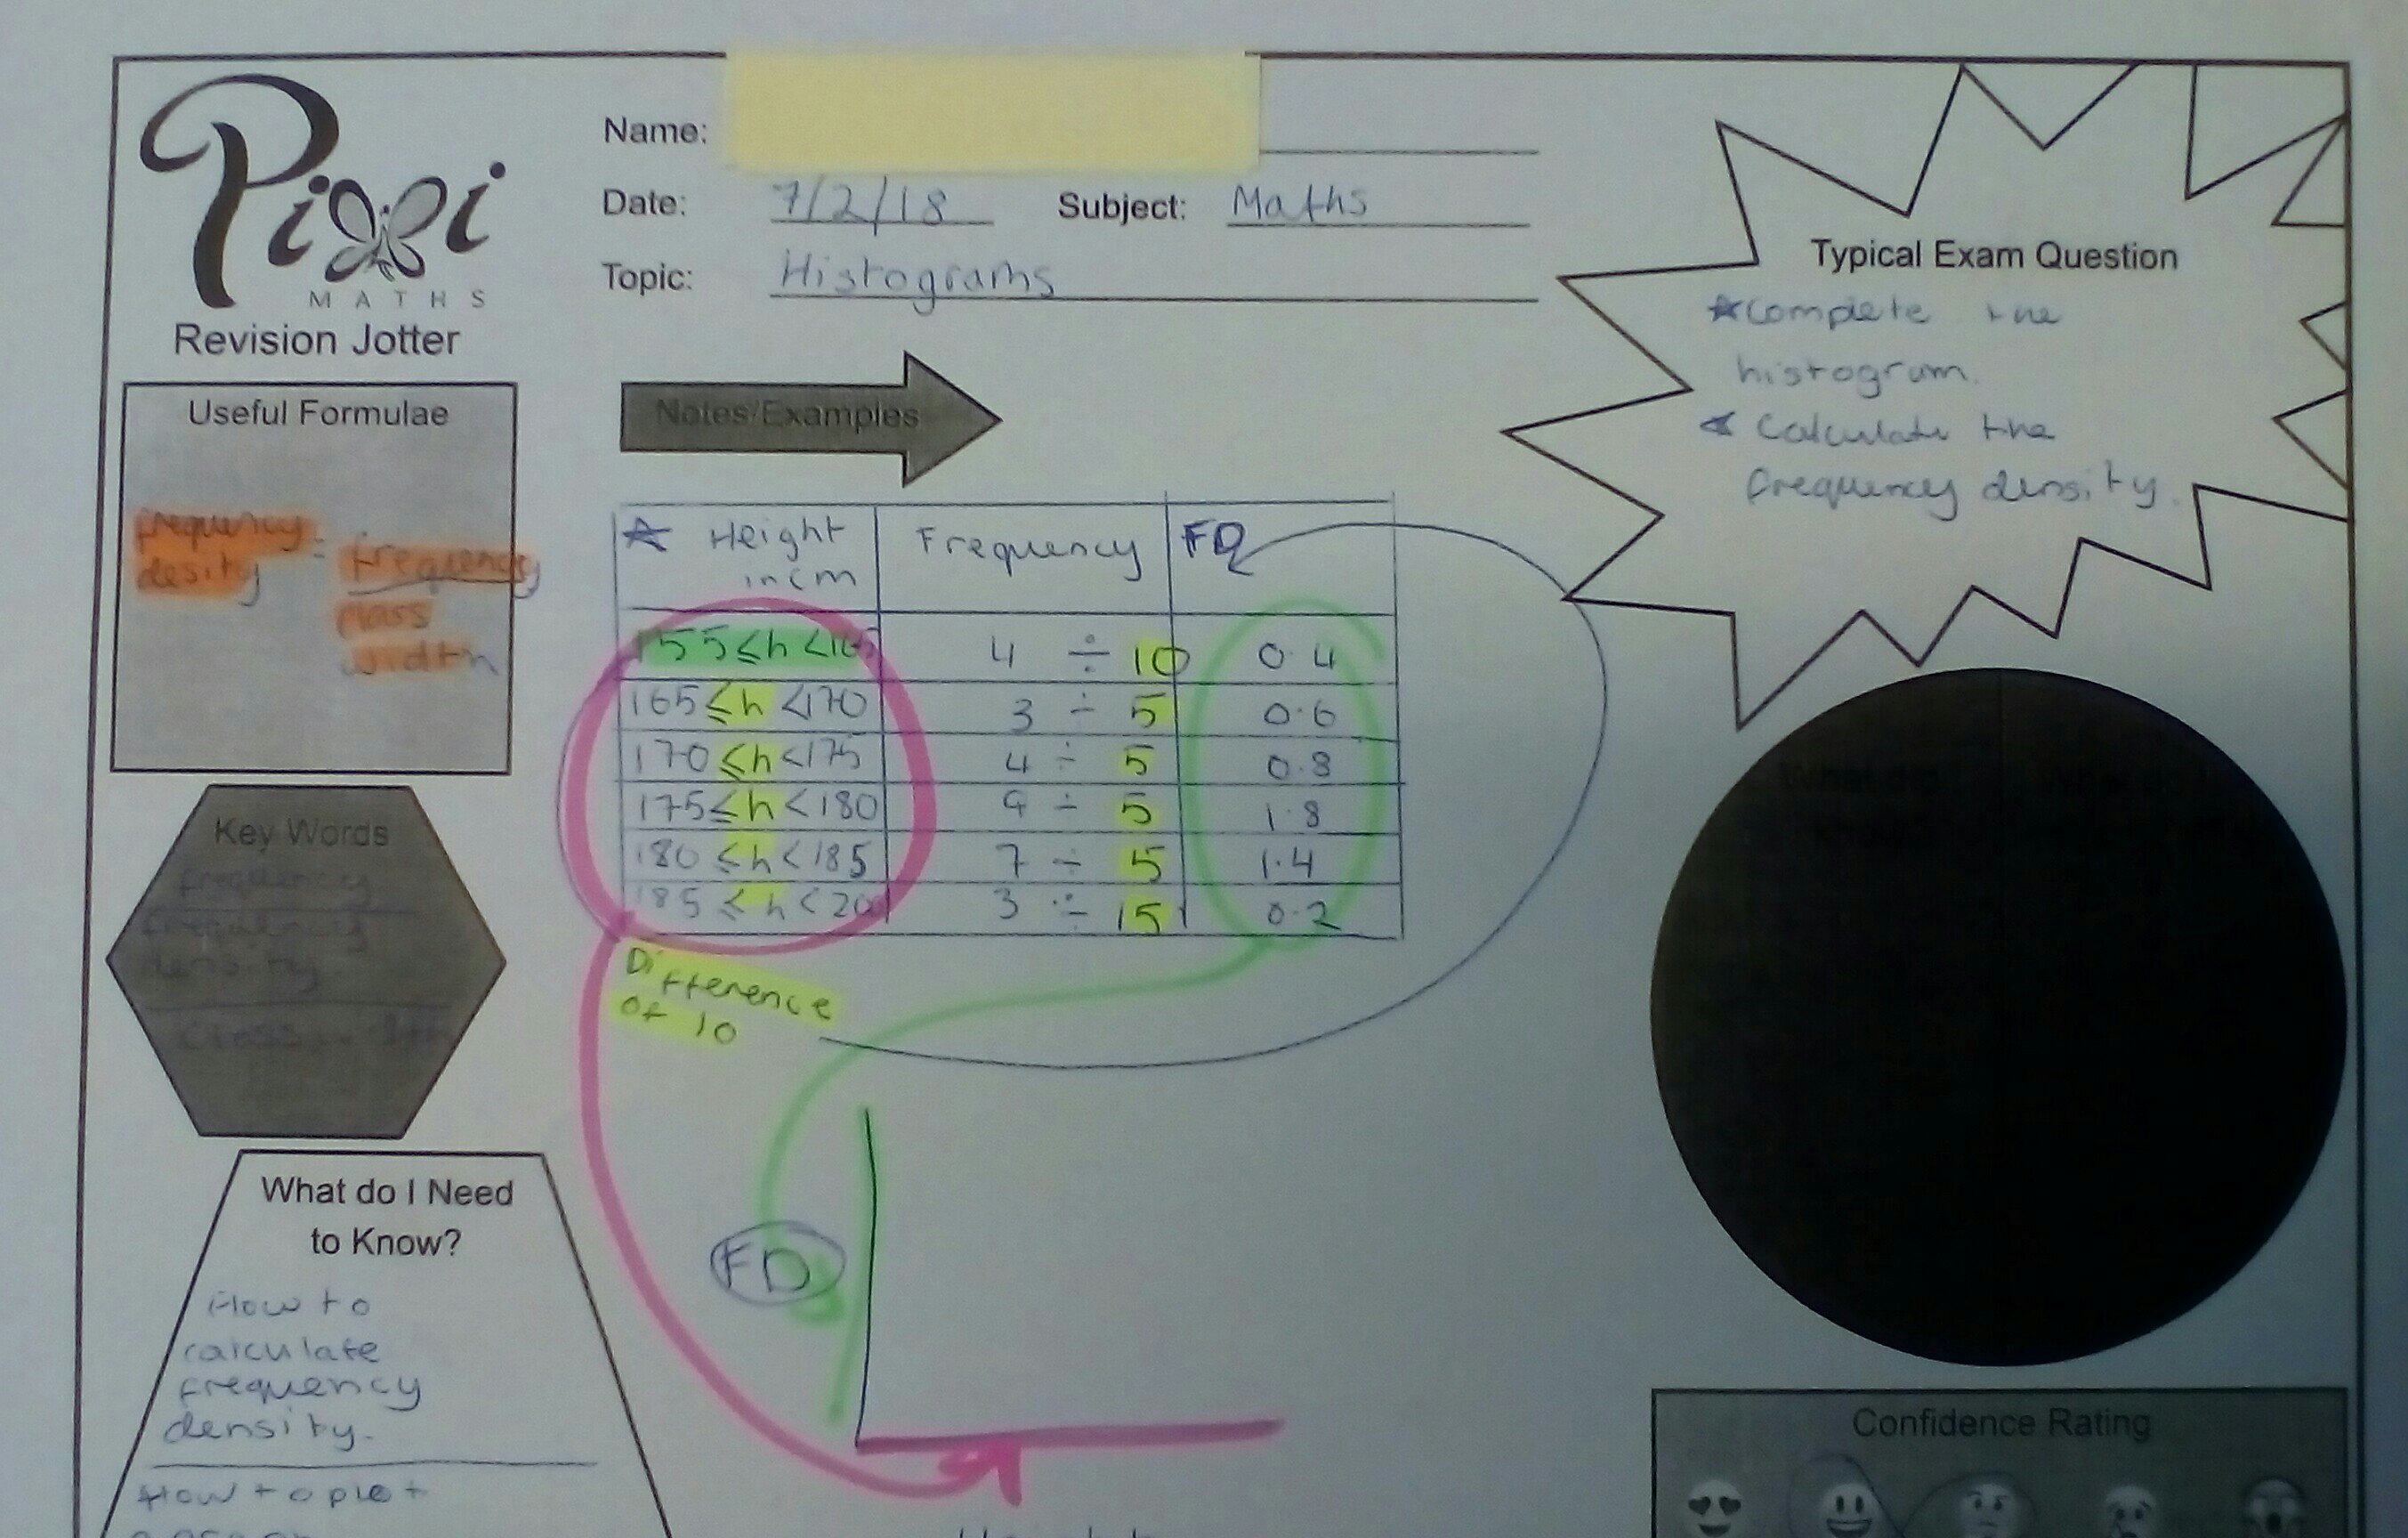
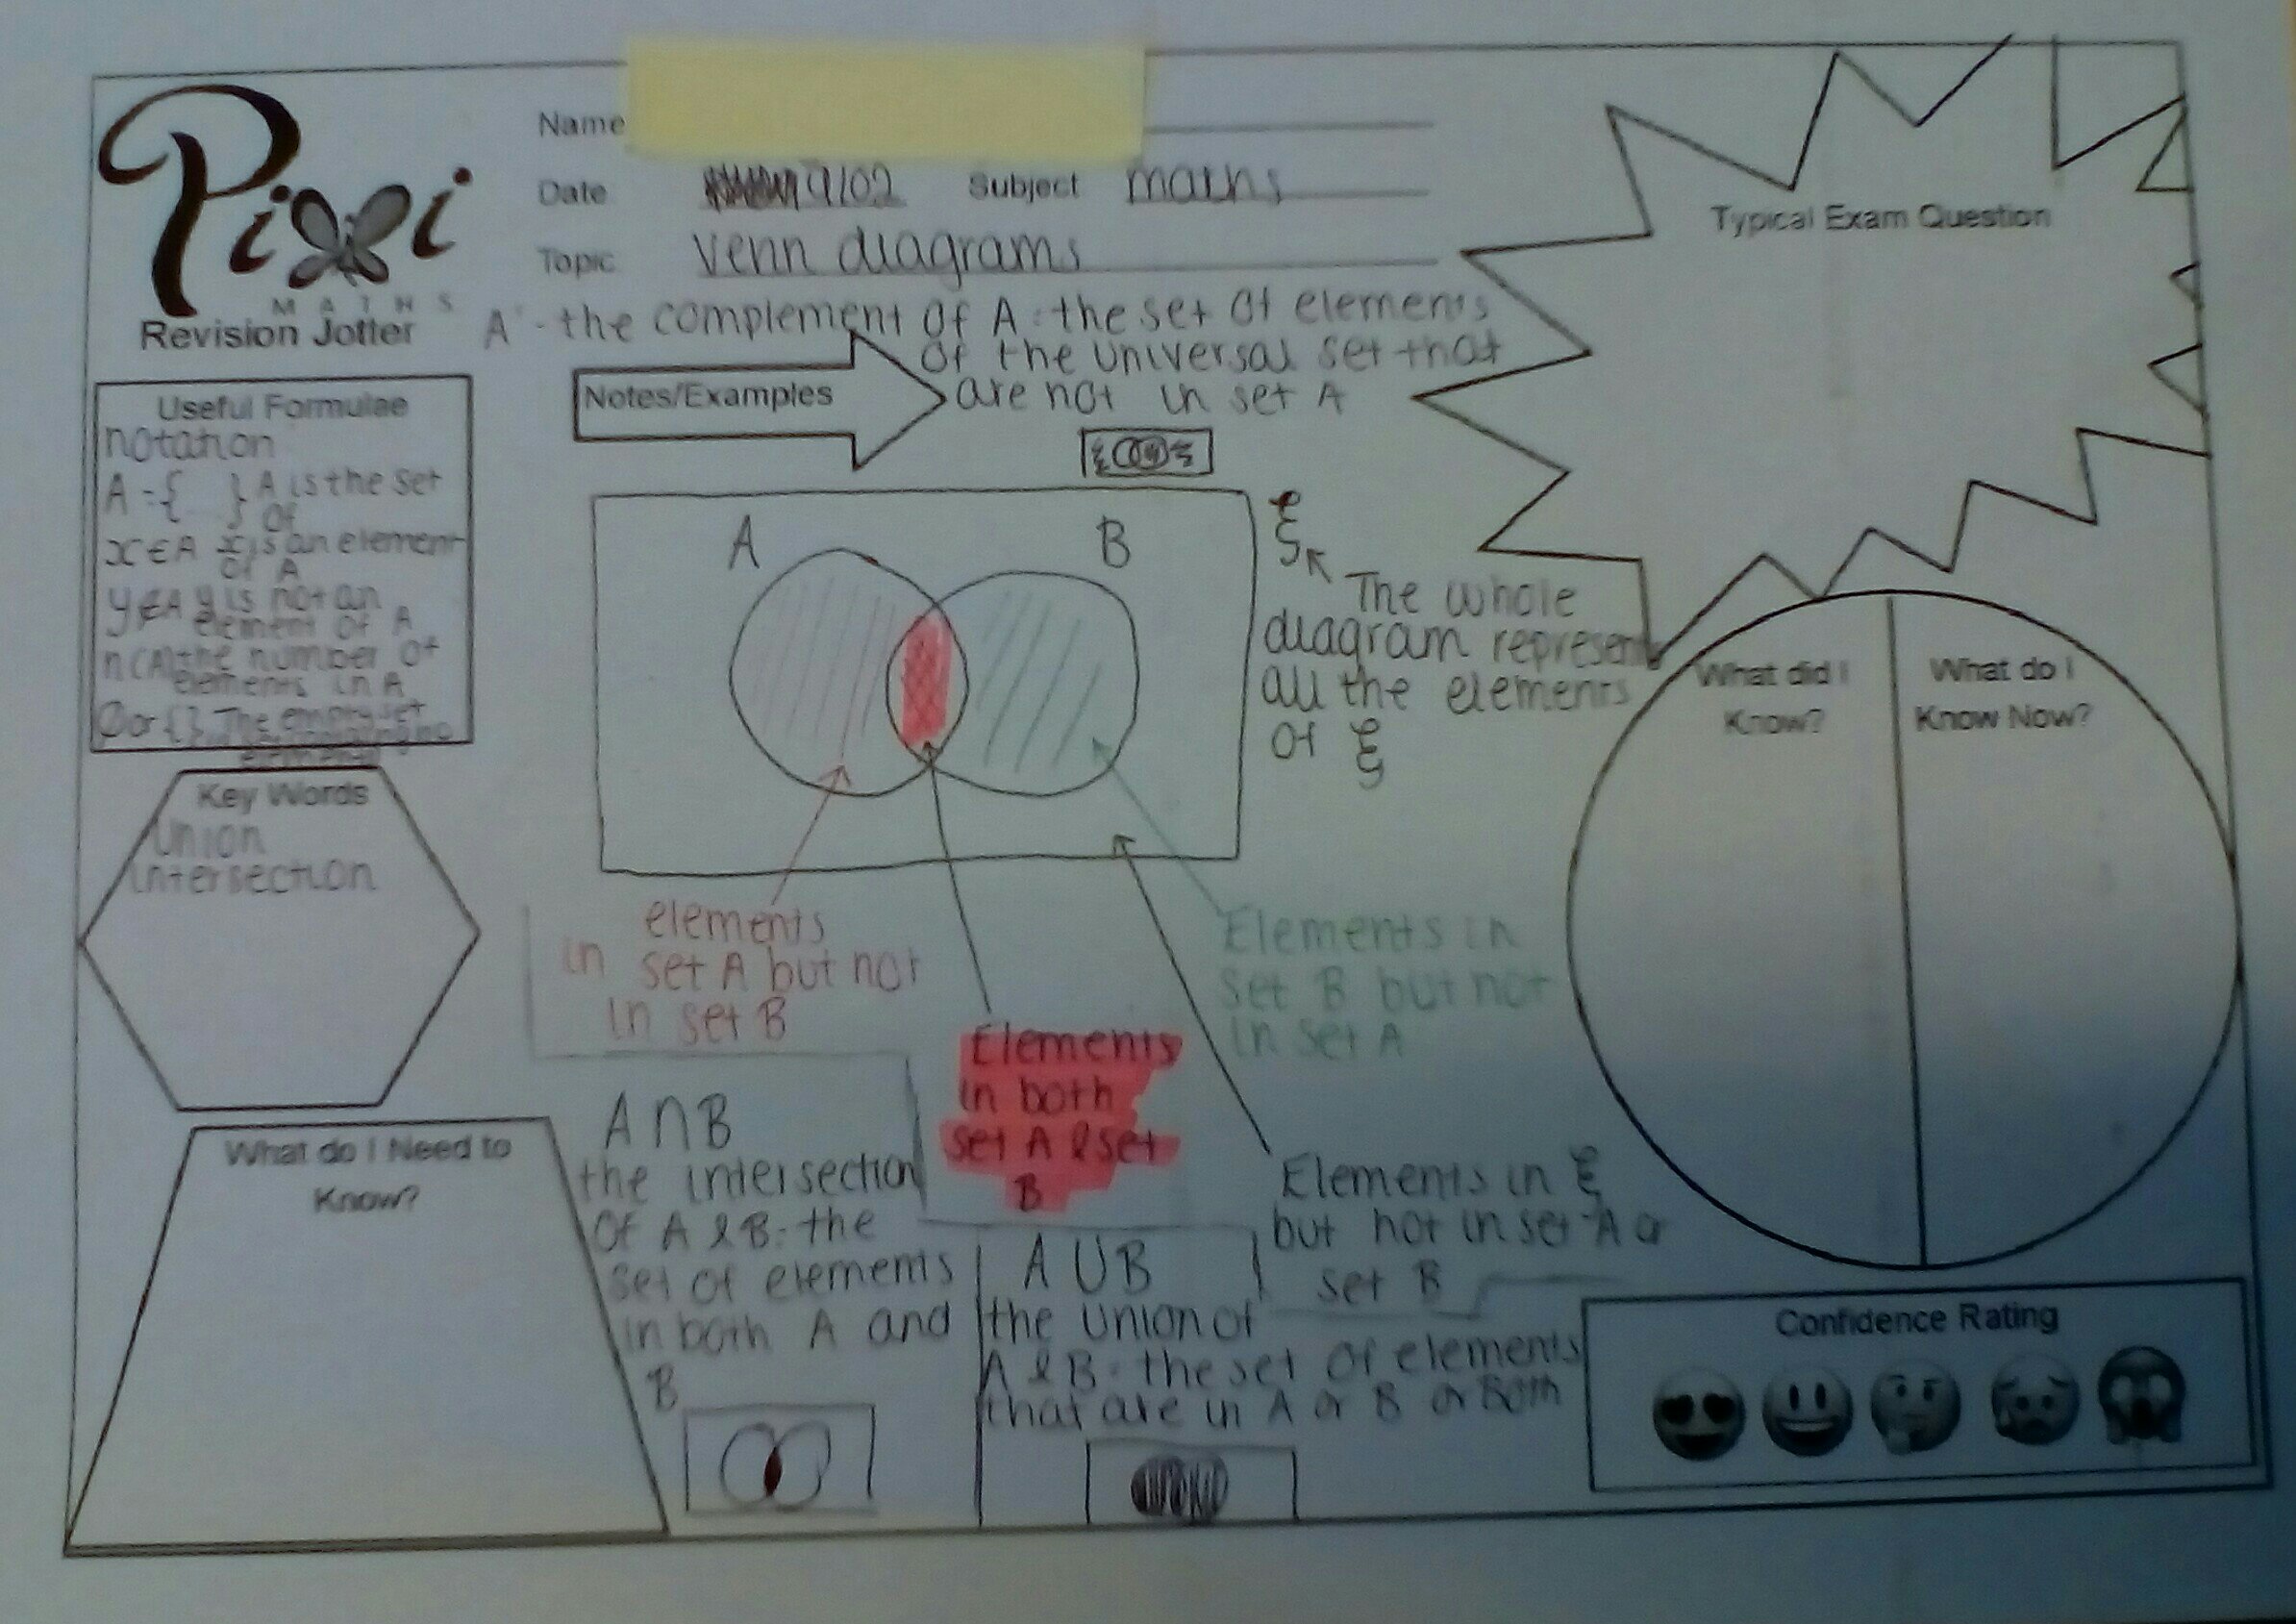
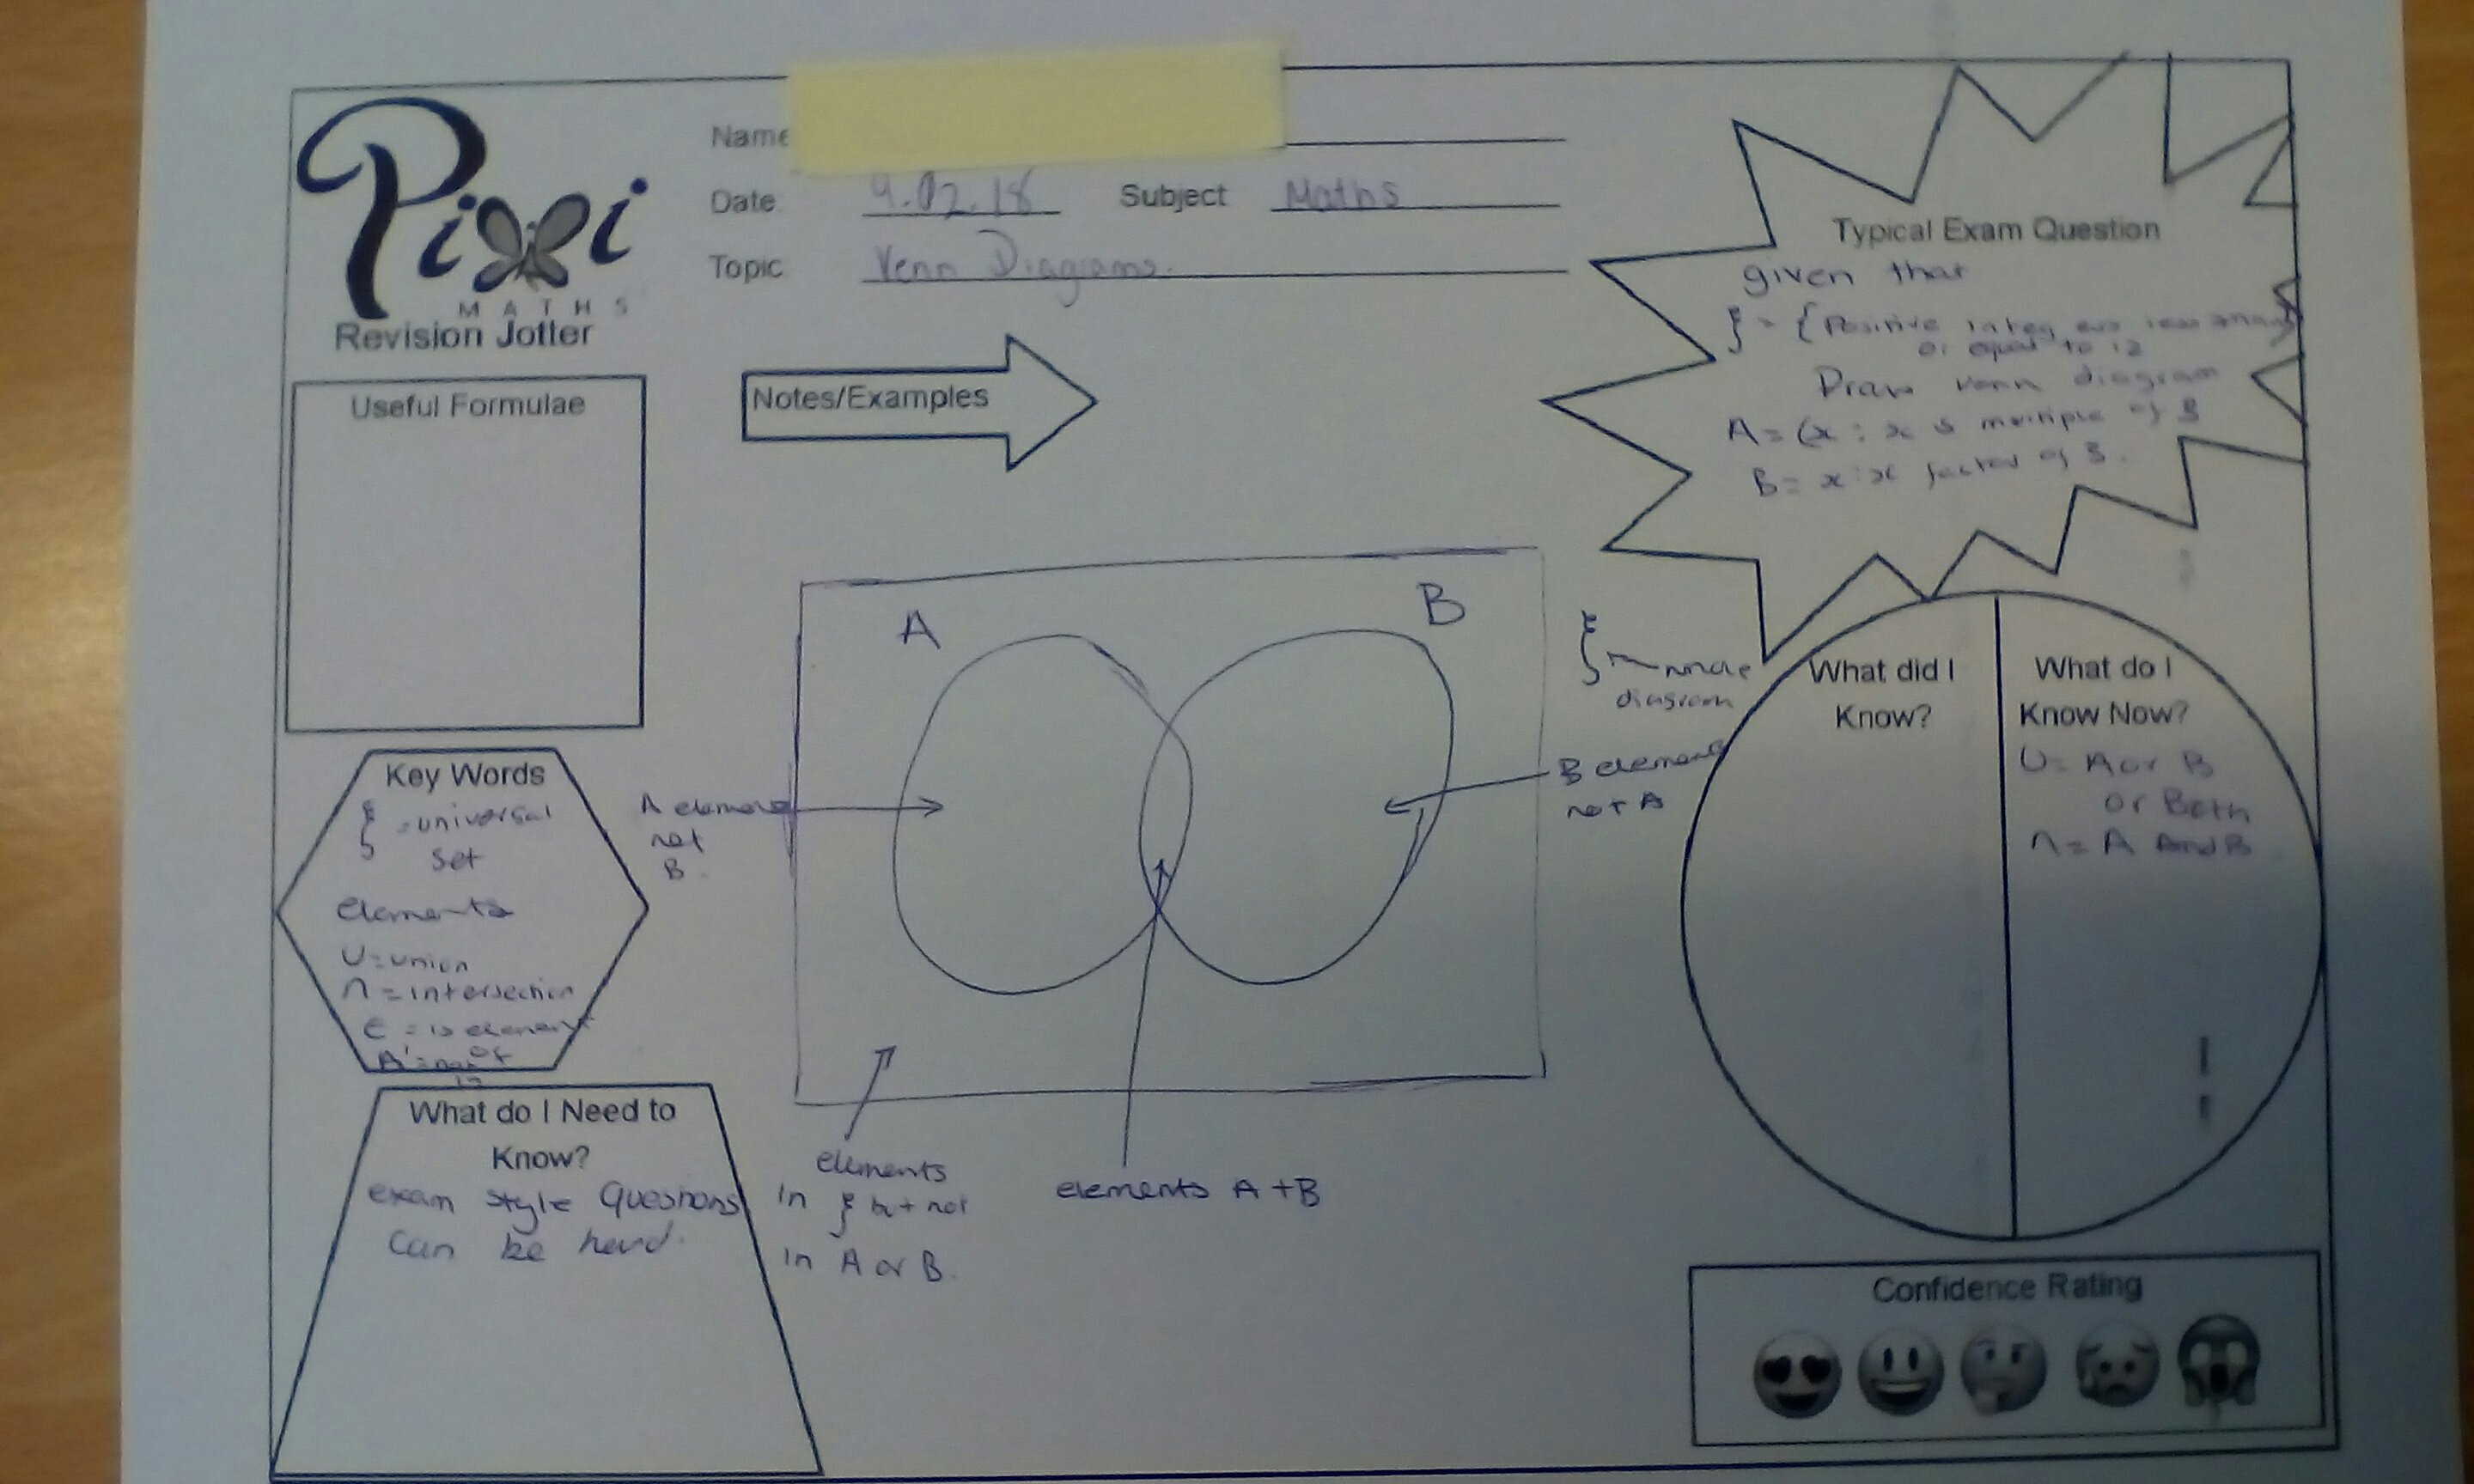
Examples of students’ work

Shared with permission of students. You can see that they have personalised them to meet their needs and some are a work in progress. Also, the b&w jotter photocopies so nicely.

338. Grappling with graphs

Have you noticed that textbooks are okay with graphs, until you need some interpreting graphs questions?

Image Credit: trustedreviews

I thought that mobile phone tariffs would be a good starting point for comparing fixed charges and rates. Using the iPhone X as a starting point, I’ve put together a discussion starter and couple of additional questions. All the tariffs are actual offers available at the time of writing.

You could start by looking at the graph and asking students what they notice, you could give them the tariffs and ask them to generate graphs or you could give them the data and ask them to plot the graph and derive the tariffs. It’s up to you!

The graph is deliberately vague so that students can discuss trends without getting obsessed by the detail of the numbers. Everything is downloadable below.

iphone X tariff graph

Iphone X mini investigation

Interpreting graphs