Category Archives: A-Level

304. S1 Revision Clock

If you are a regular on Twitter you may have seen some of the many revision clocks being shared. Basically 12 questions, 5 minutes each. Students can revise up to twelve different skills, under timed conditions, hence improving exam technique. My favourites are from the lovely Mel & Jo (@just_maths & @mathsjem). Not to be confused with Mel & Sue! (Random British humour/baking reference).

teaching_wall_clock_cafepress
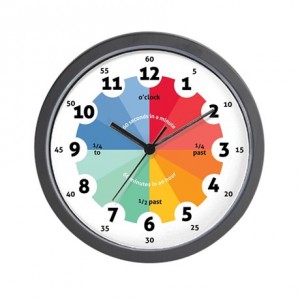
Image credit: www.cafepress.co.uk

  • Mel’s blog post on revision clocks can be found here: Just Maths
  • Jo’s collection of revision clock resources can be found here: Resourceaholic
  • Don’t skip these links – they are good!

Now I used one of the C2 revision clocks with Y12. It was an eye-opener: some students were excellent at managing their time, some rushed the questions and wanted to move on (hence not checking their work and making daft avoidable mistakes like they have all year!), others gradually improved their time efficiency and a few ignored the time constraint and sat stuck on one question, when there were so many other questions they could have excelled at. Constructive feedback all round!

So I decided that we would do the same for Statistics. I put together a set of questions from Edexcel testbase – full credit to them is given on the sheets. They challenged my students due to the need for accuracy in calculations and the sheer laziness of not wanting to look up formulae. If you want to do the same, just download the resources here:

S1 revision clock (pdf)

S1 revision clock Answers (pdf)

You will also need to print the answer sheet onto A3: Answer sheet courtesy of JustMaths

302. Log Proof Puzzle

If you can guess where today’s blog image came from you obviously consume too much damn fine cherry pie and fresh coffee!

log lady

Image credit: Pinterest

You may have guessed that the topic of this post is logs. If you are introducing the rules for adding and subtracting logs or revising them, I have just the resource for you. It’s a basic proof of both rules with a twist. The instructions are in the wrong order and you must rearrange them into the right order.

Easy!

Are you sure?

For those of you who have a student or two who rush everything and don’t read the instructions there is a sting in the tail. One of the lines of proof is a tiny bit wrong. The methodical student will find it, the one who races through may end up changing more than one line – hence breaking the rules.

Have fun!

Proving log rules for addition and subtraction

Answer: It’s the ‘Log Lady’ from the cult classic ‘Twin Peaks’!

297. Crabby Functions

I take no credit for this ‘aide-memoire’ – it comes from a most delightful and hardworking student. To quote a colleague “She is the poster-child for the benefits hard work”.

Let’s call this student Natasha (not even close to her real name). Natasha had been struggling to work out the difference between graph/function transformations, in particular f(x+a) and f(x)+a. Which way did the graph move? How could you tell? Then she had a brain wave:
image

She drew little Y shapes on the brackets:
image

One of the brackets now looks like a little crab:
image

And we all know crabs move sideways – so it most be a horizontal translation!
image

Simple!

Logical!

Genius!

Thank you Natasha!

295. I know how to integrate, but which rule to use?

You know that point when you’ve covered the Integration content in A2, the class can do all the different forms and then you set mixed questions … it’s like it’s in a different language. All that wonderful knowledge seeps out like water in a sieve. There must be a help sheet or tool that gives students a starting point, until their confidence and experience grows?

core 4 integration flowchart

Rewind to proving an integration rule. I was discussing a textbook proof of an integration rule with a student and I just didn’t like it. It niggled in my head that I’d been shown a better method when I was first learning this stuff. After a quick dash to the stockroom and a climb up a step ladder, I found a later edition of the textbook I’d used at A-Level. I was right – the Bostock & Chandler proof was far more elegant and comprehensible. Problem solved!

While I had this book out I had a flick through the pages. A flowchart caught my eye – not a fancy infographic, a proper ‘get the flowchart stencil out’ chart. It basically talks students through how to choose an integration strategy. I could have photocopied the page, but it was rubbish quality when I tried. I believe the book is now out of print, so I have recreated the flowchart page with full credit to it’s source. I hope it helps your students as much as it has mine.

C4 Integration flowchart (pdf)

288. Seriously, when am I going to use this?

Oh, that question … heard often from the mouths of those who will not go on to study Maths at a higher level! But when it’s more able students who can’t see the necessity of fundamental principles … Well, that’s a bit worrying.

M’colleague, Mr D, has nailed the answer to this question. When I say ‘nailed’ I obviously mean ‘stuck’ and he has literally* stuck the answer on the wall.
*Note: Mathematician using correct definition of literally.

Here you go:

image

If you zoom in on this student work, on A2 Differentiation, you can see that he has annotated all the skills used and when you first meet them in the curriculum:

image

Such a simple idea to tie together seemingly unrelated parts of the Maths curriculum. It also reinforces the need to keep all basic skills sharp.

I’d say it was genius, but then I’d never hear the end of it!

286. Make them work!

I recently taught integration to my Y12 class. To make sure I hit all the misconceptions from the previous lesson, I crafted my board example from a function and differentiated it. The final integration problem had a function to integrate and a point it went through, enabling the constant of integration to be found.

The class managed really well with the problem, but I felt from their questions, that they weren’t ready for independent work. Off the cuff, I explained how I’d constructed my example. Then it struck me – get them to use the same process:

1. Think of a function f(x) – the difficulty level is up to you.
2. Pick an x value, then work out f(x), to give you a point (x,y).
3. Differentiate f(x)
4. Give your point (x,y) and f'(x) to a partner.
5. Your partner works through your problem trying to find f(x).
6. Check your partner’s method and solution.
7. If they didn’t get it right, go through their method and see if you can see if they went wrong.
8. If you can’t spot their mistake, did you go wrong?

I thought getting students to differentiate as part of an integration lesson would be a recipe for disaster, but it actually helped consolidate the links between these two processes. The functions that the students thought up were far worse than anything I’d used previously – they had brackets that needed expanding, fractional indices, negative indices, decimal constants etc. The conversations about the work and levels of engagement (competitiveness) between partners was brilliant.

I’d recommend trying this style of activity and I know I will be adapting it for other topics.

284. All tied up – an adventure in skewness

When you move from 2D vector equations to 3D vector equations the biggest challenge is skewness. On plain old 2D graphs if two lines aren’t parallel, they intersect and vice versa. Not so easy in three dimensions … how to explain skewness? Got some string and duct tape? Then let me explain …

Equipment
String
Scissors
Duct tape
A low ceiling
A chair/stepladder/tall student

Step 1
Tape a piece of string from the ceiling to the floor at an angle. Attach a second piece to the ceiling and ask students to position it so it is parallel with the first string. This isn’t as easy as it seems once they realise it must look correct from every angle. Secure the string to the floor with duct tape.

Step 2
Attach a third piece of string to the ceiling. Instruct students to position it so it intersects one of the strings. Secure the end.

Step 3
Attach a fourth piece of string to the wall. Ask them to position it so that it is not parallel to or intersecting any existing string.

(My ingenious bunch took the string out of the door and fastened it to the bannister, just in time for management to thankfully not be garroted)

Step 4
Give the students a fifth string and instruct students to make it parallel to an earlier string and intersect the fourth string. They choose both end points.

If all goes well, you’ll get something like this:

image

You can then explain the differences between parallel, intersecting and skew lines without resorting to iffy diagrams on a whiteboard or complicated geometry software. Students can walk through them and really get a feel for the geometry of the situation.

(When it comes to taking it down, I hope your students are slightly more sane than mine – one of them shouted ‘Argh, it’s a spider web’ and ran through it. Actually quite an efficient way to tidy up!)

Resources
You can download five large print 3D vectors here:
3d vector cards (pdf)
3d vector cards (docx)
The challenge is to find the parallel lines (3 lines), the skew lines and the intersecting lines (2 pairs).

There are more ideas on 3D vector equations here:
211. Hidden Rectangle Problem