192. It’s a stick up!

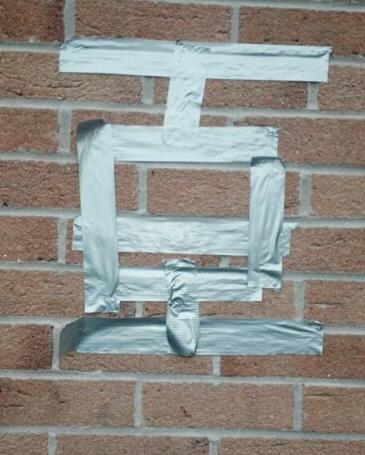
Just a quick picture to share today. My colleague, D, went to the same TeachMeet as me and was equally impressed by the use of gaffer tape in the ‘Big Maths’ presentation.

Today his class were doing box plots and took the idea of averages even further. They made a vertical box-plot on a wall of the class heights. Brilliant!

image

I’m sure this idea has lots of potential.

191. Fallen Revision

Which Maths teachers out there are fed up of stressing the same basic exam/test skills? Come on, there must be more than that? You there at the back. That’s more like it!

Unfortunately, us teachers don’t understand student basics:

* Pencils are for chewing, flicking or breaking.
* Rulers are for poking and twanging
* Working out is detrimental to doodling time
* And as for Units – wasn’t that mentioned in PSCHE to do with alcohol?

Sound familiar?

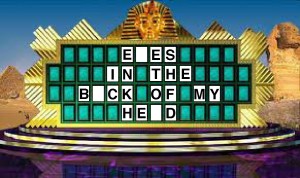
This term I’ve made my class reflect on the basics using a ‘Fallen Phrase’ puzzle template from Discovery Puzzlemaker. The skeleton of the phrase is given, but the missing letters are stacked at the bottom of each column – a bit like a collapsed ‘Wheel of fortune’ puzzle.

Wheel of fortune

The puzzle covers all the basic skills, but it is difficult. My students had to really think what I nag them about, rather than just rearrange the letters.

I just hope all their hard work pays off in their test.

Revision Hints fallen phrase.

Visit the Discovery puzzlemaker site.

190. Visual Compound interest

So you’ve reached that bit of the Number curriculum at the end of Percentages – Simple and Compound interest. The theory is straight forward enough:

  • Simple interest is calculated on the original balance.
  • Compound interest is calculated fresh every year on the current balance.

This shouldn’t be a tricky concept, yet it is frequently  glossed over or partially taught to lower ability students. This is the maths they’ll need to get their head around at the bank in a few years time. So why not replace the scary calculations and rote learning with diagrams, which embed understanding.

Equipment

  • Coloured pens
  • Whiteboard
  • Squared paper
  • Ruler
  • Calculator (Optional)

Simple Interest: Step 1

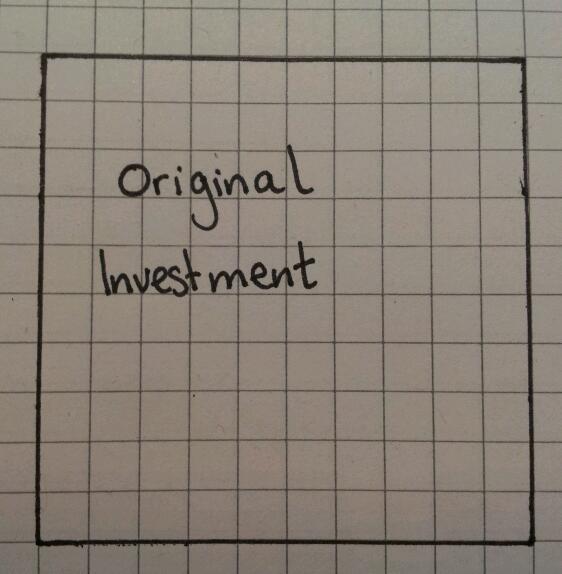
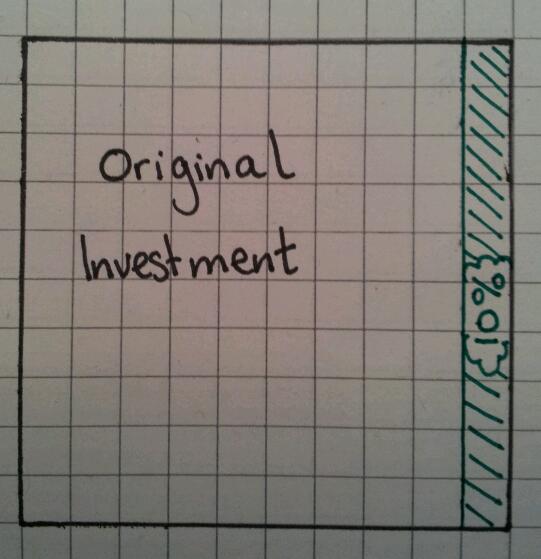
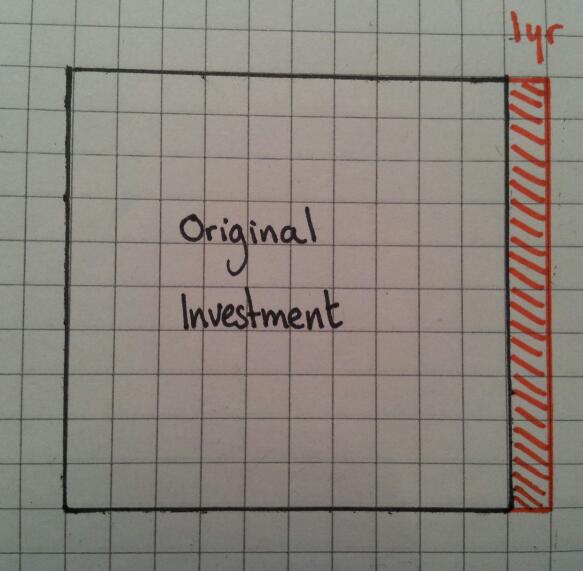
Draw a square which has sides which are a multiple of ten (I used 10×10). This area represents the original investment.

image

Step 2

Assume the interest rate is 10%. Calculate 10% of the area and shade it in lightly. Basically one column, since it’s a 10×10 grid.

image

Step 3

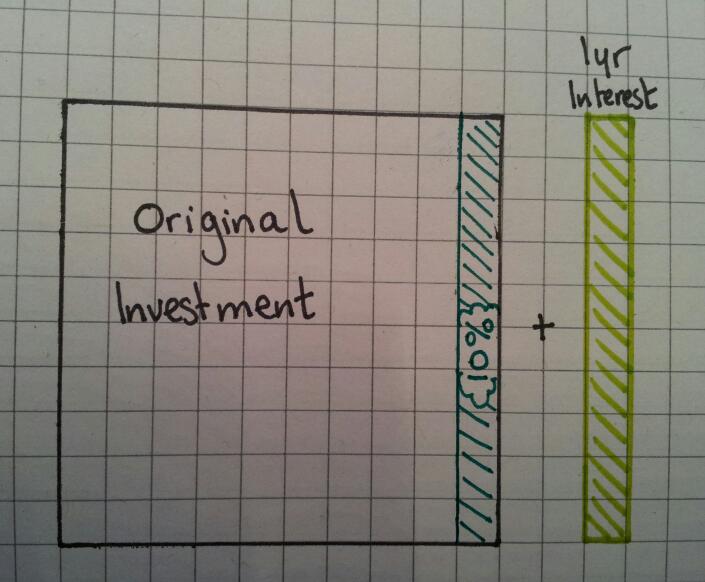
Add on 10% by drawing the shaded area again. This is the 1st interest payment.

image

Step 4

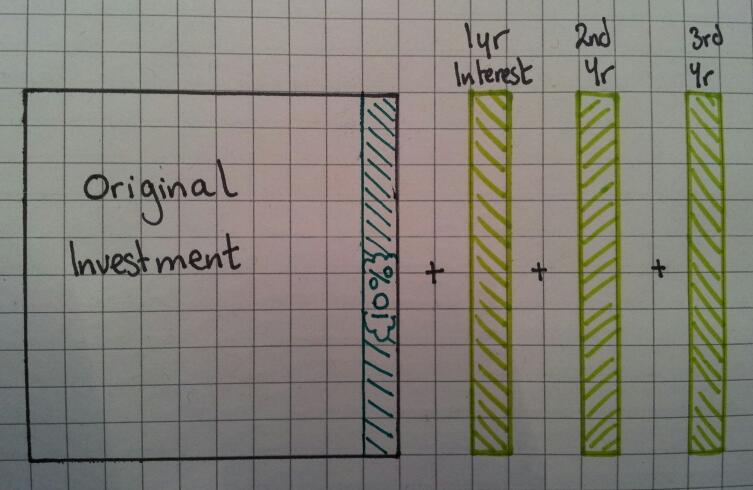
Repeat Step 3 for the 2nd and 3rd years.

image

Step 5

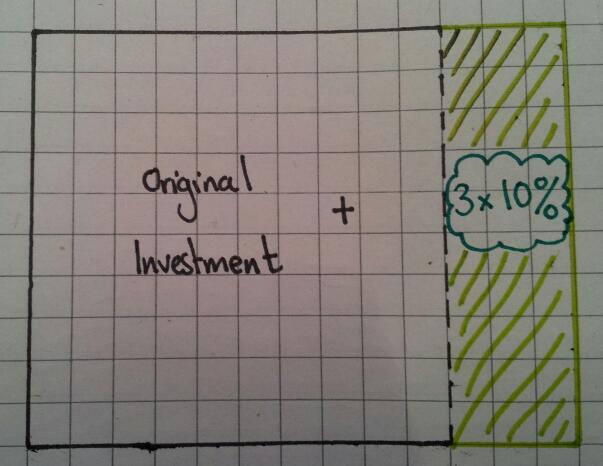
In summary, a simple interest (10%) investment over 3 years is the same as adding on 30%.

image


Compound Interest: Step 1

Repeat steps 1 -3 of simple interest

image

Step 2

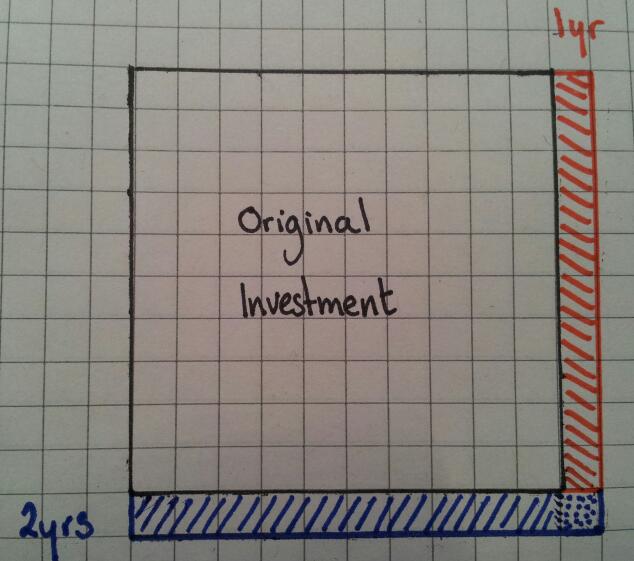
Work out 10% of the height and draw a new row – since the grid is 10 squares high, it’s simply one square high.

image

Notice that the row is wider than the original square – the dotted area indicates the extra interest earned on the previous years interest. This starts the discussion that you are not adding on the same amount each time.

Step 3

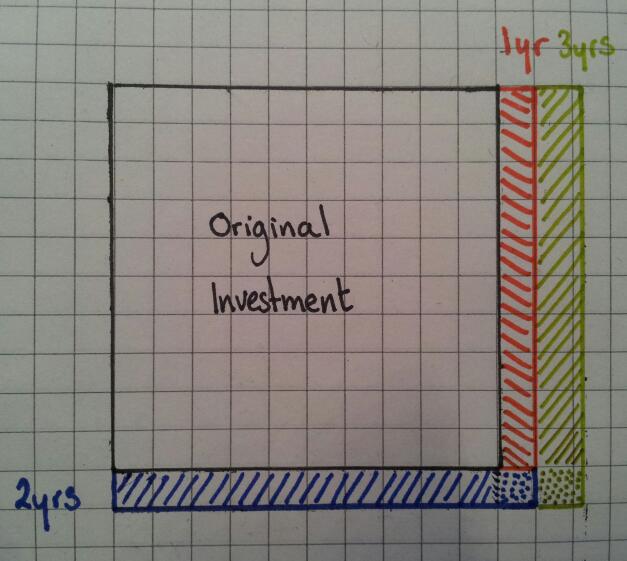
Using the same concept as Step 2, work out 10% of the width of the diagram. This time the width is a little more than one square wide.

image

Once again it’s clear to see that you are adding on more than the last year.


Comparison: Simple vs Compound interest

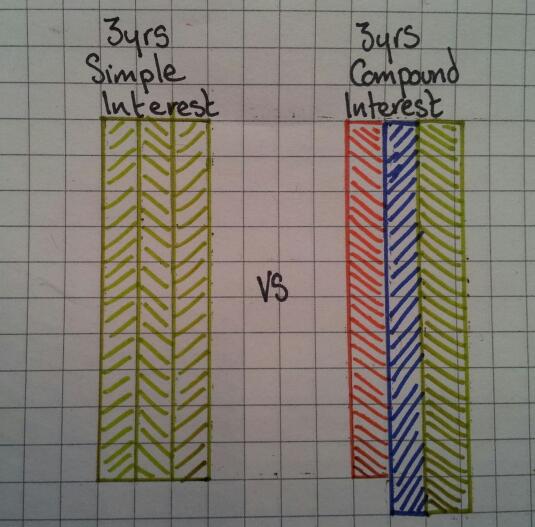
Which is the better investment? It’s pretty clear to see:

image

You can compare these two types of interest using area calculations, rather than long lists of percentage calculations and you can actually ‘see’ the different methods.


189. Revision just flies by

I take absolutely no credit for this cute revision idea – japanese peace cranes for revision.

My class have a test next week and I gave them half an hour of directed independent study. Using their revision lists they could use their notes or textbooks to try questions or create a revision resource. I was expecting posters, maybe booklets … then one of the girls asked if could they make a crane for revision and hang off revision notes. Bearing in mind we have a 2m algebra tree in the room, I thought an industrial crane with notes hanging off it could be good.

How wrong I was!

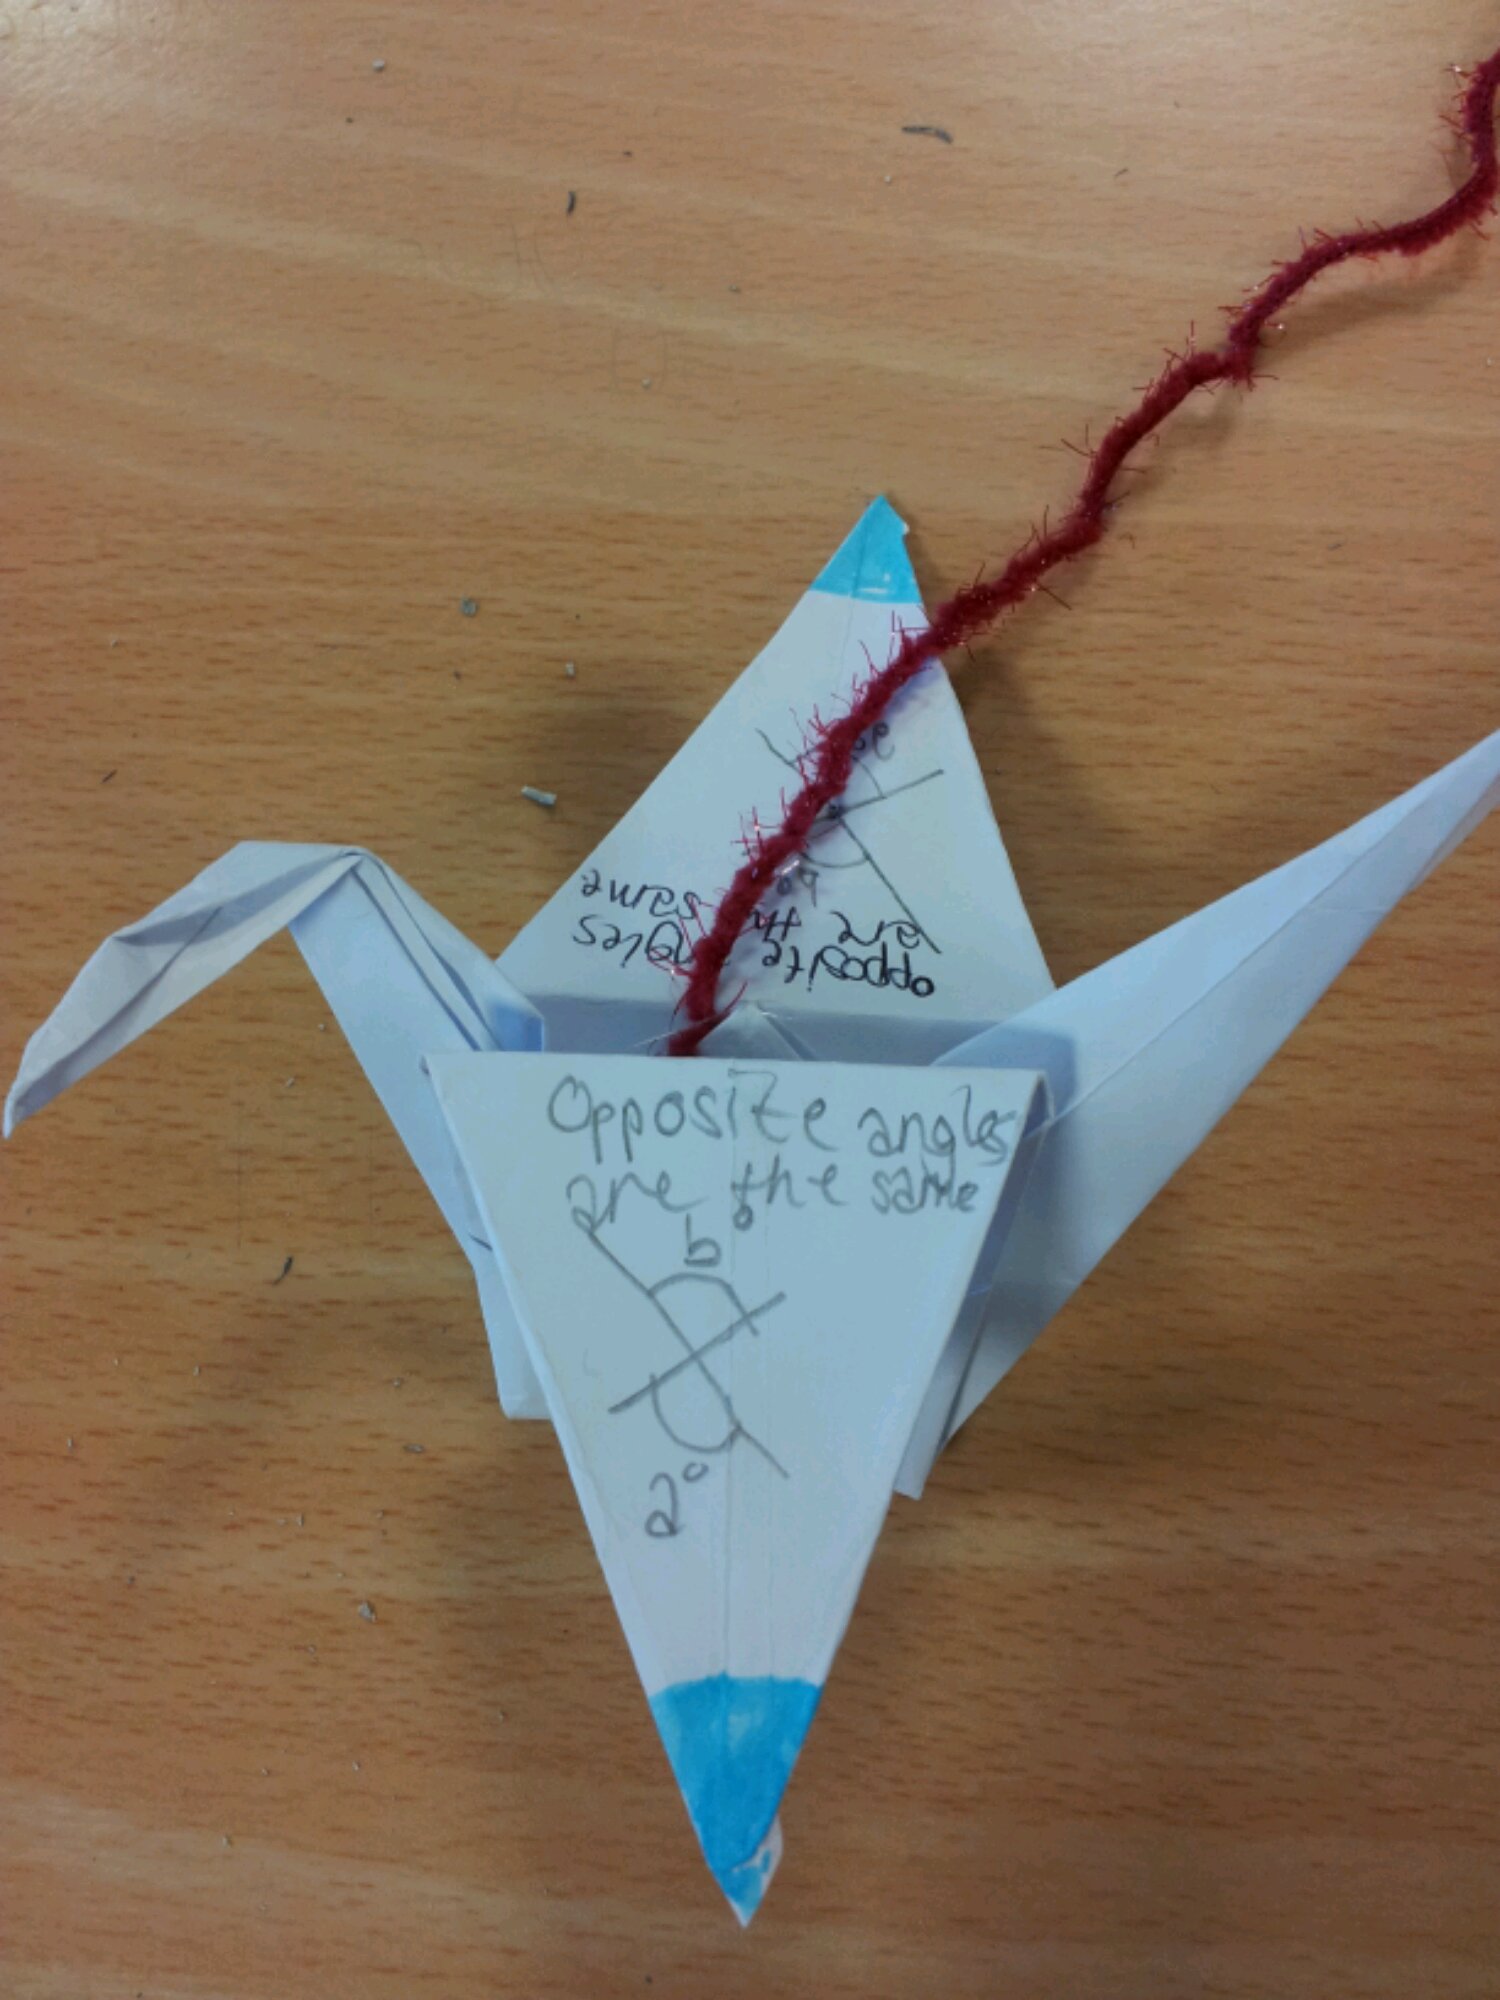
Two girls started folding origami cranes – they’d learnt how for a school project. They then wrote maths facts on the wings. The idea was calmimg, yet contagious!
image

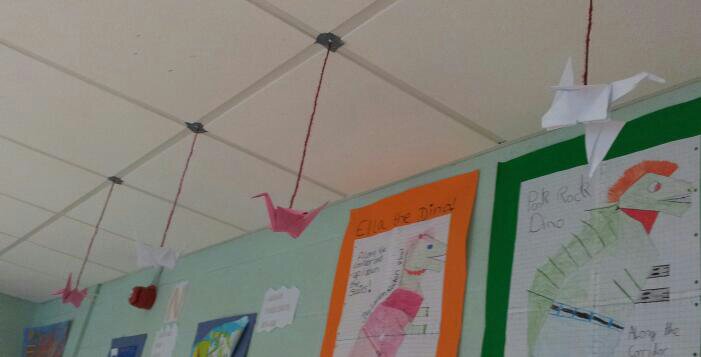
The idea slowly spread across the room. Soon about half the class were folding cranes and writing notes. Someone even found some coloured paper.

image

Now there is a small flock of cranes flying across the room which will hopefully remind pupils of the notes they wrote.

If you want instructions on how to fold an origami crane try this YouTube video.

188. Ducks, chalk and gravity

So how did TeachMeet result in me standing in a supermarket one evening doing a price comparison of duct tape?

Let us go back in time to #mathsmeetnorthwest. Dave Usher did a brilliant presentation on ‘Big Maths’, including the use of gaffer (duct) tape in lessons. I thought this was a genius idea – sticky, sturdy and temporary. I didn’t get a chance to buy any at the weekend, so I ended up in the supermarket on a weeknight.

But what to buy?

Cheap own brand duct tape at £2.95 for 15m or branded ‘Duck’ tape at £3.95 for 25m?

I started school the next day with one idea on how to use it, which quickly developed into three..

Lesson 1: Averages

Equipment: Duct tape, liquid chalk marker

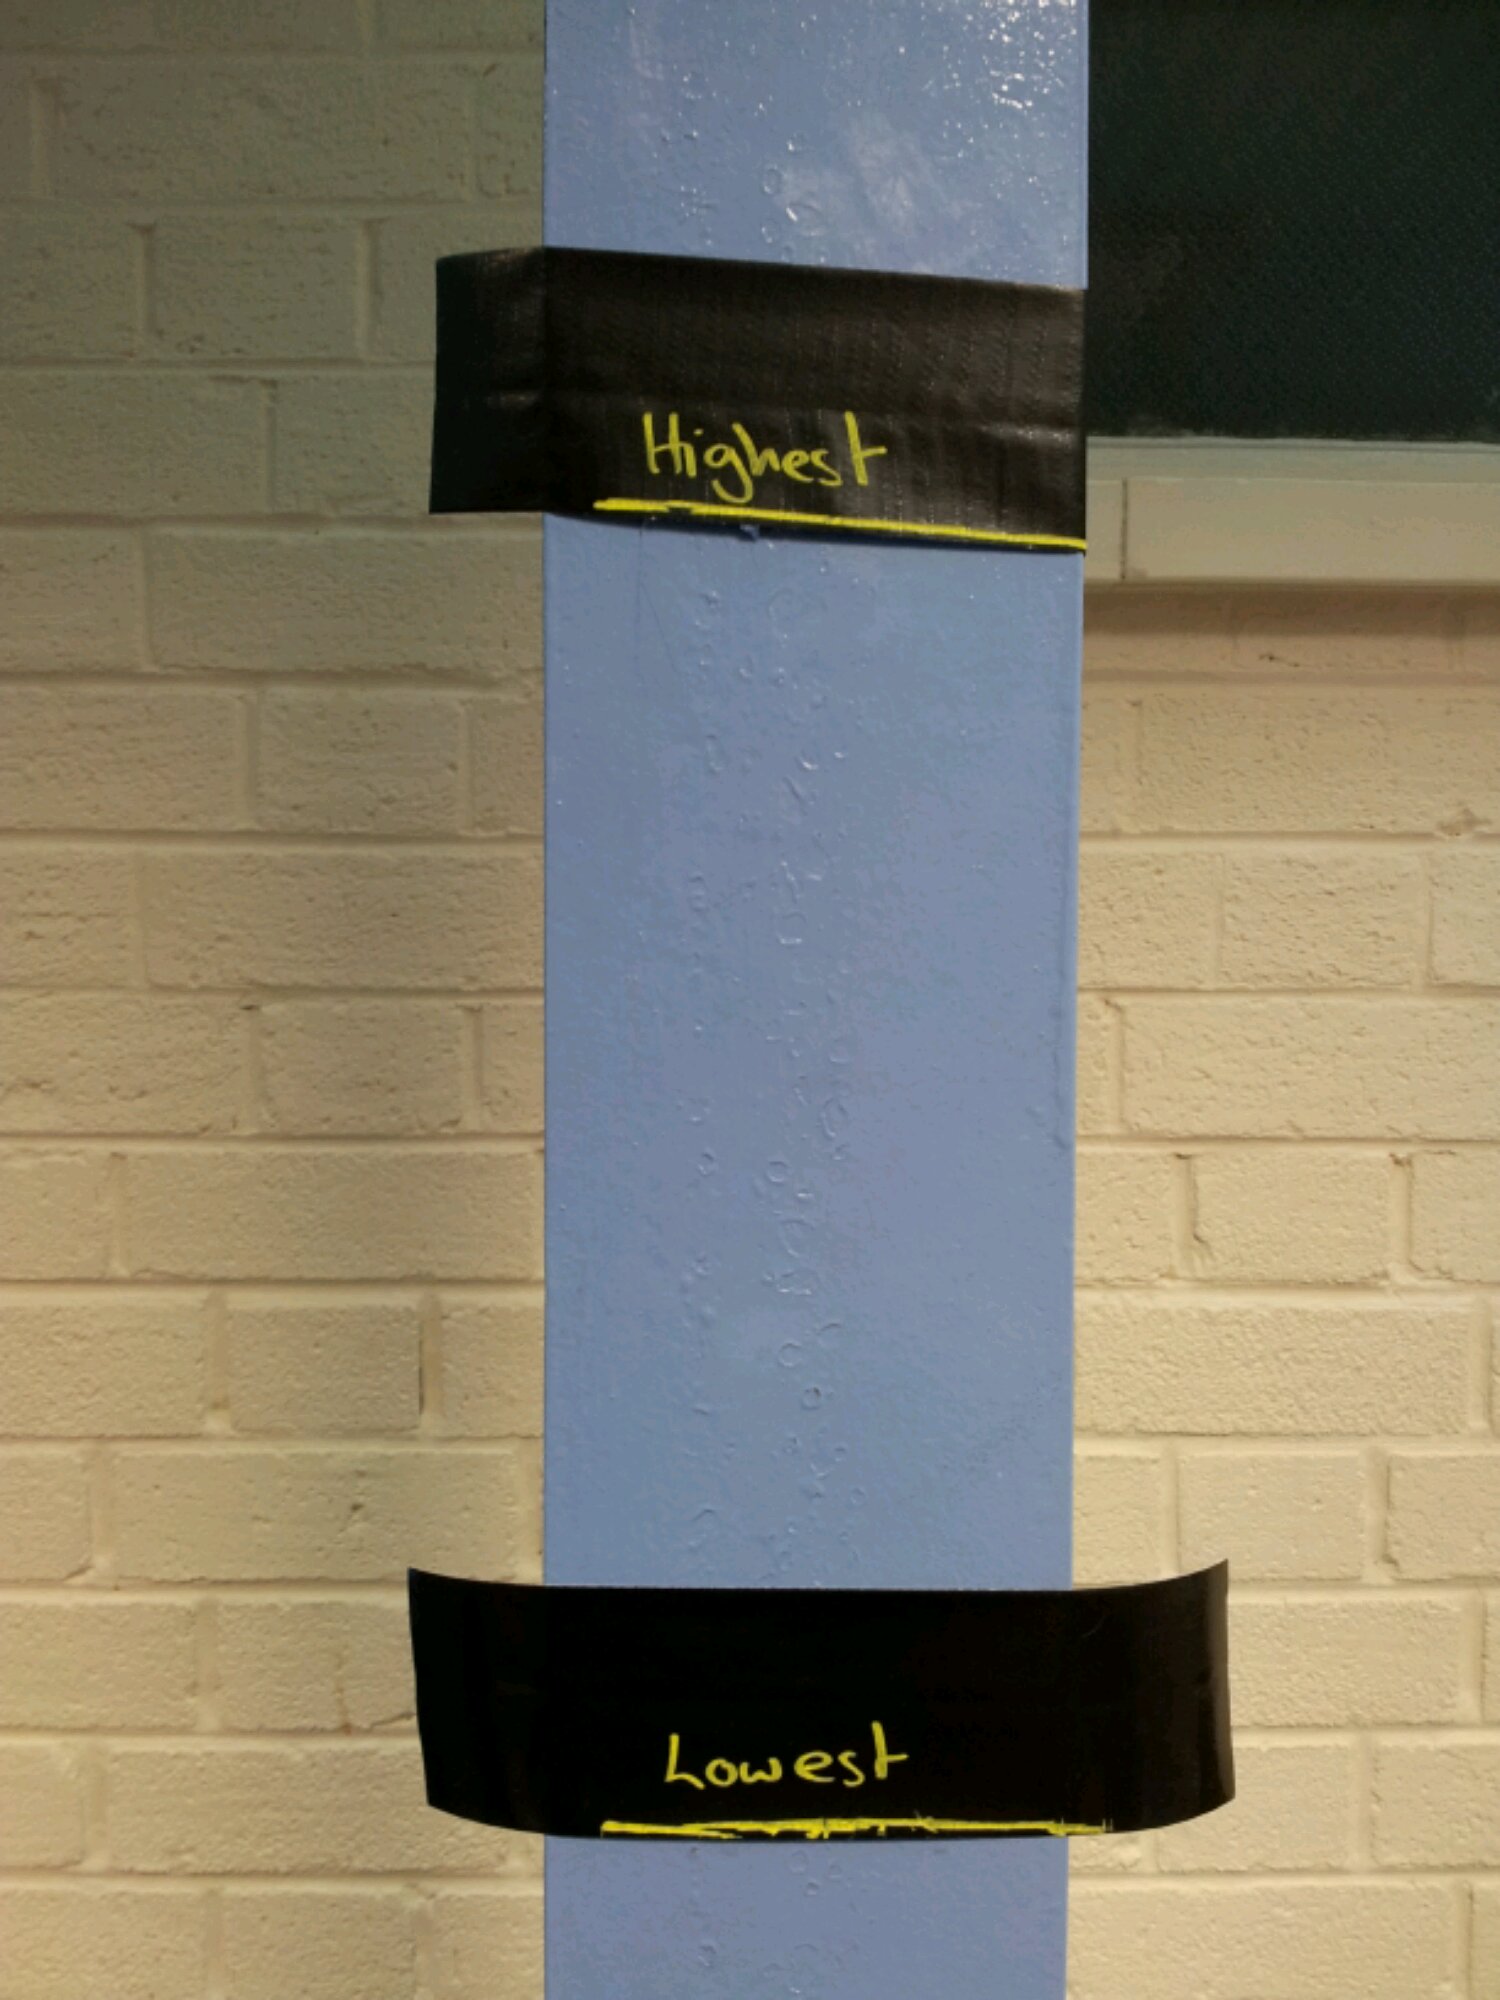
I did averages and range indoors. This meant I couldn’t chalk the walls or floor. However I could mark out key features with tape. I used the activity Averages and marked out the median, the highest and lowest values on the floor. It was at this point I figured out I could write on black duct tape with liquid chalk marker – brilliant! We labelled the wall with the highest and lowest heights of the class so we could see the actual range of heights.
image


Lesson 2: GCSE Revision

Equipment: Exam papers, scissors, glue, wall paper, duct tape

I have been using the Foundation GCSE Review with my Higher GCSE resit group. Reviewing ten Higher GCSE papers involves over 200 questions – that’s a big wall display! Both of the TeachMeets I have attended have used the idea of learning wallpaper. So that’s what we used – I’m grateful that some of my students are over 6ft tall or the wall display wouldn’t have gone up.
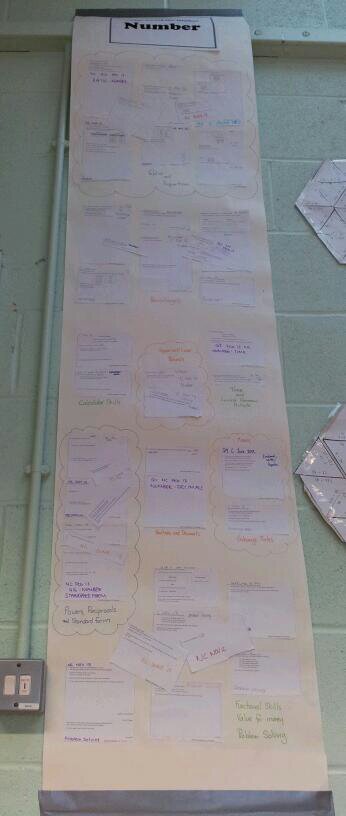
image

Now the duct tape was used to secure the top of the wall display and to ‘passer-by’ proof the bottom. It should last longer now that the lower end is reinforced.

image


Lesson 3: A-Level Mechanics

Equipment: Duct tape, liquid chalk, mobile phones, calculators, soft ball (I used a ball of wool)

It’s all very well drawing diagrams for A-Level Mechanics questions, but how about a life size diagram? We were looking at vertical motion under freefall/gravity. I gave the students pieces of duct tape chalk labelled with a, s, u, v, t. We went to the staircase and labelled the wall with the tape – so u (initial velocity) was taped to the top of the bannister and v (final velocity) went on the floor at the bottom of the stairs, etc.
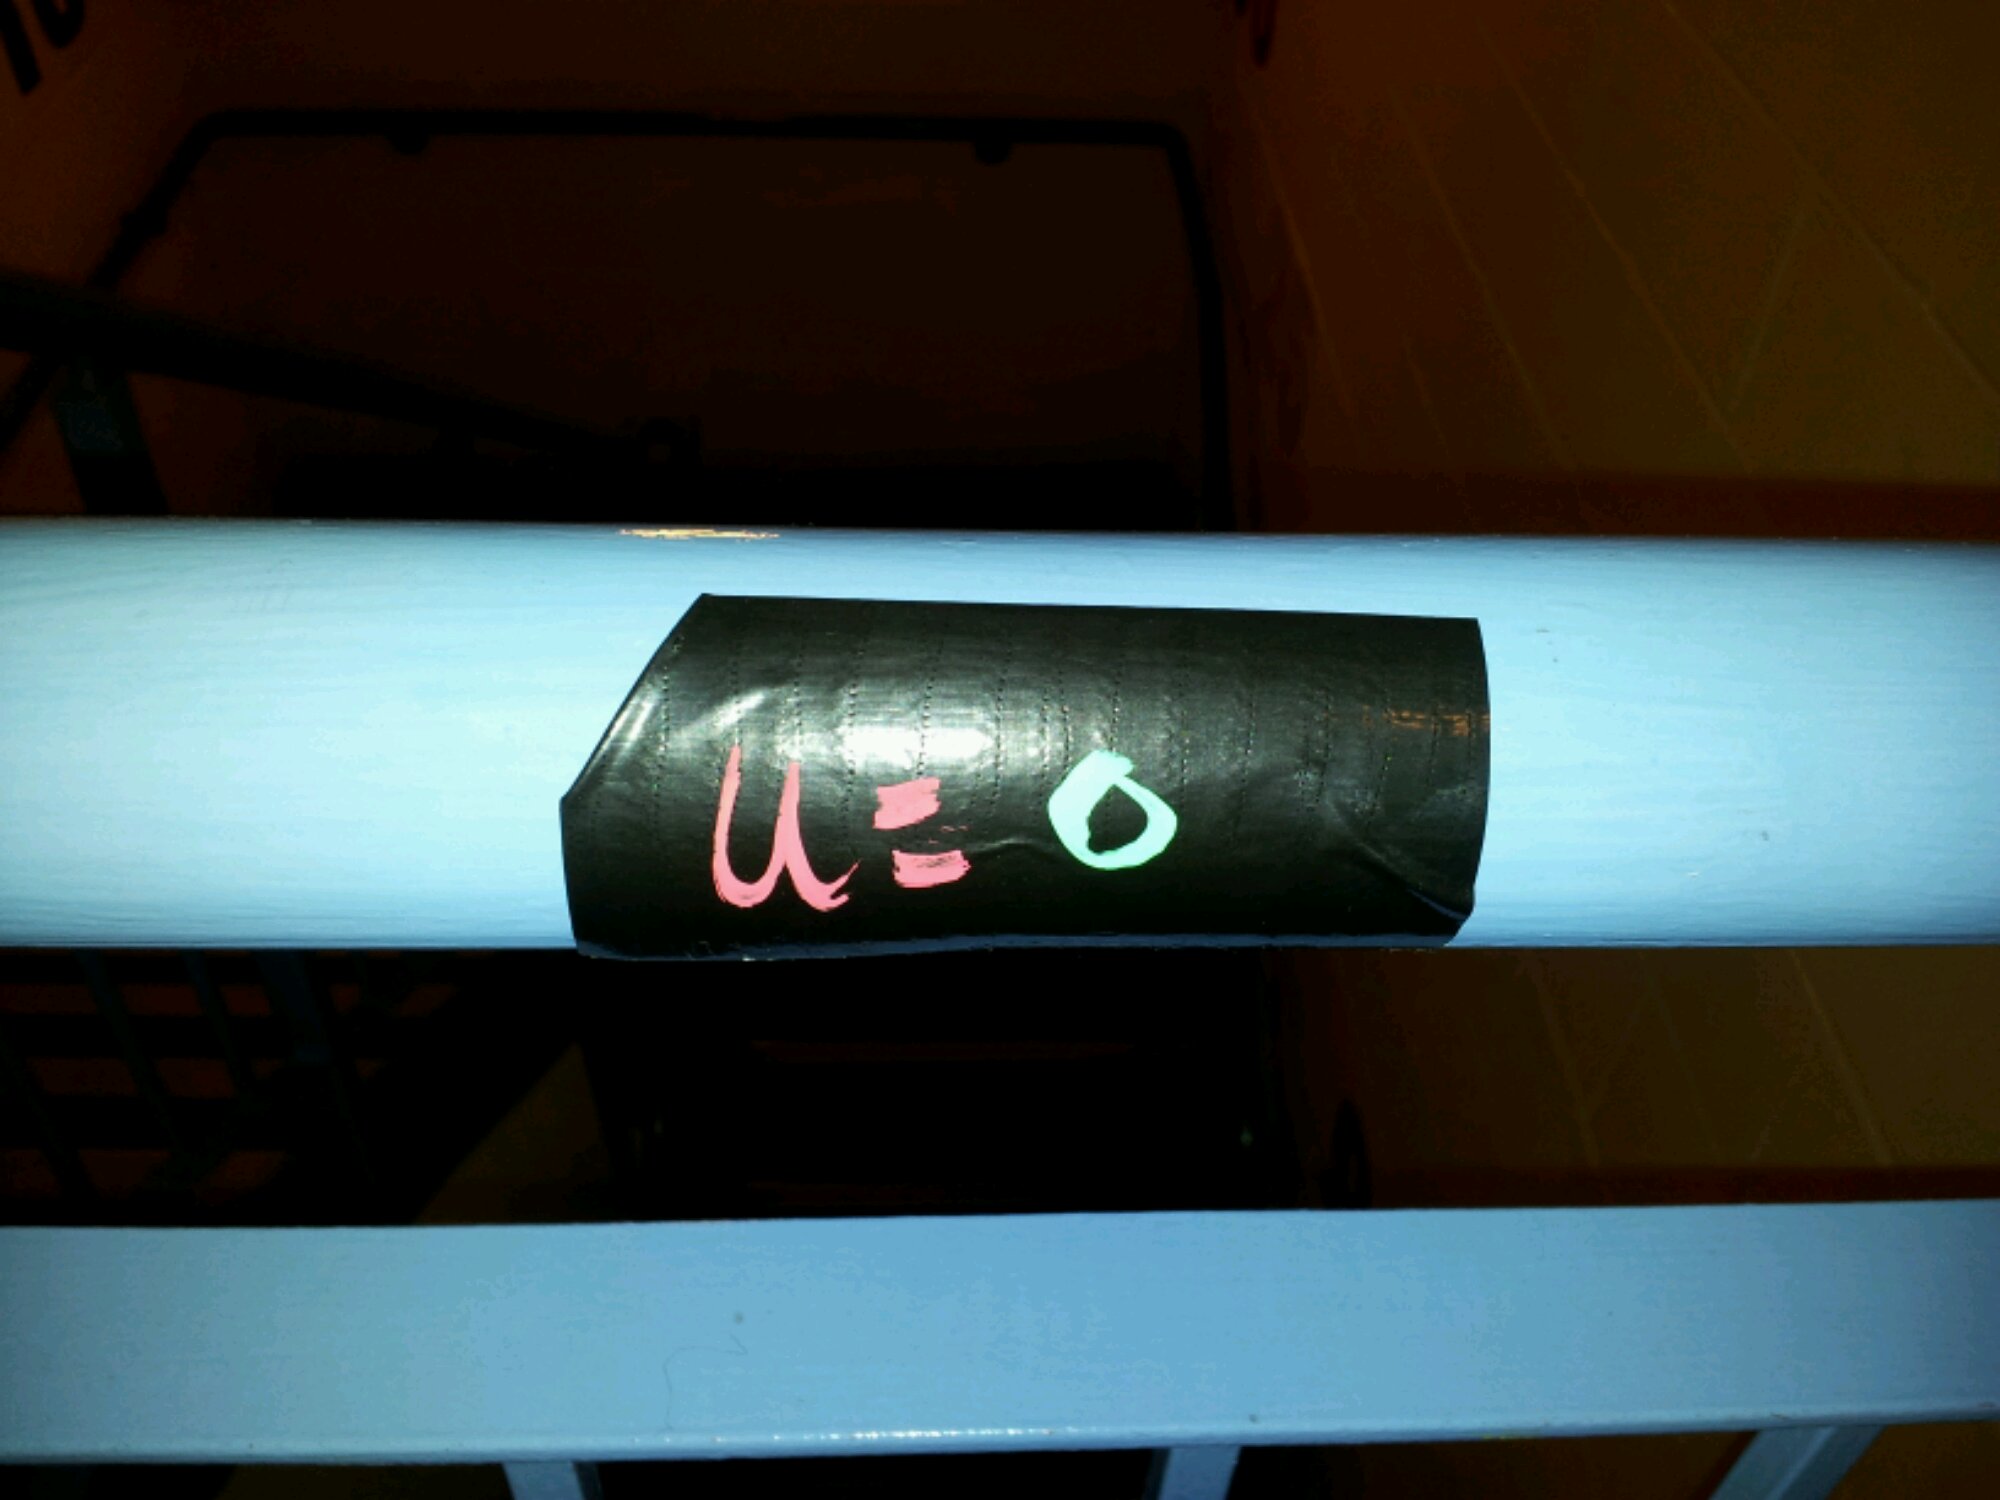
image

The students then labelled what they knew: a=g, u=0, v=?, t=?, s=?
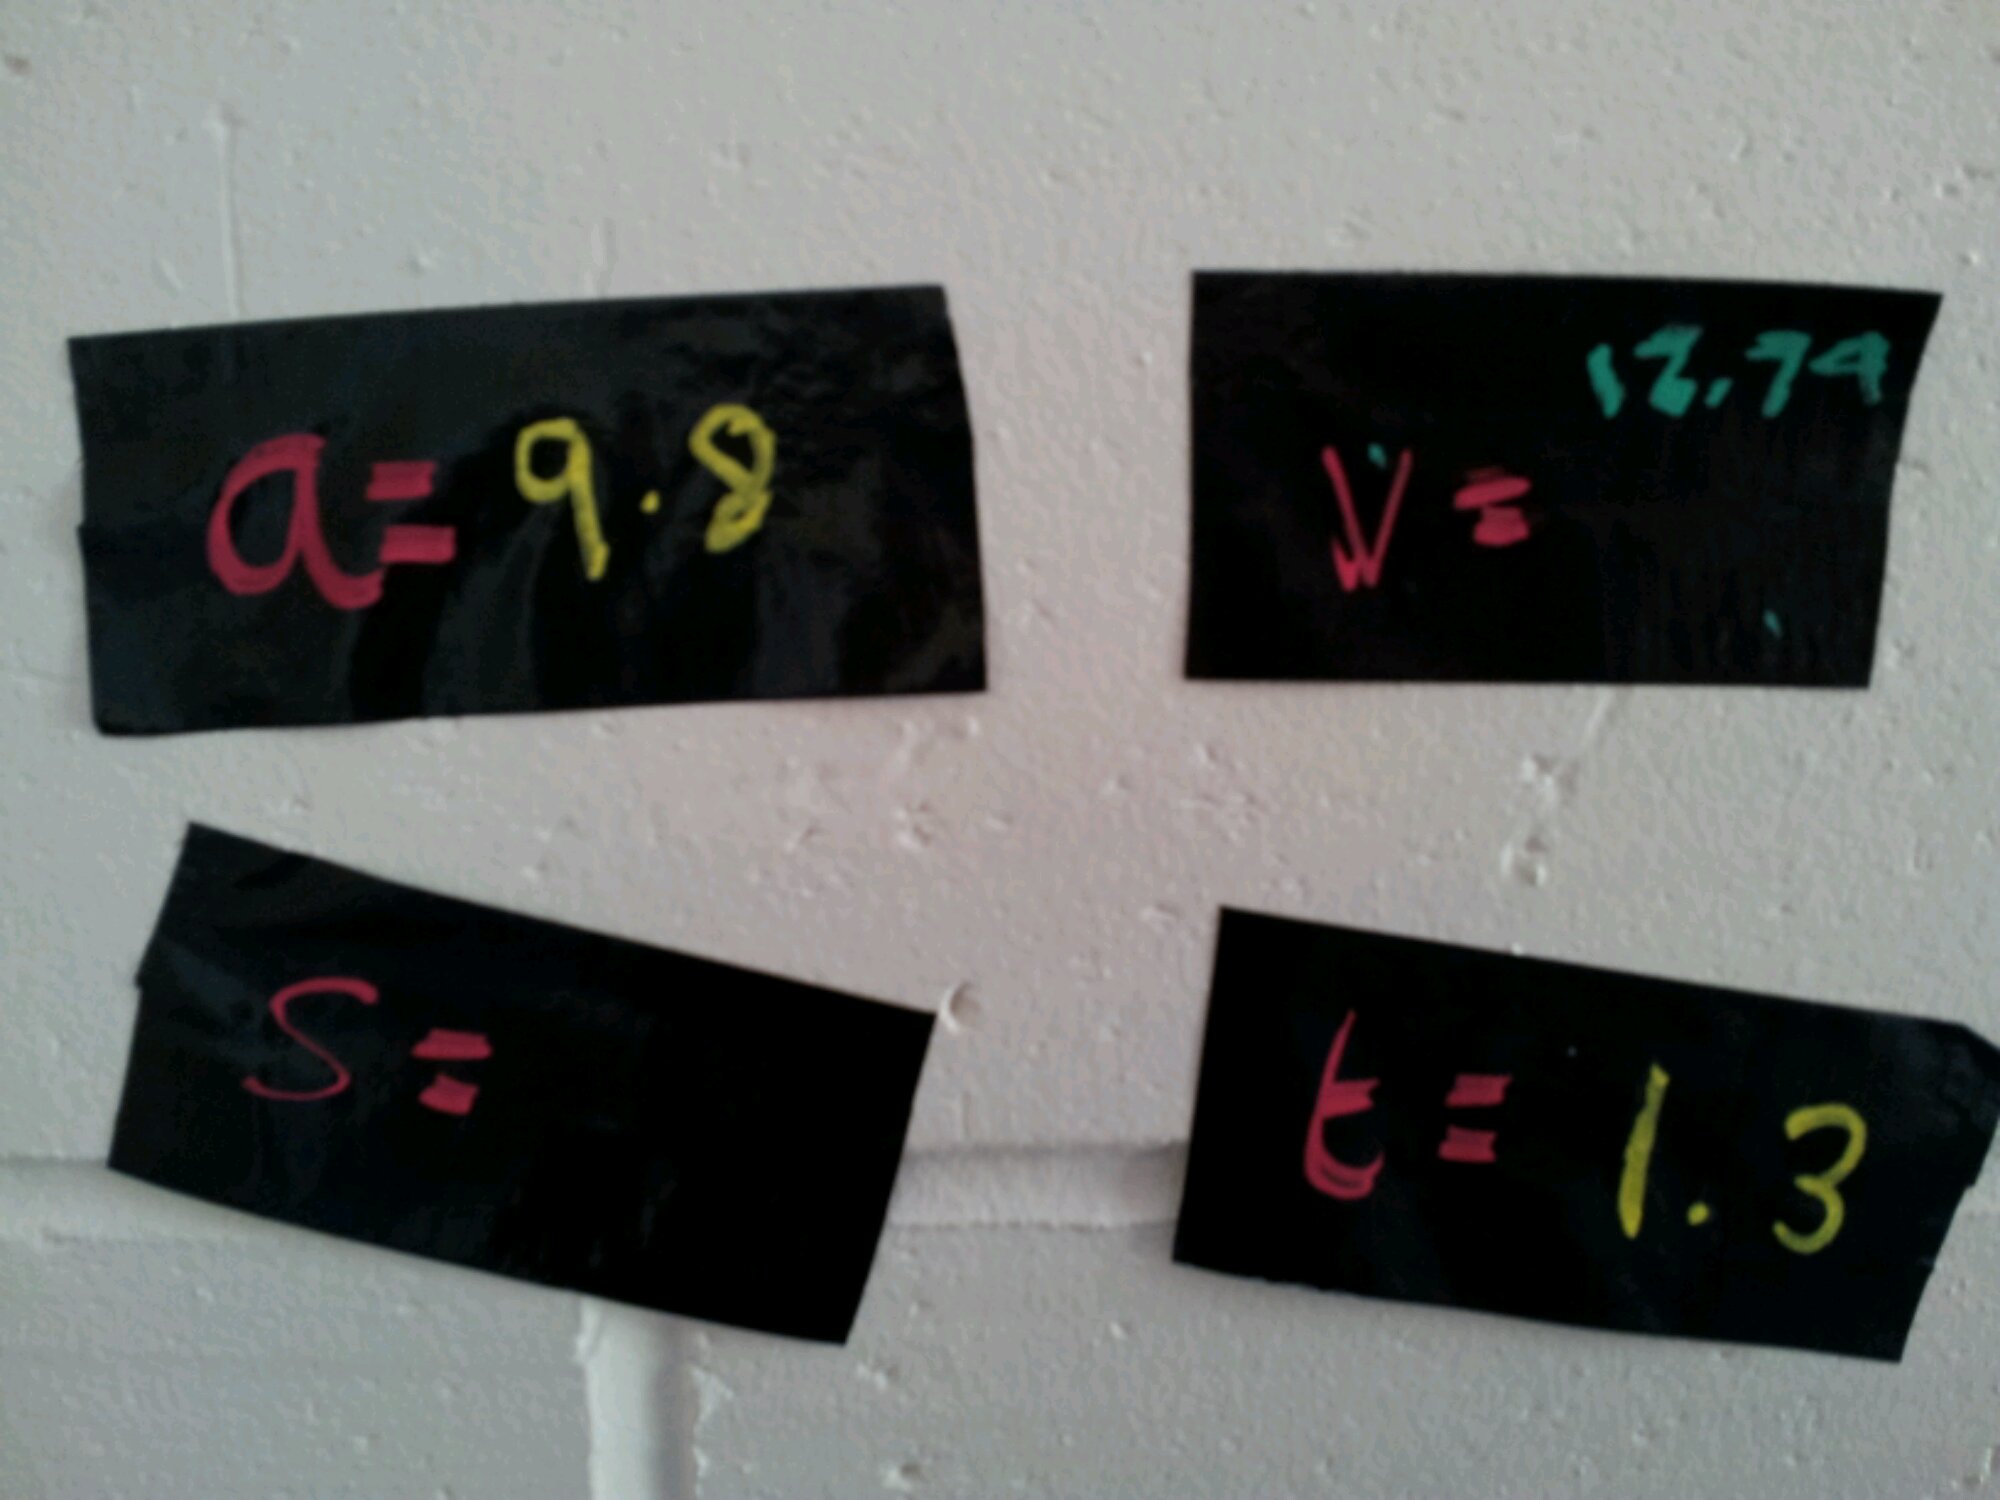
image

The students used mobile phones to time the drop from the bannister to the floor and calculated the distance and final velocity. The physical activity allowed us to think about how to draw these kinds of diagram.

And finally …
Just some pictures of an alternative whiteboard:
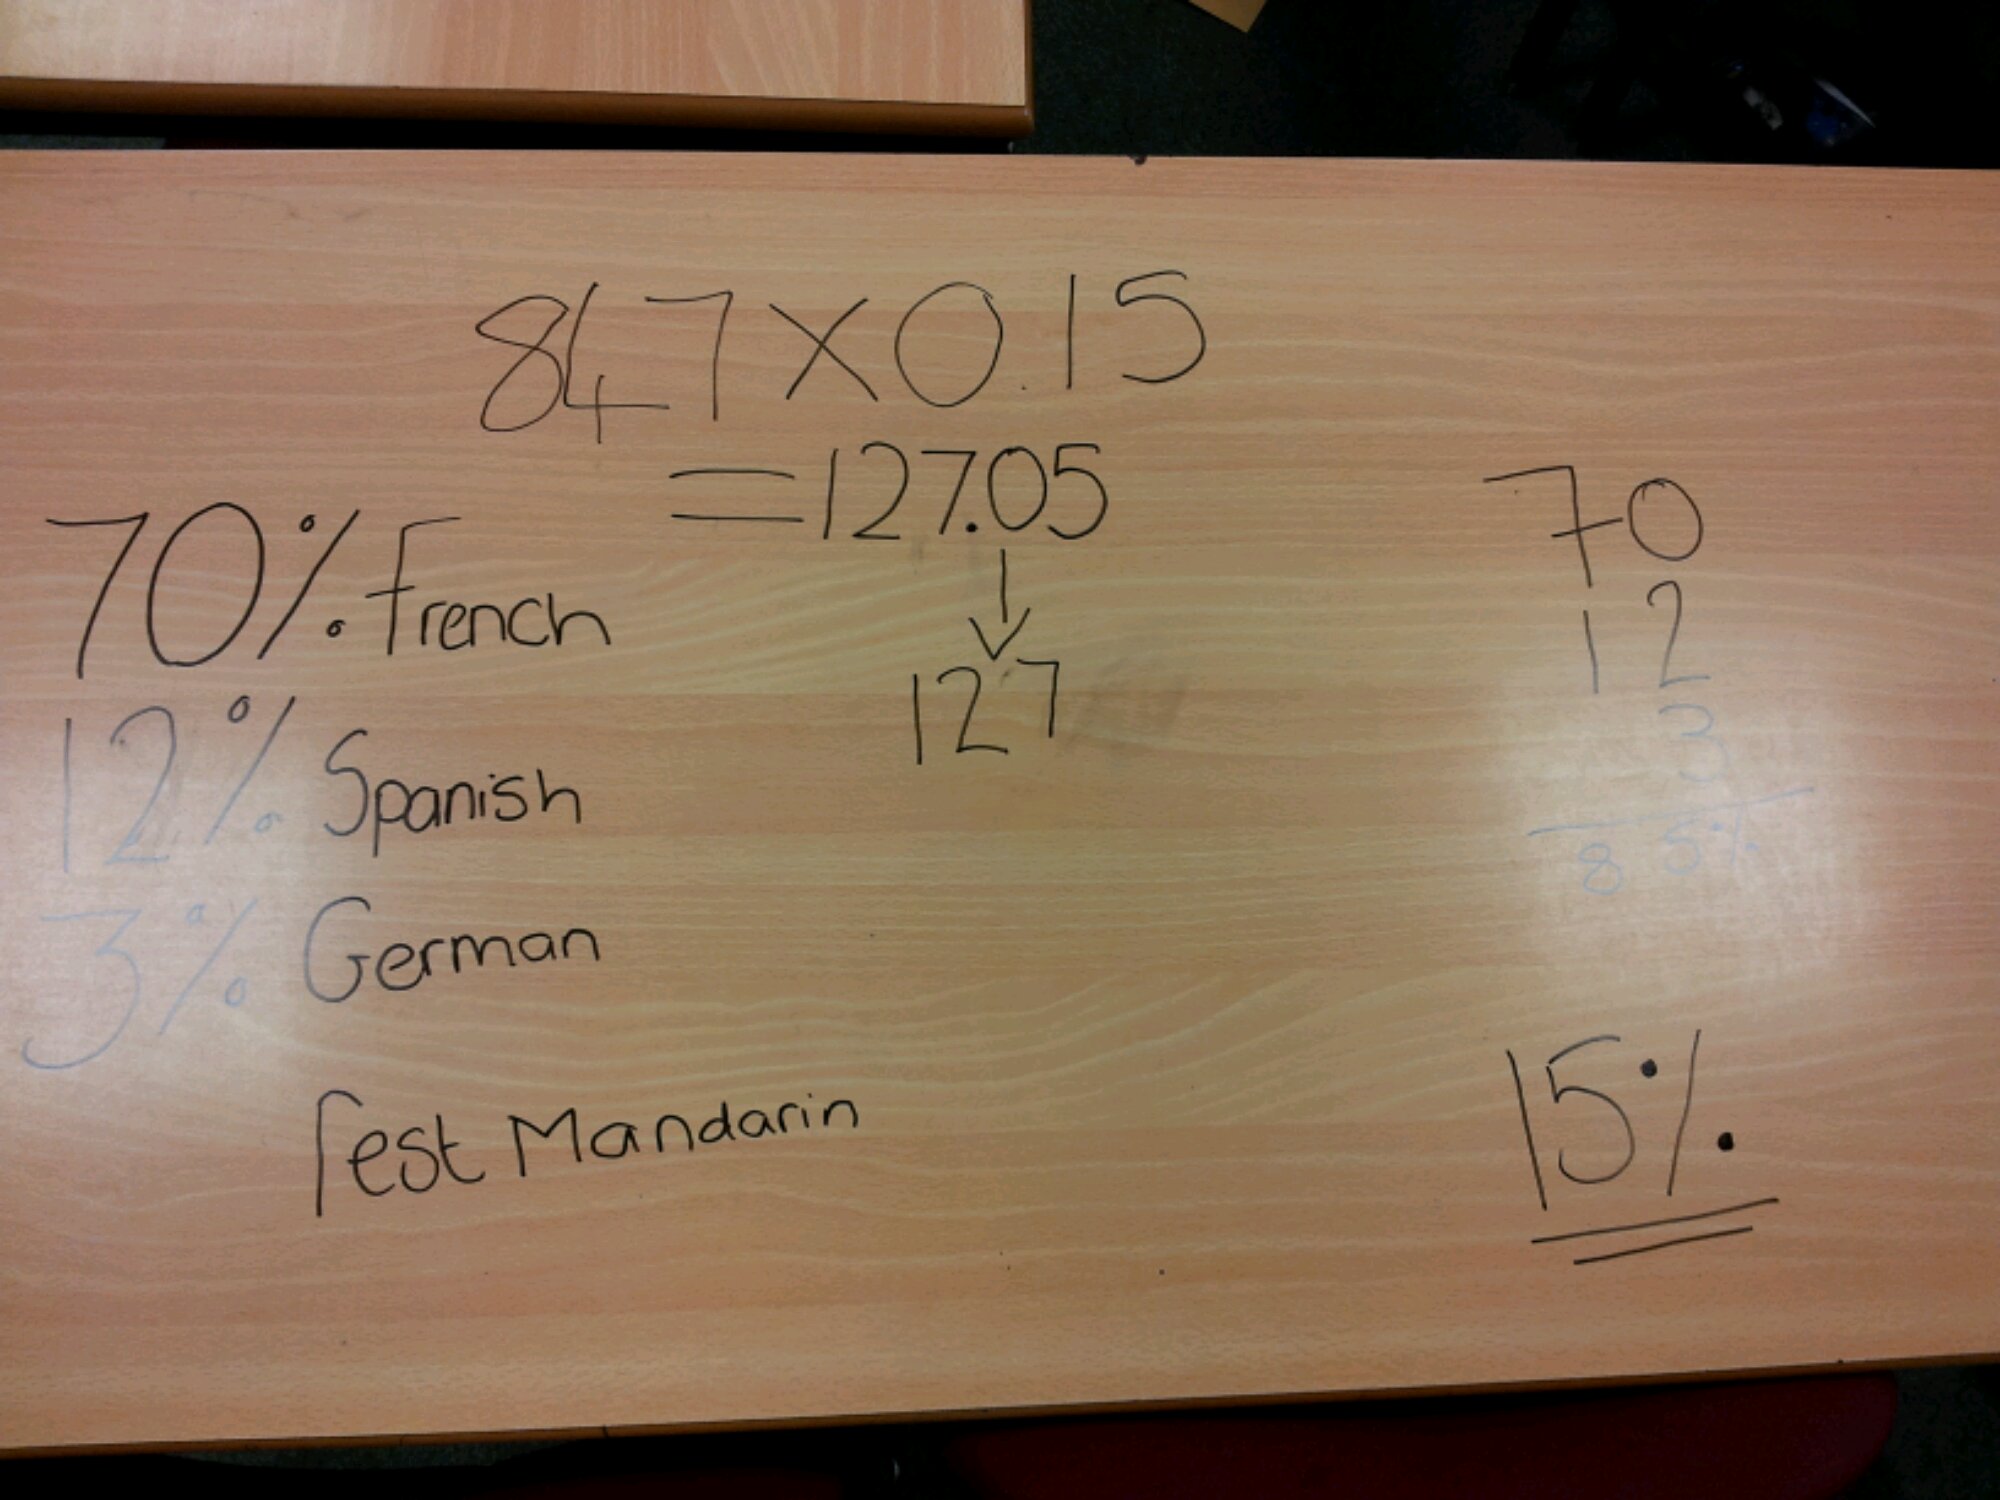
image

image

188. Top Teachmeet Trumps Resource


I’m currently trying out ideas from the #mathsmeetnorthwest TeachMeet. Emma Weston did an excellent presentation on ‘Marking for motivation and progress’. She inspired me to look for a Top Trumps activity for my class – they needed some consolidation of solving equations with an unknown on each side and with brackets. I found this brilliant solving equations Top Trumps by Dusher on TES resources.

The Marvel comic themed algebra cards have three tiers of difficulty and went down a storm. My class would have happily played all lesson, if I had let them.


Who would have thought that equations could be so engaging?

187. Clever circles

Here is a quick, multi-function resource for you: a set of overlapping circles for angles, pie-charts and fractions/percentages.

Equipment
Card
Scissors
Pencil
Straight edge or ruler
Pair of compasses
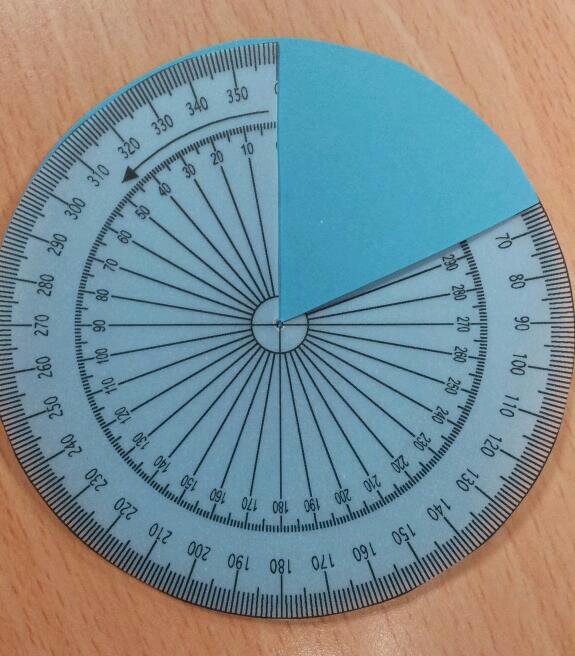
A 360 degree protractor printed on paper (or a tracing paper protractor cut out)

Construction
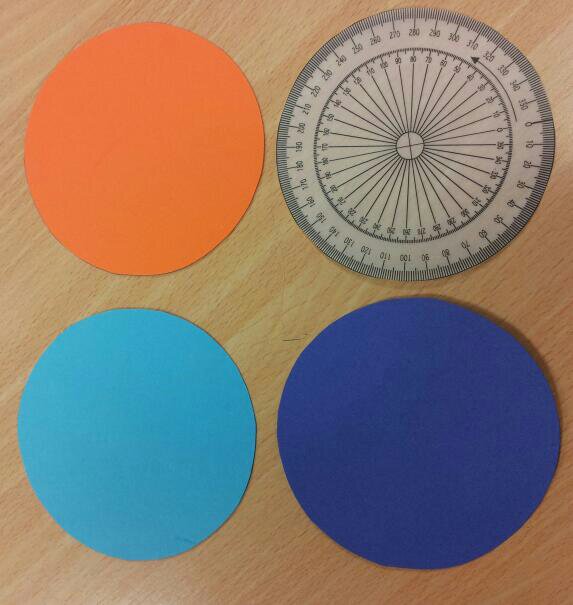
1. Cut out three identical circles and the paper protractor.

image

2. Stack them on top of each other and put the pointy end of the compasses (or a drawing pin) through the middle. Wiggle it around to make a bigger hole – please don’t stab yourself.

3. Draw a radius on the circles.

image

4. Cut down each radius on the circles and the 0 degree line on the protractor.
5. All done!

Activity 1: Angle Estimation
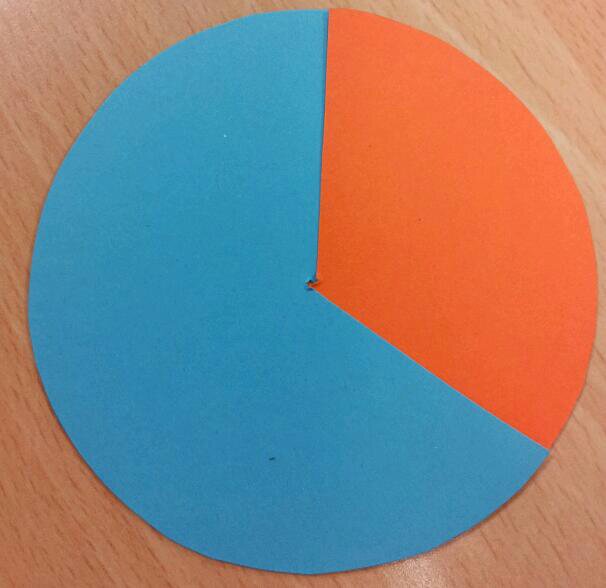
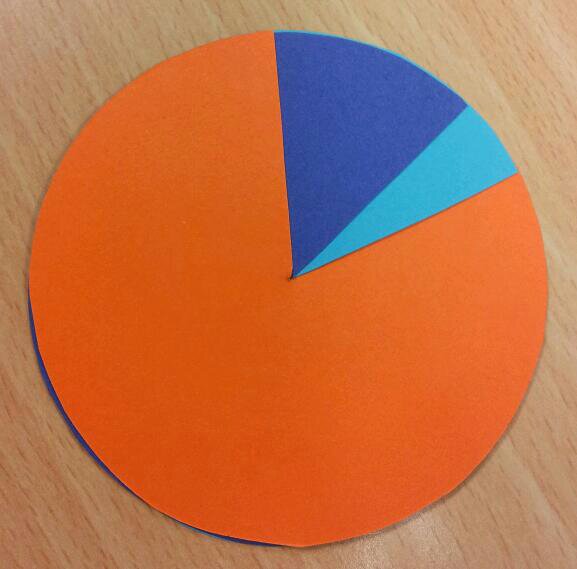
Slot two circles together:

image

Estimate the orange angle.
What could the blue angle be?
Show me an acute angle.
Show me a blue 170 degree angle.

Activity 2: Reading a protractor scale
Slot the protractor into a circle:

image

How big is the blue angle?
Show me an 80 degree angle.

Activity 3: Pie-charts
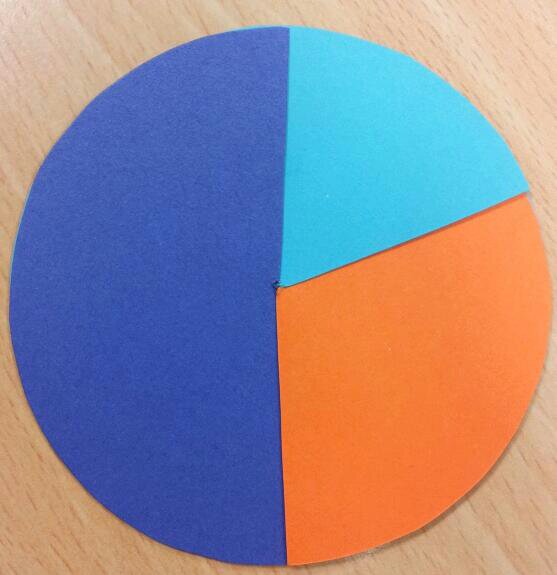
Slot the three circles together:

image

What could this pie-chart represent?
Show me a pie chart with two equal sections

Activity 4: Fractions and percentages
Use three circles again:

image

Estimate what percentage is purple.
What fraction could the blue section represent?