Category Archives: Download

241. Histogram Hysteria

Are you fed up of explaining the difference between a histogram and a bar graph/chart?

Cheer up! Help is at hand…

I teach a class of bright students with very little self-belief in their abilities and total fear of leaving their comfort zone. Instead of telling them what to do and set page X of textbook Y, I let them tell me what was going on and let them take small steps. After all, you wouldn’t take a beginner climber up the North face of the Eiger, would you?

Let us begin:

Download this simple comparison file: What is a Histogram? (pdf)

First I gave the students individual time to write down what they observed. They then compared their answers in pairs/threes. Finally, I collected their observations together on the board (where I had projected up the comparison worksheet).

This hands on approach allowed the students to understand how a histogram is constructed. There were fewer students thinking that histograms are just bar-charts where the bars touch.

Download the step by step worksheet: Histogram calculations step by step

(Alternatively you can download the worksheet with RAG123 self-assessment at the end: Histogram calculations step by step RAG123 )

This worksheet allows students to get the feel for calculating frequency densities without stress. The instructions are gradually removed, until students are just working from a data source. Then students practise drawing histograms.

It is also a handy revision resource – my students referred back to this worksheet when they were stuck in subsequent lessons, rather than ask me!

239. Introduction to Arithmetic sequences

Here’s a quick post for all those of you teaching Arithmetic Sequences. Whether you are teaching Level 3 Algebra or the C1 A-Level module, the jump from GCSE Nth term to the form ‘a + (n-1)d’ can be unnecessarily tricky. To help with this I’ve written a starter booklet for Arithmetic Sequences. You can download it here:

Introduction to arithmetic sequences

By the way, if your students confuse the vocabulary ‘sequence’ with ‘series’ get them to think about television. A normal television series ends, so an arithmetic series must end too!

235. Which witch is which?

Whether you are on half term holiday this week or next, I’m sure you’ll have time for this little number skills starter.

worst witch

Image Credit: Jill Murphy, ‘The Worst Witch’ – a children’s classic, which I highly recommend.

Can you help Wanda, the Grand High Witch, to find the local reporter hiding at her Halloween Girls Night Out? Solve the number problems and unveil the imposter.

Which witch is which? (pdf)

This starter or homework activity includes order of operations, factors, prime numbers, addition and multiplying (written method).

Happy Halloween!

(Updated: 1st Nov 2017)

233. Summary Statistics

If you are reading this blog there is a high probability that you are a maths teacher – it is a maths education blog after all. That means data shouldn’t be scary … should it?

scary data

Image credit: http://mrcbaker.blogspot.co.uk/2013/08/data-doesnt-have-to-be-scary-how-you.html (This website is worth a look!)

In a world of performance tracking and data analysis, seeing the trends in class data should be easy. However busy lives and hectic timetables mean we often don’t get the time to step back and reflect on our classes.

I decided to pull together the summary data for each of my classes onto one page. I can see a profile of current and target grades (FFTD*), gender, SEN and Ever6** information in one table. The actual act of completing the table made me take a closer look at the abilities and issues within the class. I realise not everyone uses these data measures so the files are in .doc and .docx form. Since the data is summarised it remains relatively anonymous, making it a good discussion document for trainee teachers or CPD.

You can download a customisable form here:
Summary Data for class KS3 (doc)
Summary Data for class KS3 (docx)
Summary Data for class KS4 (doc)
Summary Data for class KS4 (docx)
Summary Data for class KS4 sample (doc)
Summary Data for class KS4 sample (docx)

*FFTD means Fischer Family Trust Data

**Ever6 is a UK measure related to eligibility for Pupil Premium funding (simplified description).

233. Stealthy Cone Investigation

I like to encourage students to discover rules and formulae for themselves. It’s important that students understand where the maths comes from so they can apply their skills effectively. They also don’t have to rely on remembering a rule (which they may forget when they are stressed).

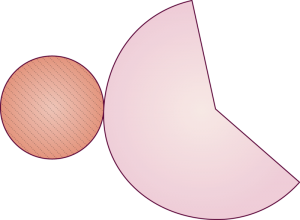
net of a cone

Image credit: http://www.ck12.org/geometry/Surface-Area-and-Volume-of-Cones/

This resource is a neat and effective way to investigate the surface area of a cone through measuring circles and creating a 3D shape. Students get a physical feel for how the dimensions fit together. Throughout the lesson I let students choose their degree of accuracy in cutting, measuring and calculating. Of course, when we discussed the ‘solution’ at the end of the session it was impossible for me to put one correct answer on the board. So I generalised using a and b for the radii – explaining that everyone could check their method in general terms. The lovely ‘penny drop’ moment happened when my a’s and b’s suddenly became a general rule. I’d conned the class into using algebra because of the accuracy issue.

Download the worksheet and answers here: Surface_area_of_a_cone

Hint: Copying onto coloured paper or card makes this activity stand out in their notes.

232. Steps in Volume

This is a quick little post to give you a nifty little resource inspired by the ideas of Bruno Reddy (@MrReddyMaths). I suggest you visit his website at: http://mrreddy.com/.

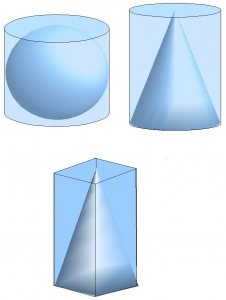
Sphere cone pyramid

Image Credit: http://k12math.com/math-concepts/algebra/volumes/volumes.htm

I’ve been teaching my class how to calculate the volume of spheres, cones and pyramids. They really like these staged worksheets. You could print them out as they are, but I personally print them as A5 booklets which fit into their books.

Volume of Sphere Cone Cylinder (pdf)

231. Fish Shop Maths

I’ve been using this idea since I first started teaching and I’ve finally got around to typing it up!

fish_chips

Image Credit:http://coachandhorsesn16.com/eat/fish-n-chips/

I introduce order of operations by creating an imaginary Chip Shop. I usually read out orders and get the students to write down what they think they are on whiteboards. Note that when you read out the orders, the punctuation doesn’t give any hints.

  • ‘Two fish and three chips’ – 2 fish & 3 portions of chips
  • ‘Fish and chips twice’ – 2 fish & 2 portions of chips or 1 fish & 2 portions of chips
  • ‘Five sausage and chips’ – 5 sausages & 5 portions of chips or 5 sausages & 1 portion of chips

This activity always prompts a ‘discussion’ as to who is correct. The misconception of what an order could mean links nicely with the misconception when working out 2 + 3 x 4. You could also adapt the idea for writing algebraic expressions.

A presentation, with questions, is downloadable in three different formats here:

Fish Shop BIDMAS (pptx)

Fish Shop BIDMAS (ppt)

Fish Shop BIDMAS (ppsx)