Category Archives: Handling Data

296. Jellybean Trees

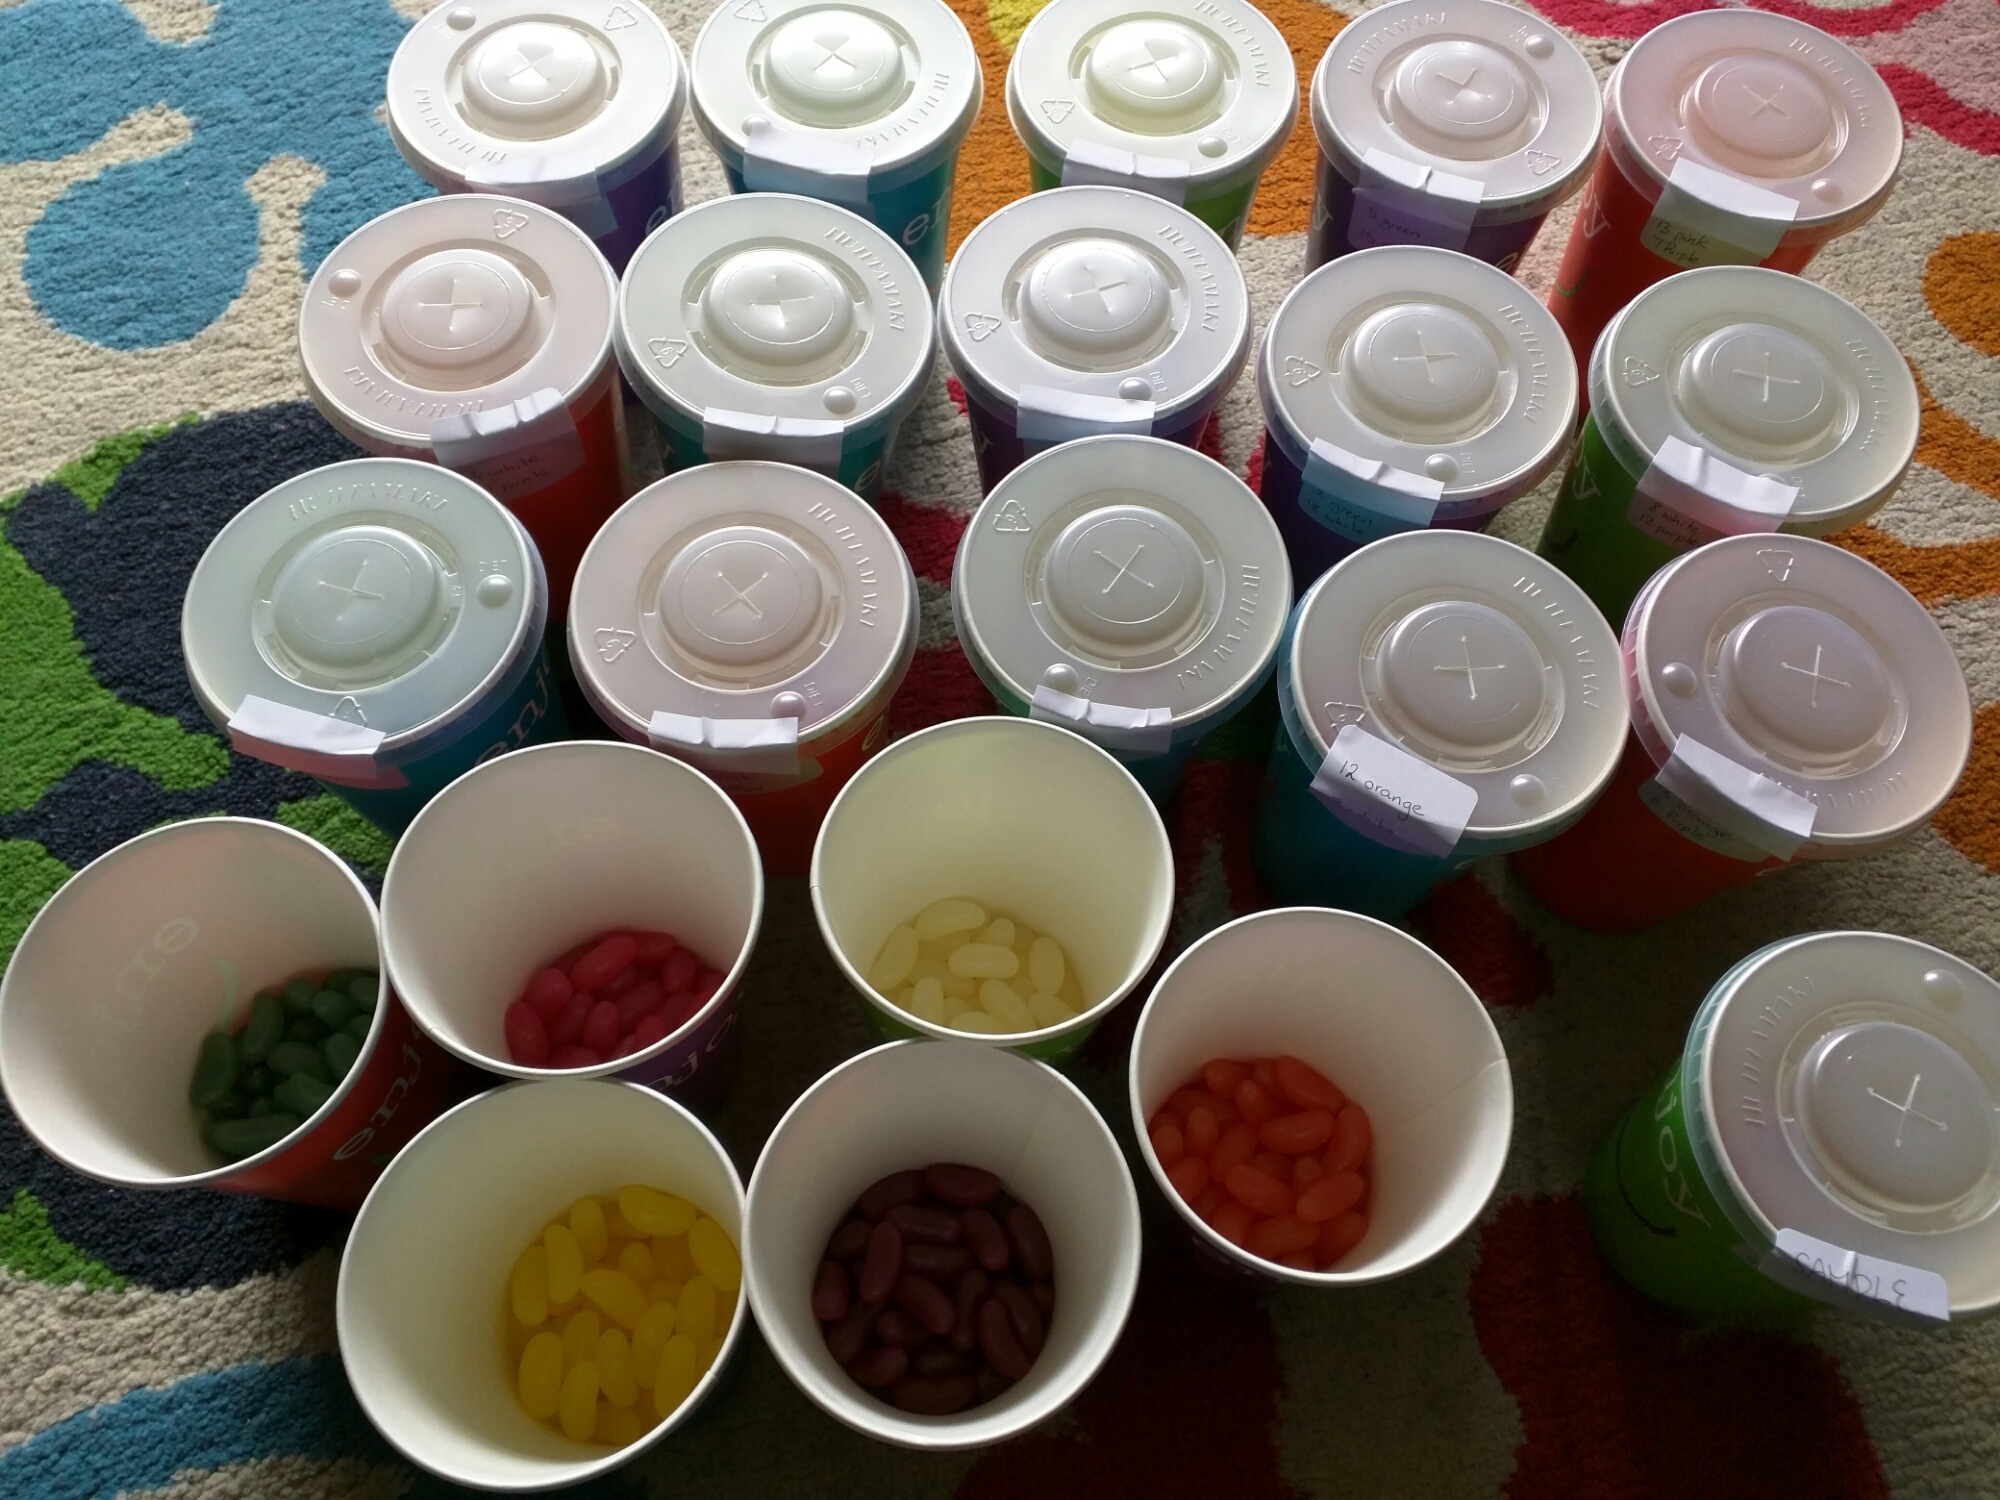
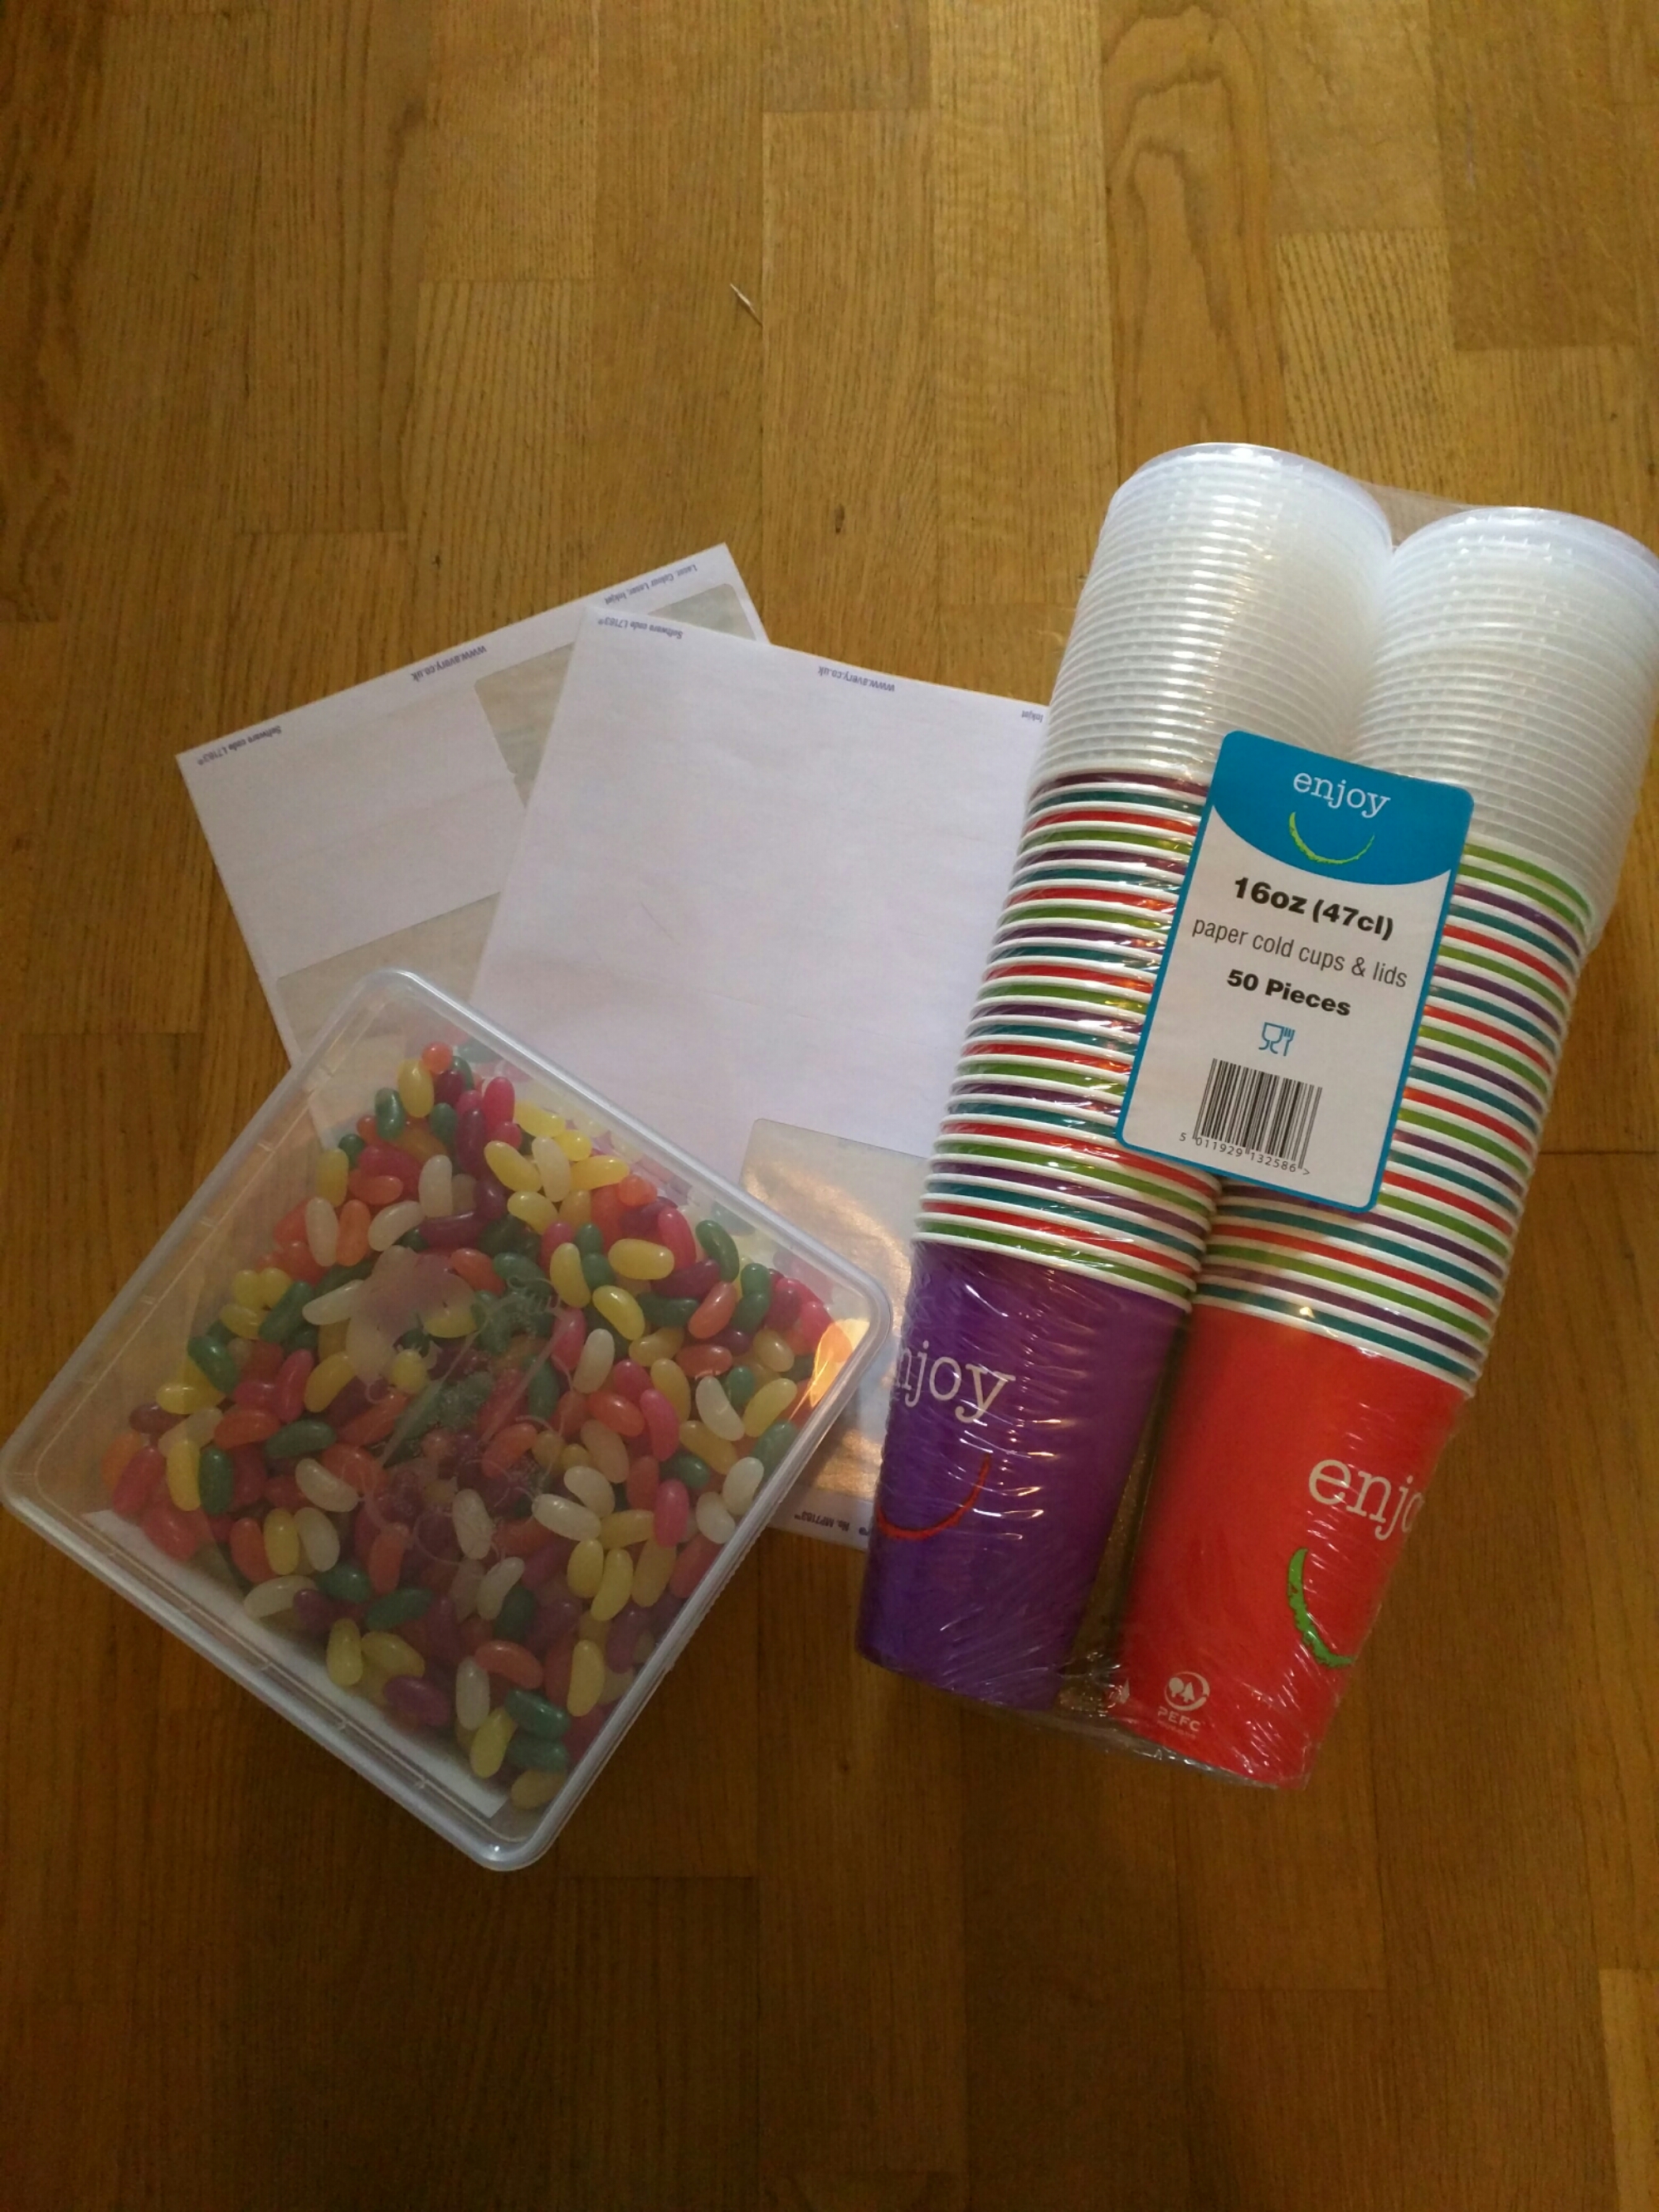
How on earth can you create a maths lesson using these items?

image

Well, first sort them into colours, then put twenty jelly beans into each cup. Make sure there are only two colours in each cup, write the contents on a sticky label and use that to seal the cup. Each cup should have slightly different numbers or colours – it prevents copying.

Note: Eat all the orange jelly beans – you’ll be doing your dignity a favour!

image

Have you figured it out yet? No? We’re doing probability tree diagrams without replacement. Now I know you could do this with one experiment at the front of the class, but getting everyone involved means it’s more hands-on and memorable.

The Experiment
I did a demonstration of this on the board first, before handing out the cups and worksheets. I told the class what was in my cup and picked out a jellybean. It was orange. I drew the first stage of the worksheet (see below) on the board: What was the experiment? How many of each colour do we have? What is the probability of each colour? Then we filled in the first stage of the tree diagram.

I ate the jellybean.

But you can’t do that – it messes up the experiment! I asked what would be the probabilities for a second jellybean now. They figured out the slight change to the probabilities. Then we went back and thought about what would have happened if my first jellybean had been lemon.

I always encourage students to work out all the possible outcomes before they even look at the rest of the questions. And this is why you need to eat all the orange – the list on the board was:

  • P(LL) =
  • P(LO) =
  • P(OL) =

Do I really need to put the last one?

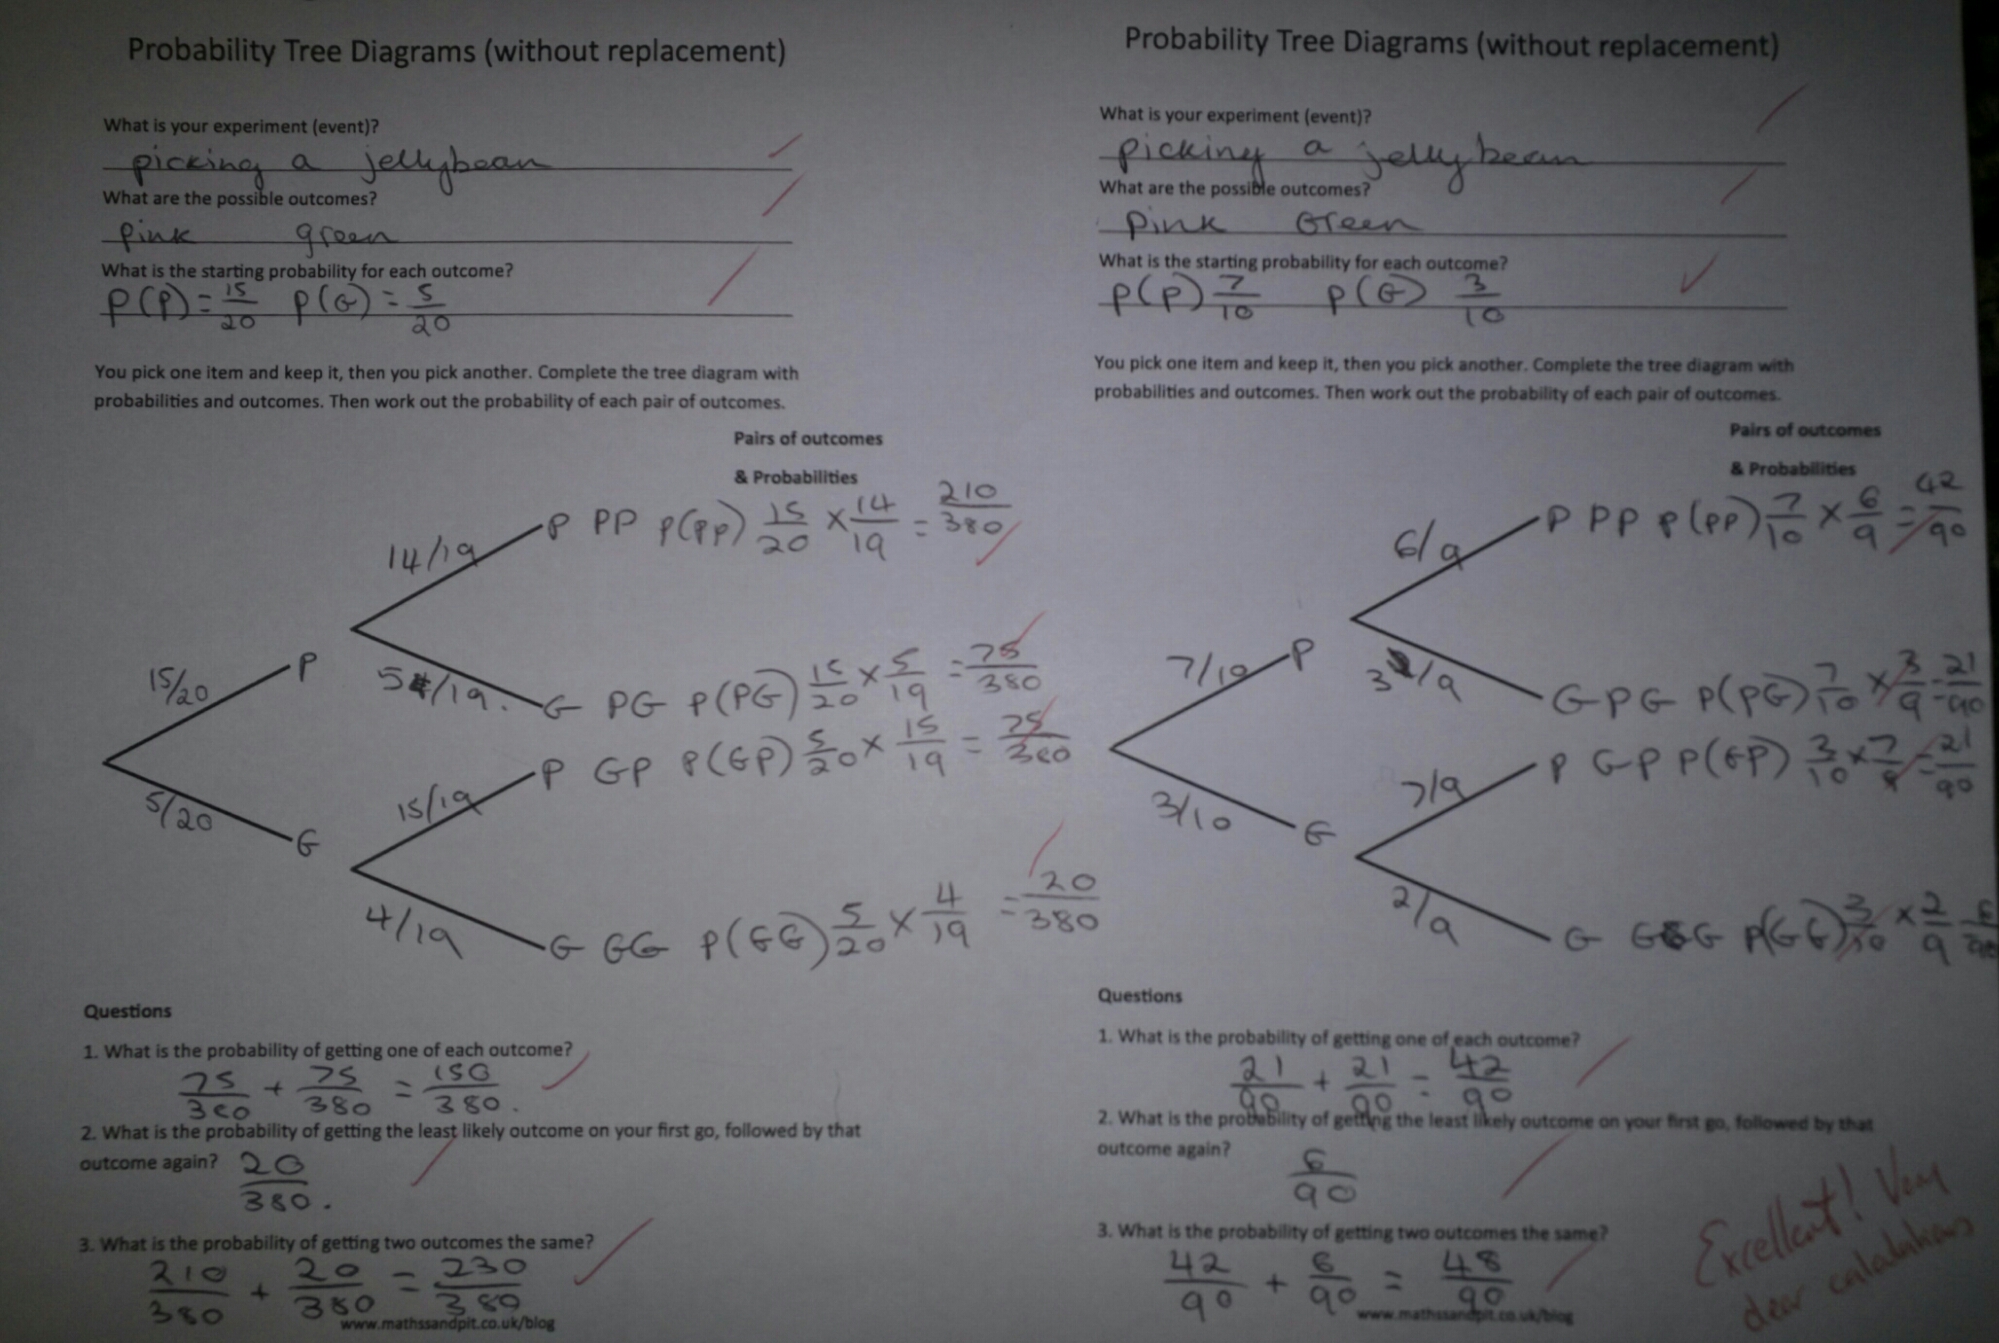
After much giggling, the class were let loose with their own cups. They did the experiment once with their standard cups and then had their work checked. They could then alter (eat) the contents of their cup so that a minimum of five beans of two colours remained. You can see an example of a student’s work here:

image

I summarised the lesson by looking at different types of probability problem where items are not replaced. I now have a nice ‘hook’ to refer to when discussing probability tree diagrams without replacement.

Download the worksheet here:
Tree diagram without replacement (pdf)
I printed out two per page as it fitted nicely in their books. The descriptions are deliberately vague to allow it to be used in different experiments.

(The usual warning regarding food allergies and beliefs stands. Some jellybeans have animal derivative gelatine – please check, you don’t want to accidentally upset a student)

291. Elves and Trees

elf-clip-art-elf1

Image credit: www.clipartpanda.com


Here is a quick festive probability resource for you covering elves, outcomes and tree diagrams. The task starts with logically listing outcomes, before looking at working with tree diagrams in the extension.

Elves outfits tree diagrams (pdf)

283. Splitting the steps – Rearranging Equations

Last year I put together some resources using the ‘Splitting the steps’ model which was introduced to me at a talk by Bruno Reddy (@mrreddymaths). I’ve realised I didn’t upload this one at the time!

This worksheet takes you through rearranging equations through two sets of questions, plus extension. The helpful hints and structure are gradually removed. You’ll notice that the + sign is left in, even when a – is required. This was specifically done to ensure my students focussed on opposite operations and writing in negative numbers. If you’d rather not have that, there is an editable version too.

Splitting the steps Rearranging equations (PDF)

Splitting the steps Rearranging equations (Word)

If you would like a starter activity relating to this, then go to this blog post on simple rearrangements: 224. No Nonsense Negatives

If you like this splitting the steps activity, try these out:

Splitting the Steps estimated mean

Splitting the steps Rationalising the denominator V2

281. Mathsconf5 resources

Hi to all those who went to Mathsconf5, in Sheffield.

If you liked the proportion snapdragon you can download it here: Proportion Snapdragon

If you liked the trigonometry snapdragon you can download it here: Snapdragon download

There are instructions for it here: Trigonometry Snapdragon

If you’d like a snapdragon template or instructions on how to fold it click here: http://mathssandpit.co.uk/blog/?p=667

If you want more foldables after the Paper Maths session, run by the lovely @MsSteel_Maths, I can recommend this resource: Foldables by Dinah Zike

(Note: this pdf is widely available and a version of it is free to download from Dinah Zike’s website, however if you represent Ms Zike and there is a copyright issue please contact me in the comments below)

276. Desk Data Collection

We’ve all been there. When you do a data topic, it’s nice to use class data – it is easier to discuss/compare and generates irregularities. The tricky bit is collecting it in!

Write it in your book – how do you get everyone else’s?
Write it on paper? – someone has to process the paper
Type it in a classlist on a computer? – long queue for computer, computer out of action if teacher needs to use it
Use a voting system (Qwizdom/Socrative etc)? – good, but subject to user error
Go around the class and read it out? – someone won’t be listening!
Write it on the board? – someone won’t do it/ will put a daft number/ rub out someone else’s result

This was such a nice idea – real life data processed and interpreted by students. We need a quick, accurate data collection solution which ensures everyone contributes. All the ideas above have merit, but how to combine them?

Inspiration struck when I was trying to do this with a bubbly Y10 class – how could I tell if they all contributed to the data? How could I keep track of deliberately daft answers? How can you stop the general milling around and gossiping at the board as they descend on it?

The desks!

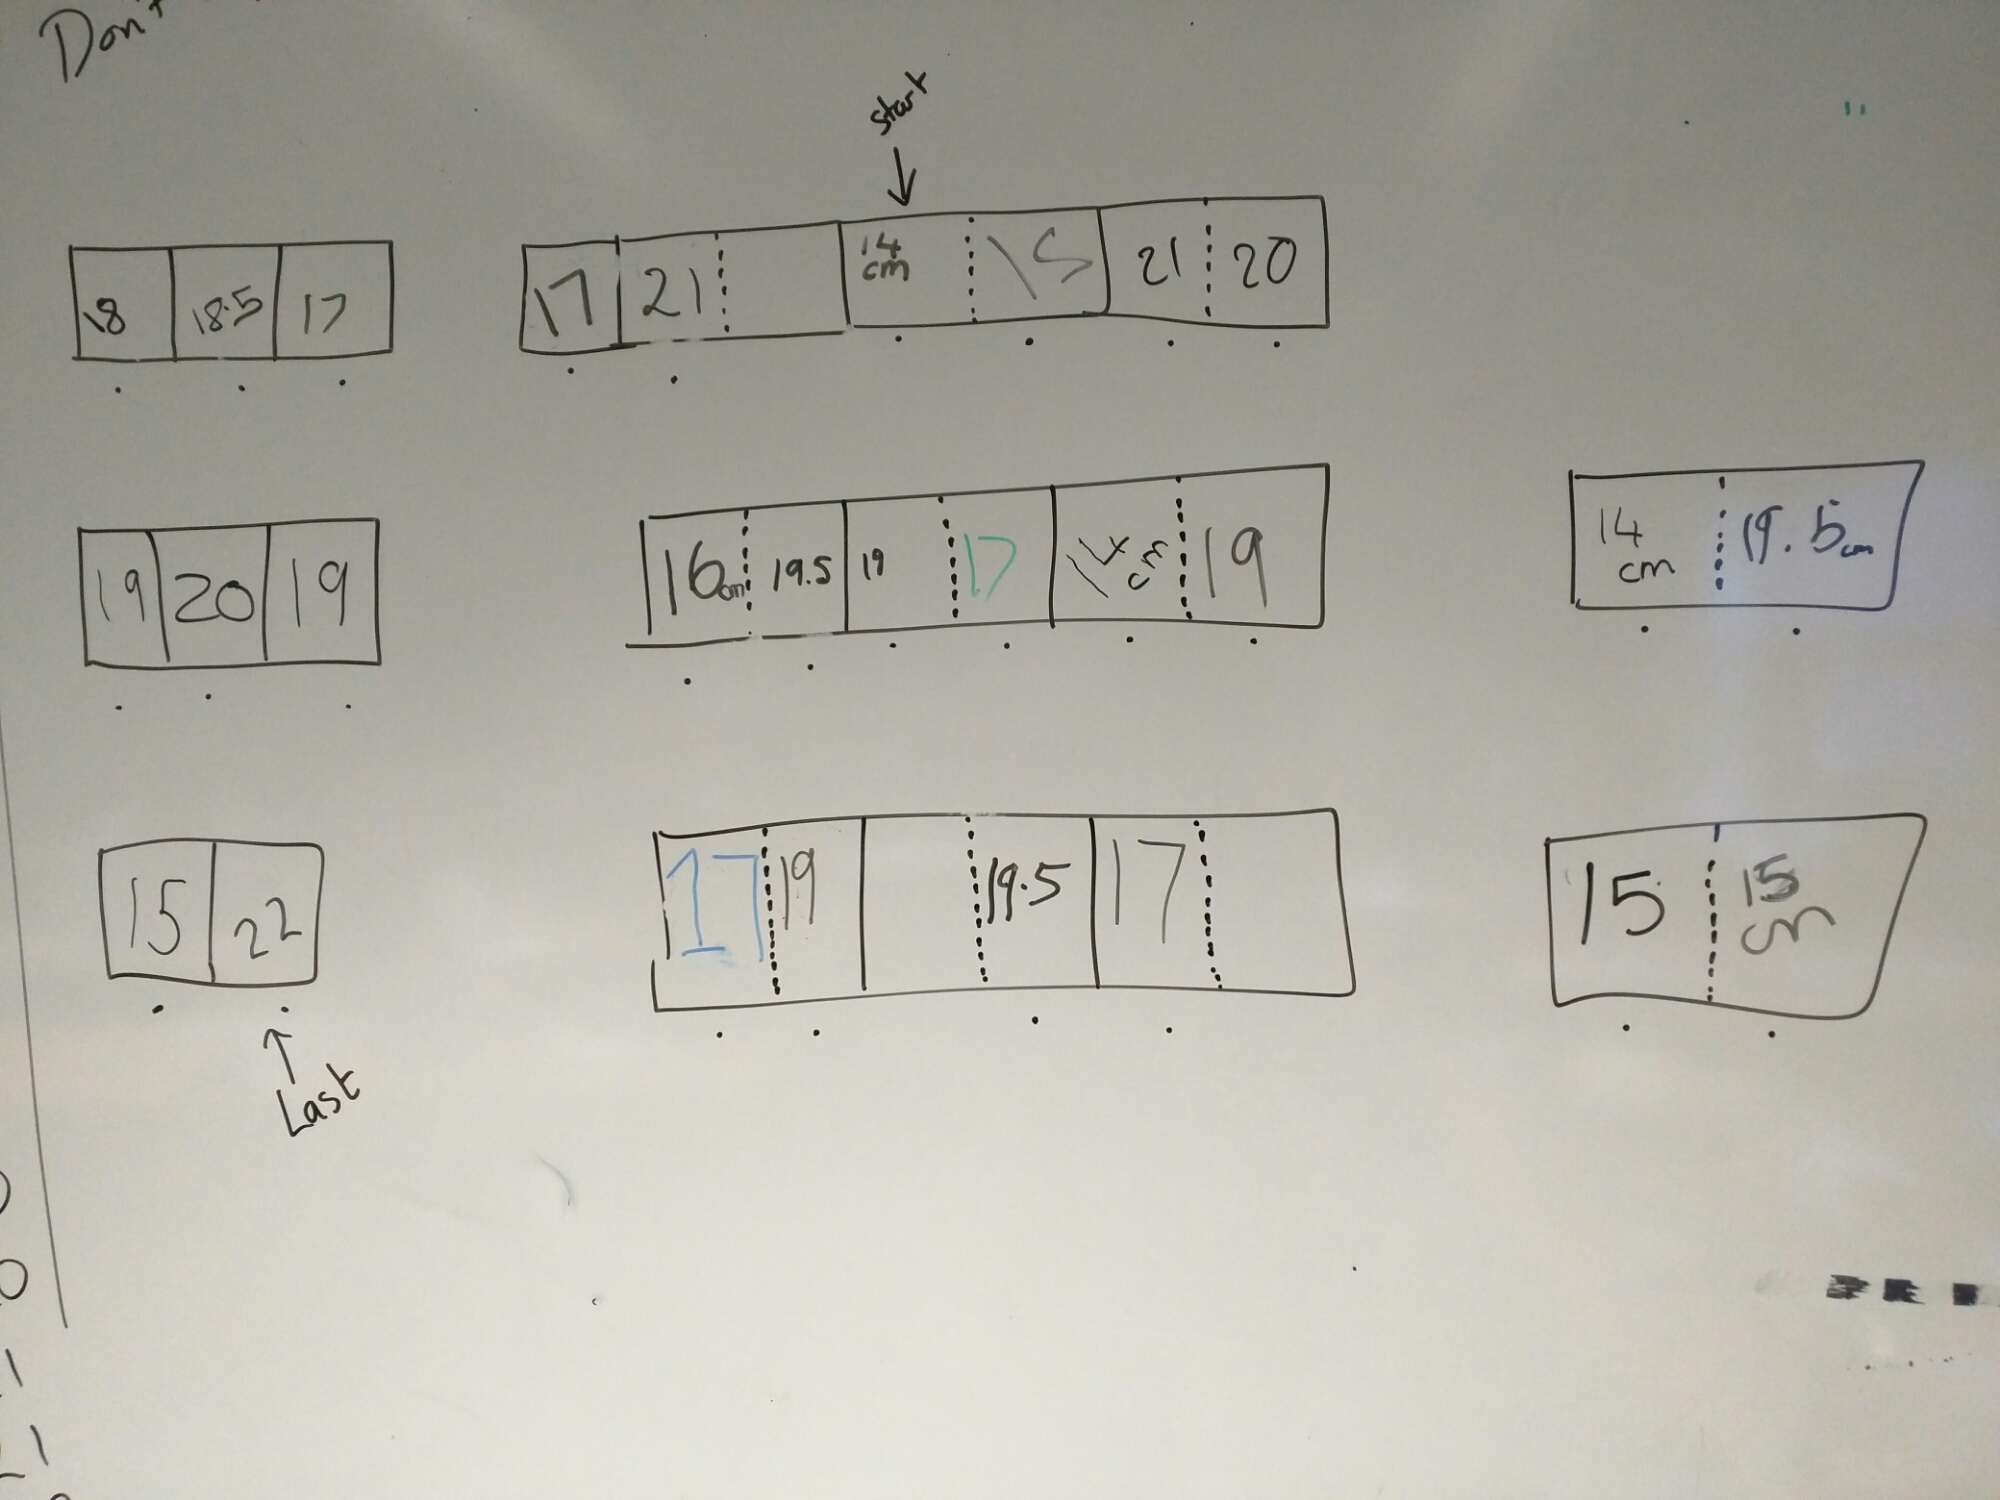
While your class is measuring, sketch out your desk plan on the board. Students write their result in their desk space.

(You can see below that we collected hand span data. The start and finish indicated the smallest and largest widths for listing the numbers in order.)

image

You can keep track of who is finished, without having to stand at the front checking who has contributed. Once the desks are full, you are done. The data collection is structured and you have time to set up the next task.

No fancy technology or processes required!

264. Distance-Time Drama

*HEALTH WARNING*
You may require nerves of steel to complete this dramatic construction of a distance-time graph. A mental swear box may also be handy for everytime you resist the urge to say what you are thinking. Strong coffee is not advisable as you want to be the image of serenity, not a jittery wreck.

Ready? We shall begin …

Aim
To construct distance-time graphs from collected data and interpret the speed from a graph.

Equipment
Metre sticks or tape measure
Open area outside
Pencils
Paper (squared/graph etc)
Ruler
Calculator
Stopwatch (or mobile phone app)
Chalk (optional)
Spreadsheet (optional)

Activity – in theory

  1. Group your students in threes. They will rotate roles between runner, timer and recorder.
  2. Pick four points in your school yard that are a reasonable distance apart. Chalk X’s and A to D next to them. Your graph will start at A and end at D. If you have the space you can create more than just four points.
  3. Students are responsible for measuring the distance between A & B, B & C and C & D. These are the three activity stations.
  4. Students take it in turns in their groups to run (walk, hop, dance etc) between two points. The time for each student at each station is recorded.
  5. Once the data is collected, students gather the information in a table – cumulative time & distance columns will be helpful for plotting a distance time graph.
  6. Each student draws three graphs, on the same axes, to represent the speeds of their group.
  7. Each student then calculates their speed for each station. They can compare their calculations with their group and what is going on in the graph. Hopefully they will deduce that the gradient of the graph represents the speed.

Activity – in practice

Where to start?

Please … don’t be disheartened if your activity starts like mine did! We got organised and went outside. I designated groups to stations and they started measuring, moving onto the next station when they were done.

One group came up to me and complained that the distances were all the same. Rather than hold onto the end of the tape measure at the start, then measure, this group put the end on the ground, spooled out the tape measure and walked to the next station – trailing the end of the tape along the floor.

A second group complained that the other groups were spending too long on measuring when they were waiting for a tape measure. I’d counted them out one per group – where was it?

‘Oh, we left that in the classroom’.
Mental gnashing of teeth.
‘Would that be the locked classroom?’ I ask
‘Yeah … we’ll get it’ off run two students
They come back complaining the classroom is locked!

Okay … we get the measuring done. Then they start running and timing. I check on one group and notice they are merrily taking all of their times away from ten minutes. They explain the mobile phone is counting down from ten minutes. Although I was impressed by their ingenuity, maybe changing the phone mode would have been more appropriate.

And let’s not mention the student who, on the final station, accidentally wiped all the results off the mini-whiteboard …

Then a miracle happened!

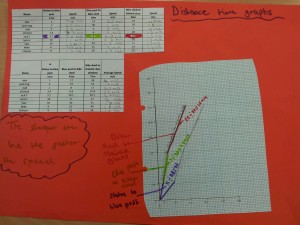
I collected their data together on a spreadsheet and projected it on the board. We discussed any anomalies and how we would progress. We decided neat printouts would help. They drew their graphs, colour coded their data and observed the gradient link to speed. I was very impressed by the speed at which they grasped this concept and proud of their (eventual) independent work.

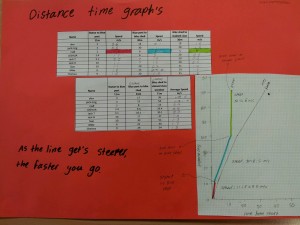
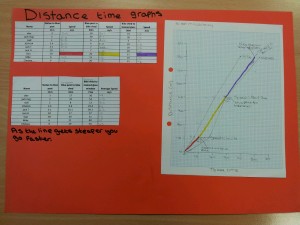
Here is a sample of their work:

wpid-2015-03-02-14.23.33.jpg.jpeg

Example 2:

wpid-2015-03-02-14.24.12.jpg.jpeg

Example 3:wpid-2015-03-02-14.24.45.jpg.jpeg

260. Filter Maths

There is a moment of satisfaction to be had when the last drip of filter coffee drops into the jug: a lovely aroma of fresh coffee and the anticipation of a well-earned drink.

coffee-cup

Image Credit: http://vidacoffeeco.com/

Don’t worry, the ‘Sandpit’ hasn’t gone all hipster foodie overnight! The slow drip of coffee leading to a rewarding cup matches perfectly with the slow drip of revision, leading to a rewarding grade.

The exam season is fast approaching and the photocopiers are starting to crank out past papers. You start handing out papers and expect them to hand them in …

That’s the point it starts to go wrong:

  • They don’t hand them in.
  • They give up halfway through.
  • They skip pages and it takes you ages to find what they’ve done.
  • They lose confidence.
  • If you issue A5 size booklets they lose them.
  • If you issue A4 size booklets, they complain and the booklets get mangled.
  • You get frustrated – don’t they realise it’s for their own good!

This year, why not try out this idea instead:

  • Hand out the exam board formulae sheet.
  • Hand out the grade boundaries.
  • Hand out the first four pages reduced to A4, back to back.
  • Collect in the first sheet.
  • Repeat for the next four pages.
  • Collect in the second sheet.
  • Repeat until the questions start getting harder, then decrease it to two pages back to back.
  • Continue until the paper is finished.

This is time-consuming and it is best started well in advance of the main revision period, but it works. The individual sheets have a manageable amount of content and are less intimidating – they also weigh a lot less than 33 exam papers. As a teacher, you get a clear picture of which areas to revisit as the topic list is short. Each student keeps a running total of how they are doing on the paper. The grade boundaries sheet lets them keep track of their progress towards their target grade.

The consequence of doing this process with a couple of papers is that students feel more confident approaching papers. They will start to notice themes in the wording and topics. They will also realise that it’s important to ‘bank’ as many marks as they can in the first half of an exam paper.

My class responded well to this drip-feed of questions. After the first sheet they felt proud of themselves when they realised they’d achieved a grade D in just four pages of a Higher paper and were calculating how many marks they’d need for a C. The number of late homeworks dramatically dropped and the effort level went up.

This idea is simple and non-subject specific. It would work equally well with physics, chemistry, biology … in fact any paper which has a fair number of questions.

Good luck with the revision!