Category Archives: Problem Solving

247. The Elf Challenge

It was the month before Christmas and all through the house not a creature was stirring – except for the senior elves who were on the brink of all out war. Father Christmas had picked up some leadership strategies on his travels and decided to send his management elves on a team building day … paintballing!

Don’t be fooled – this is no simple Christmas time-filler. This task requires problem solving strategies, two-way tables, averages, data analysis and logic. In fact, you might want to have a go yourself. There is a task sheet, support sheet and solution.

The Elf Challenge (pdf)

Enjoy the puzzled faces and watch the arguments when students try to justify their answers.

246. ChrisMaths Cheer

Hey … it’s that time of year again! Baubles and cheesy jumpers are creeping into the most mundane of places. How about a more mathematical festive season?

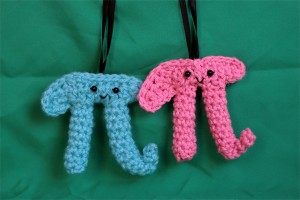
tb-piornaments

Image credit: http://technabob.com/blog/

Here is a round up of the Sandpit’s Christmas resources:

Twelve Days of ChrisMaths

245. Fair share

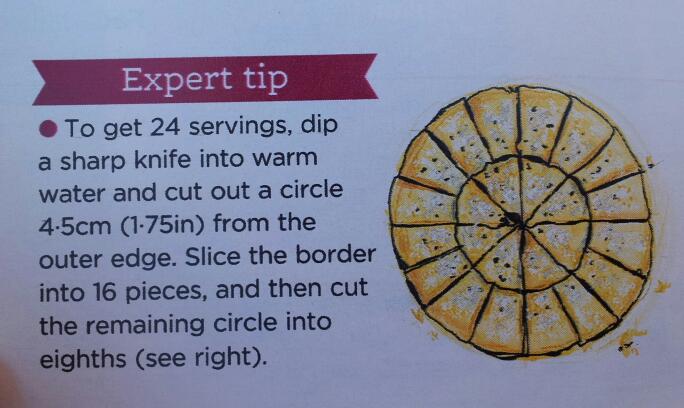
I spotted this ‘Expert Tip’ whilst flicking through a supermarket magazine:

image

Image credit: tesco.com/foodandliving

Question
If this cake has a diameter of 18cm (7in), is this a fair way to split it between guests? Can you prove your result in general terms?

Of course, this assumes that the icing on the side doesn’t count in the diameter or guest preference.

243. Messy Means

I have recently been teaching lower ability Year 9 students how to calculate the mean from grouped and ungrouped data tables. I didn’t want to teach them a method to learn by rote, so I used a more investigative approach.

mr-messy-mykea

Image Credit: http://www.thisismykea.com/designs/mr-messy

Grouped Frequency tables discussion

Estimated messy mean A (pdf)

I started with a table with all the working shown, but some information blacked out. Each group had an A3 version and they filled in what was missing.

Estimated messy mean B (pdf)

The second table had more information covered up. After a discussion the groups decided there wasn’t enough information and they would have to guess what the missing numbers were.

Estimated messy mean C (pdf)

The third table had minimal information. Each group used their own method to find the missing values. Some chose the largest value in the range, some guessed what the results could have been in each group and one group decided to calculate two means – one using the largest value and one using the smallest.

We collected our results together on the board and discussed their accuracy. The class decided to use the middle of each range to calculate the estimated mean. They had gone from no understanding of estimated mean to formulating their own method.

We followed this up a Splitting the Steps estimated mean worksheet that I wrote after seeing Bruno Reddy’s presentation after #MathsConf2014 (Mr Reddy’s blog).

Follow him on Twitter: @MrReddyMaths


242. Edible Inspiration

Calling all creative thinkers!

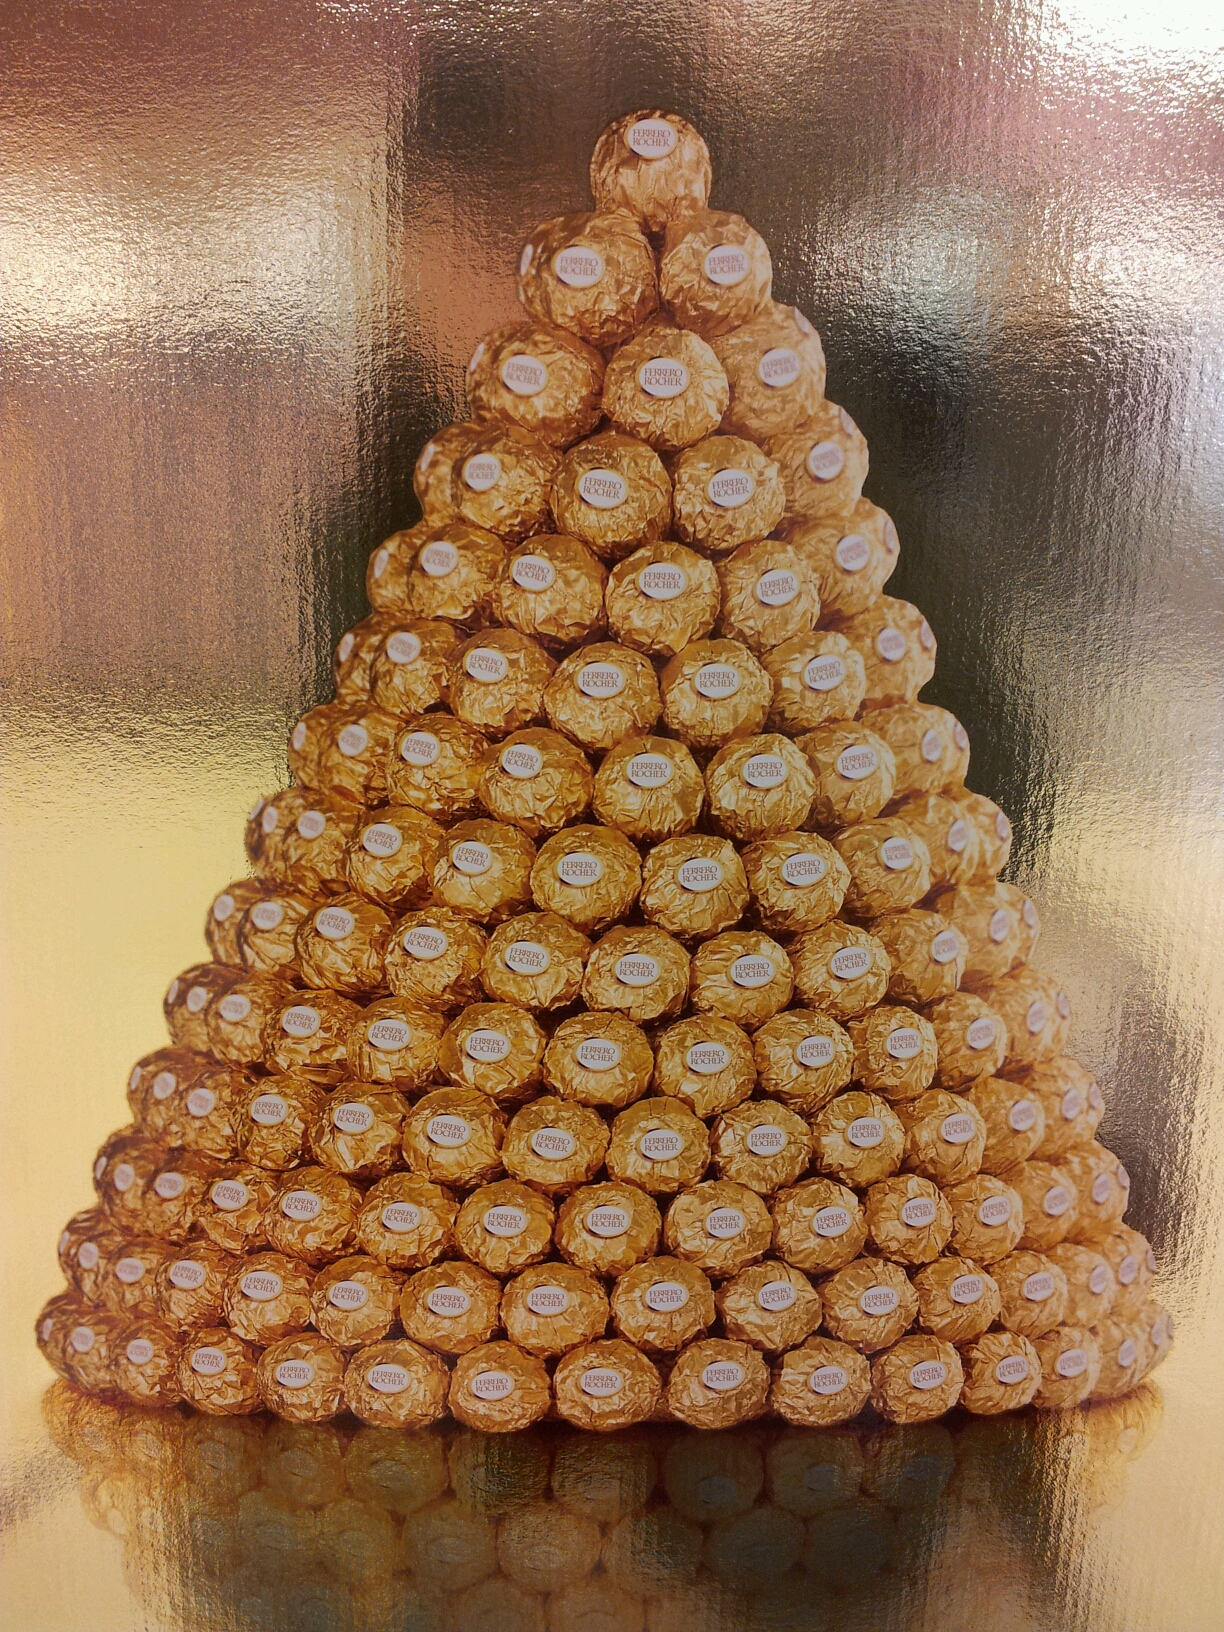
What mathematical questions could you set from this picture?

image

Here are a few to start you off:

1. Sequences – do the increasing  number of chocolates in each layer form a sequence (in 2D, in 3D)? If so, what is the general term? Is it geometric or arithmetic?

2. Series – if it is an arithmetic sequence, can you find the sum of a finite number of layers? Which layer would have the 1000th chocolate?

3. Geometry – what shape must the layers be in order to form this structure? Is there a pattern to the layers? Could you stack these in a different way to form an equally stable structure?

4. Money – if a standard box holds 12 chocolates, how many boxes would a 2D or 3D version of this require? What is the cost? What if they came in a larger box? Could you save money?

5. Health – how many calories are there in the tower? How far would you have to run to burn off the calories? How many ‘average’ meals is it equivalent to? How many fastfood burgers? How sick would you feel after all that chocolate?!

Instead of setting a question, why not ask your students or even your trainee teacher what questions they can come up with?

240. Cogged up

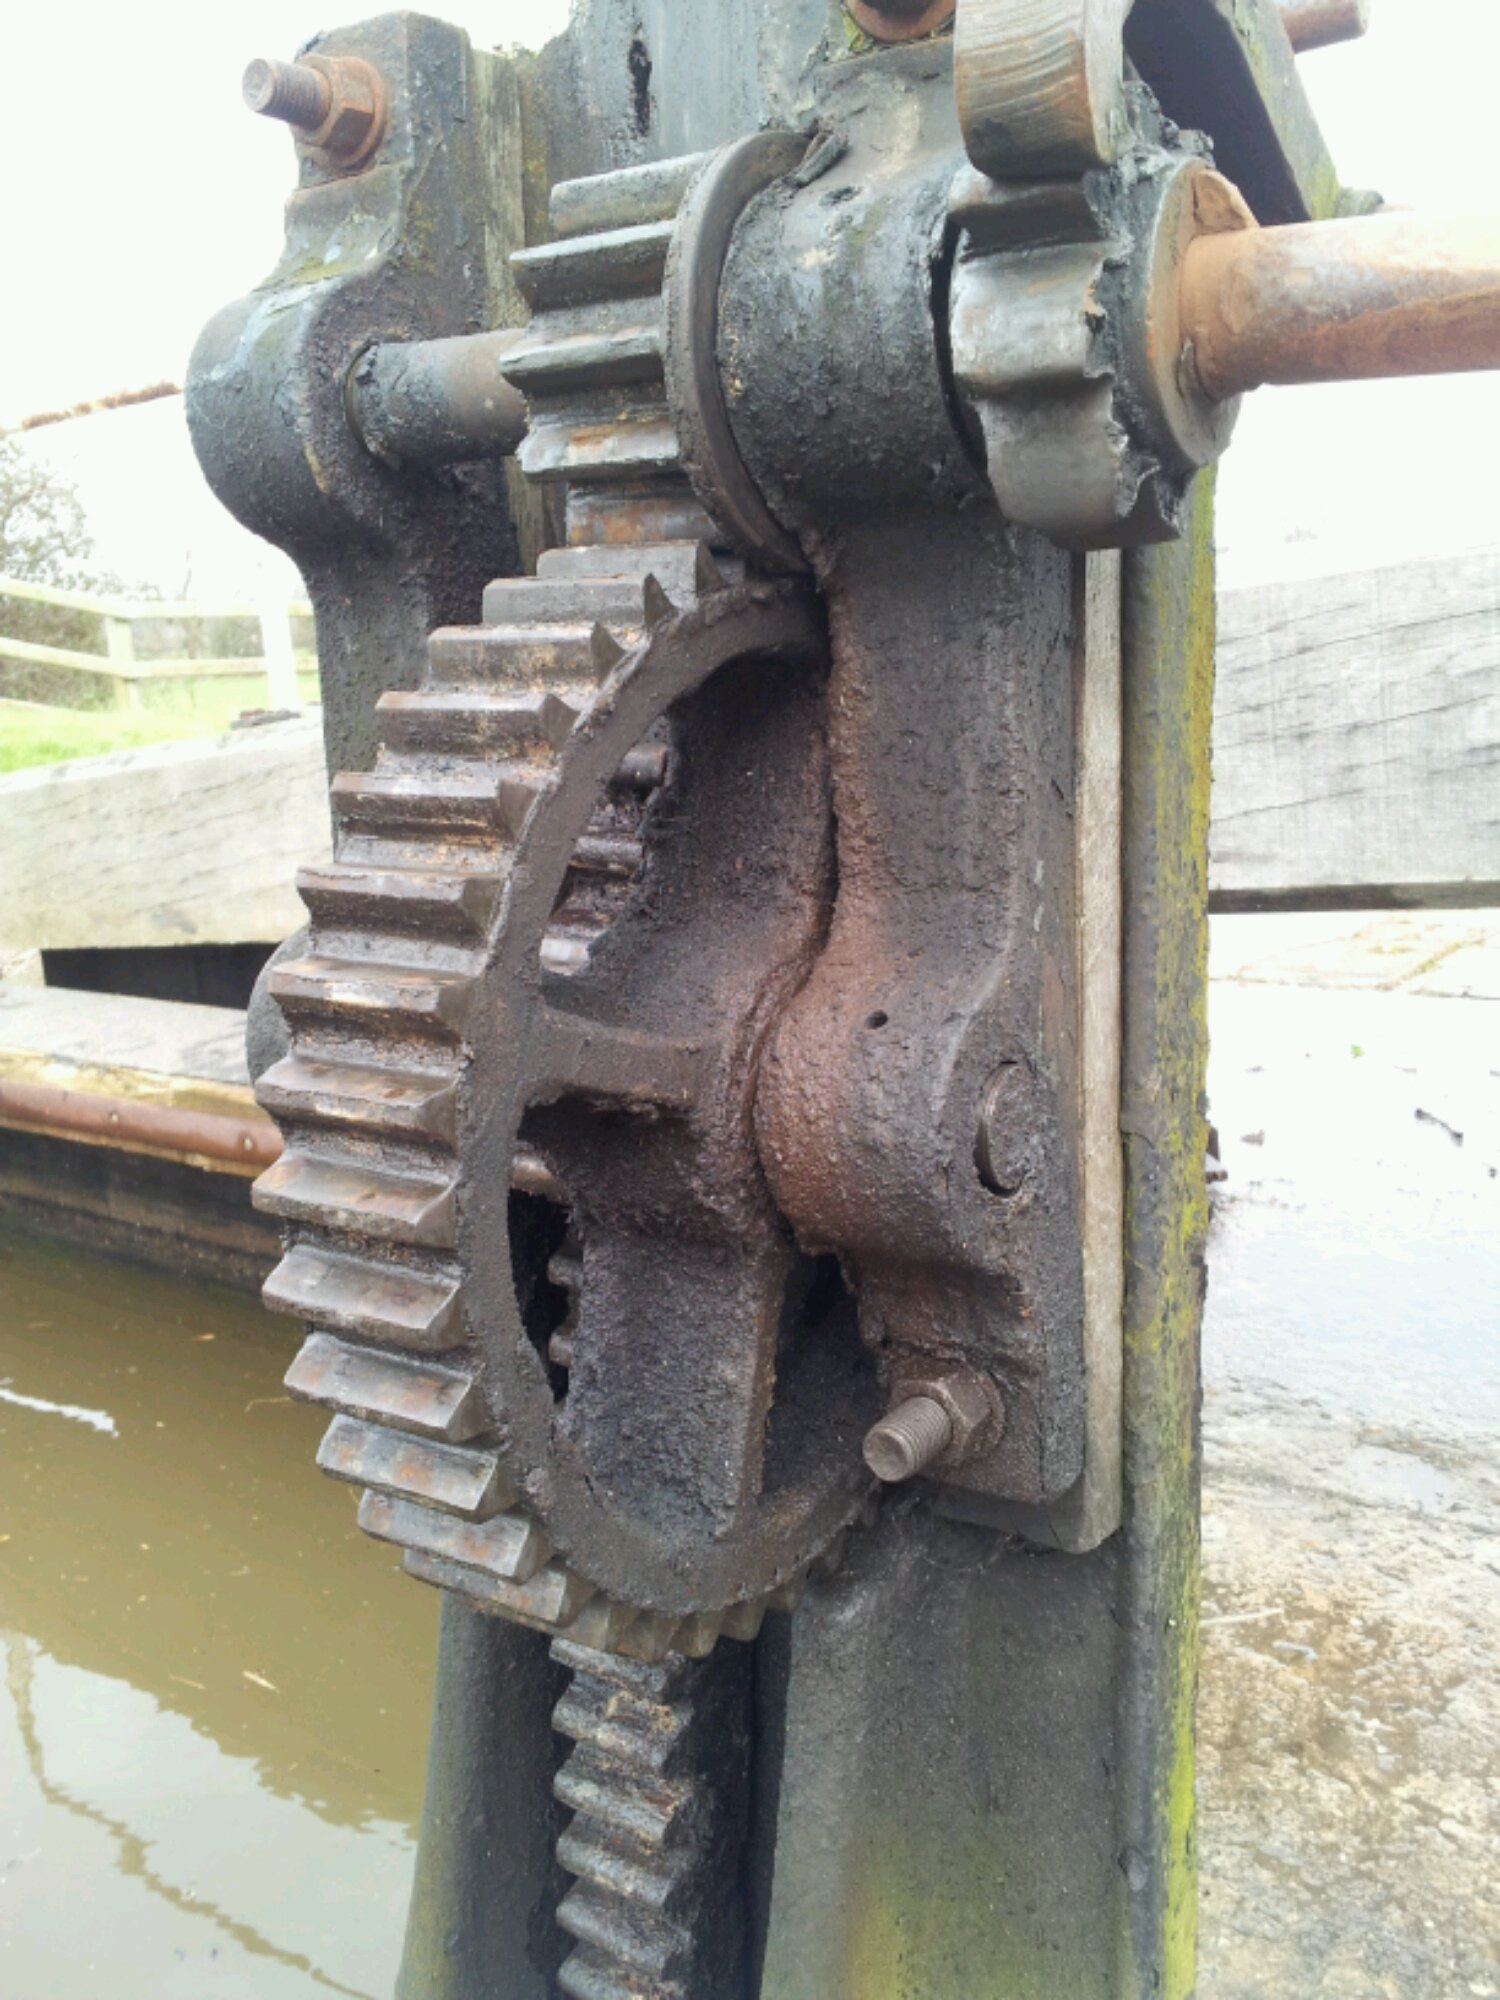
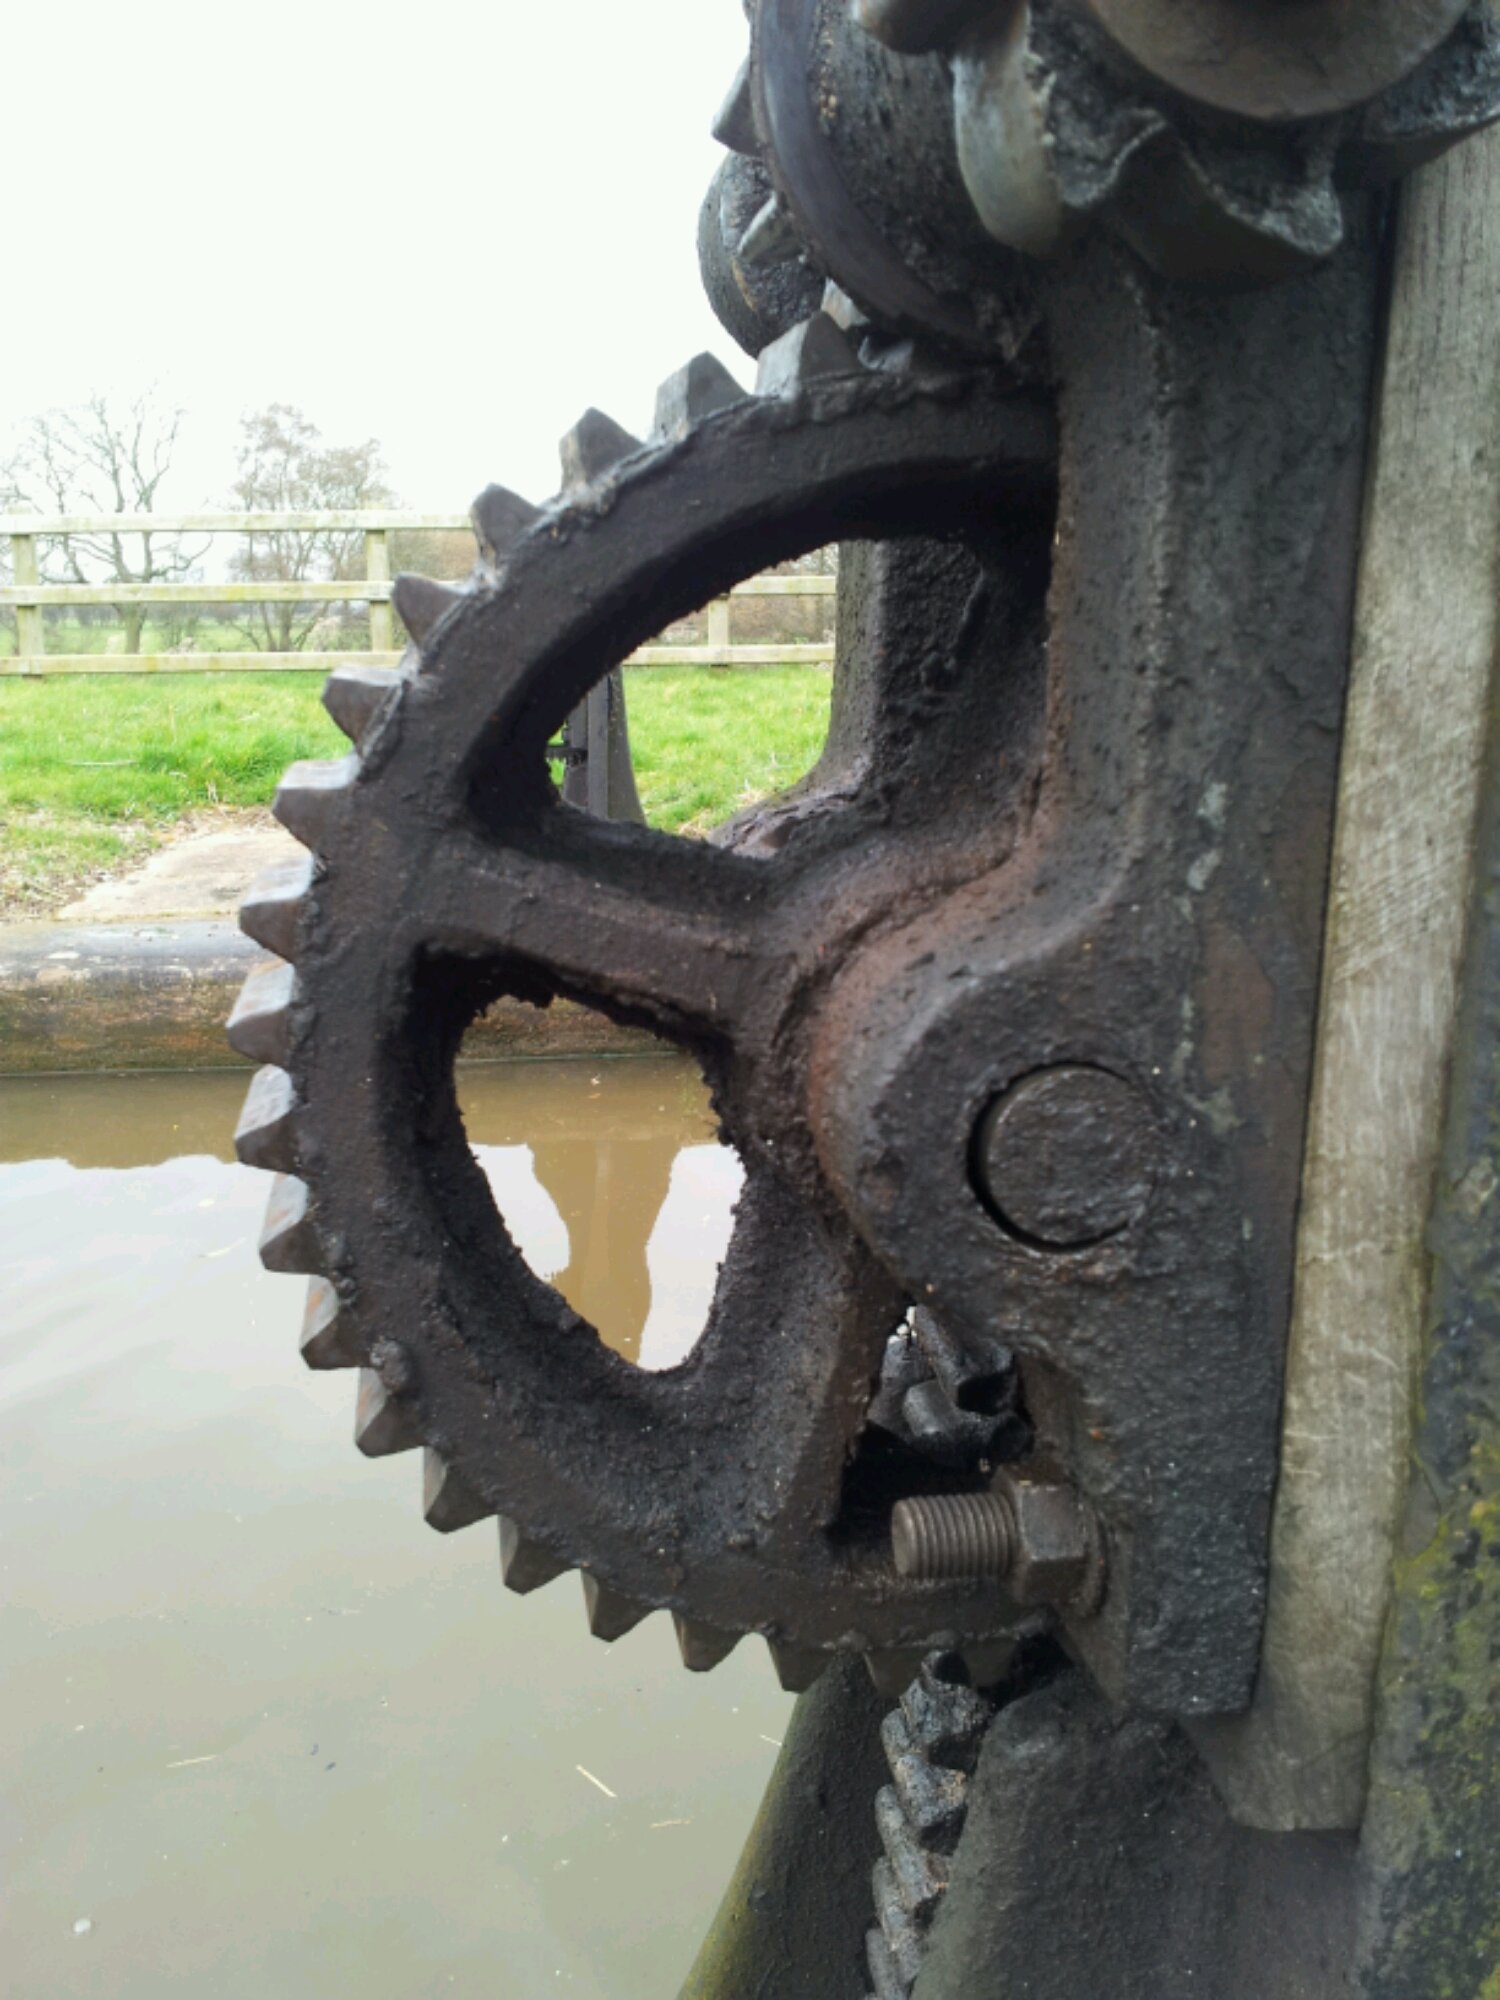
It’s amazing what maths you see when you go for a walk along a canal on a beautiful afternoon. After helping a canal boat through a lock, the following problem occurred to me: how many times must you turn the handle to raise the sluice gate?

Fact: The sluice is controlled by a series of cogs. The handle turns a ratcheted cog with eight teeth.

image

Fact: The handle turns a small cog with thirteen teeth.

image
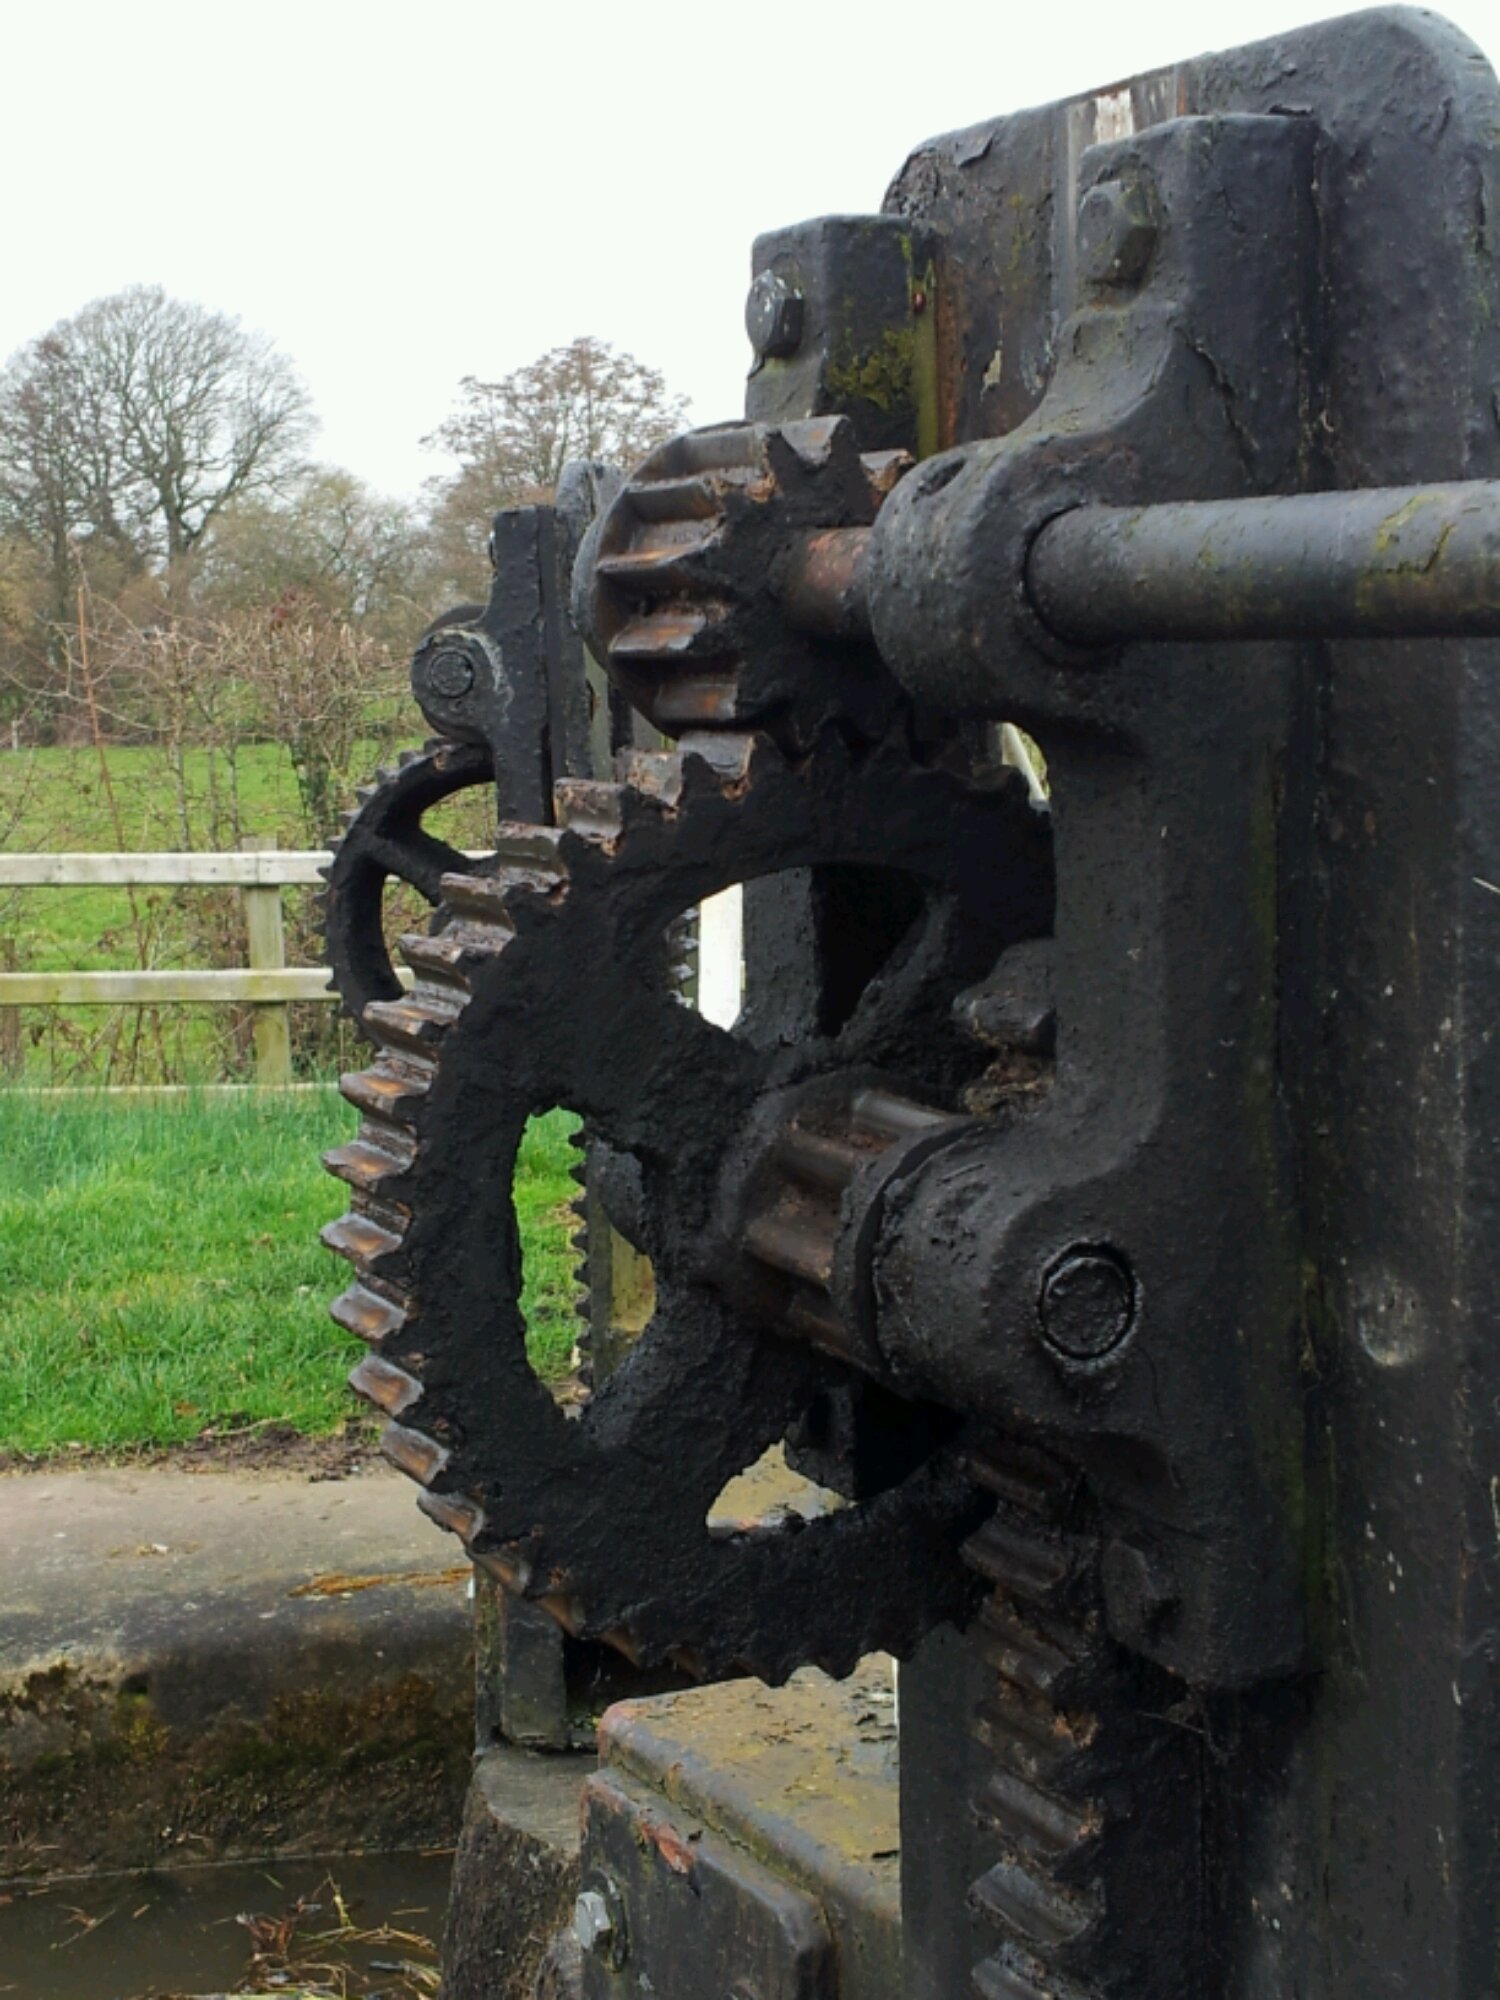
Question: The next cog has ten teeth on a quarter of it’s circumference. How many is this in total?

image

Fact: This large cog is attached to a small cog with ten teeth, which lifts the vertical post.
image
Question: From the picture can you estimate how many teeth are on the vertical post?

image

Question: Given all this information how many turns does the handle need?
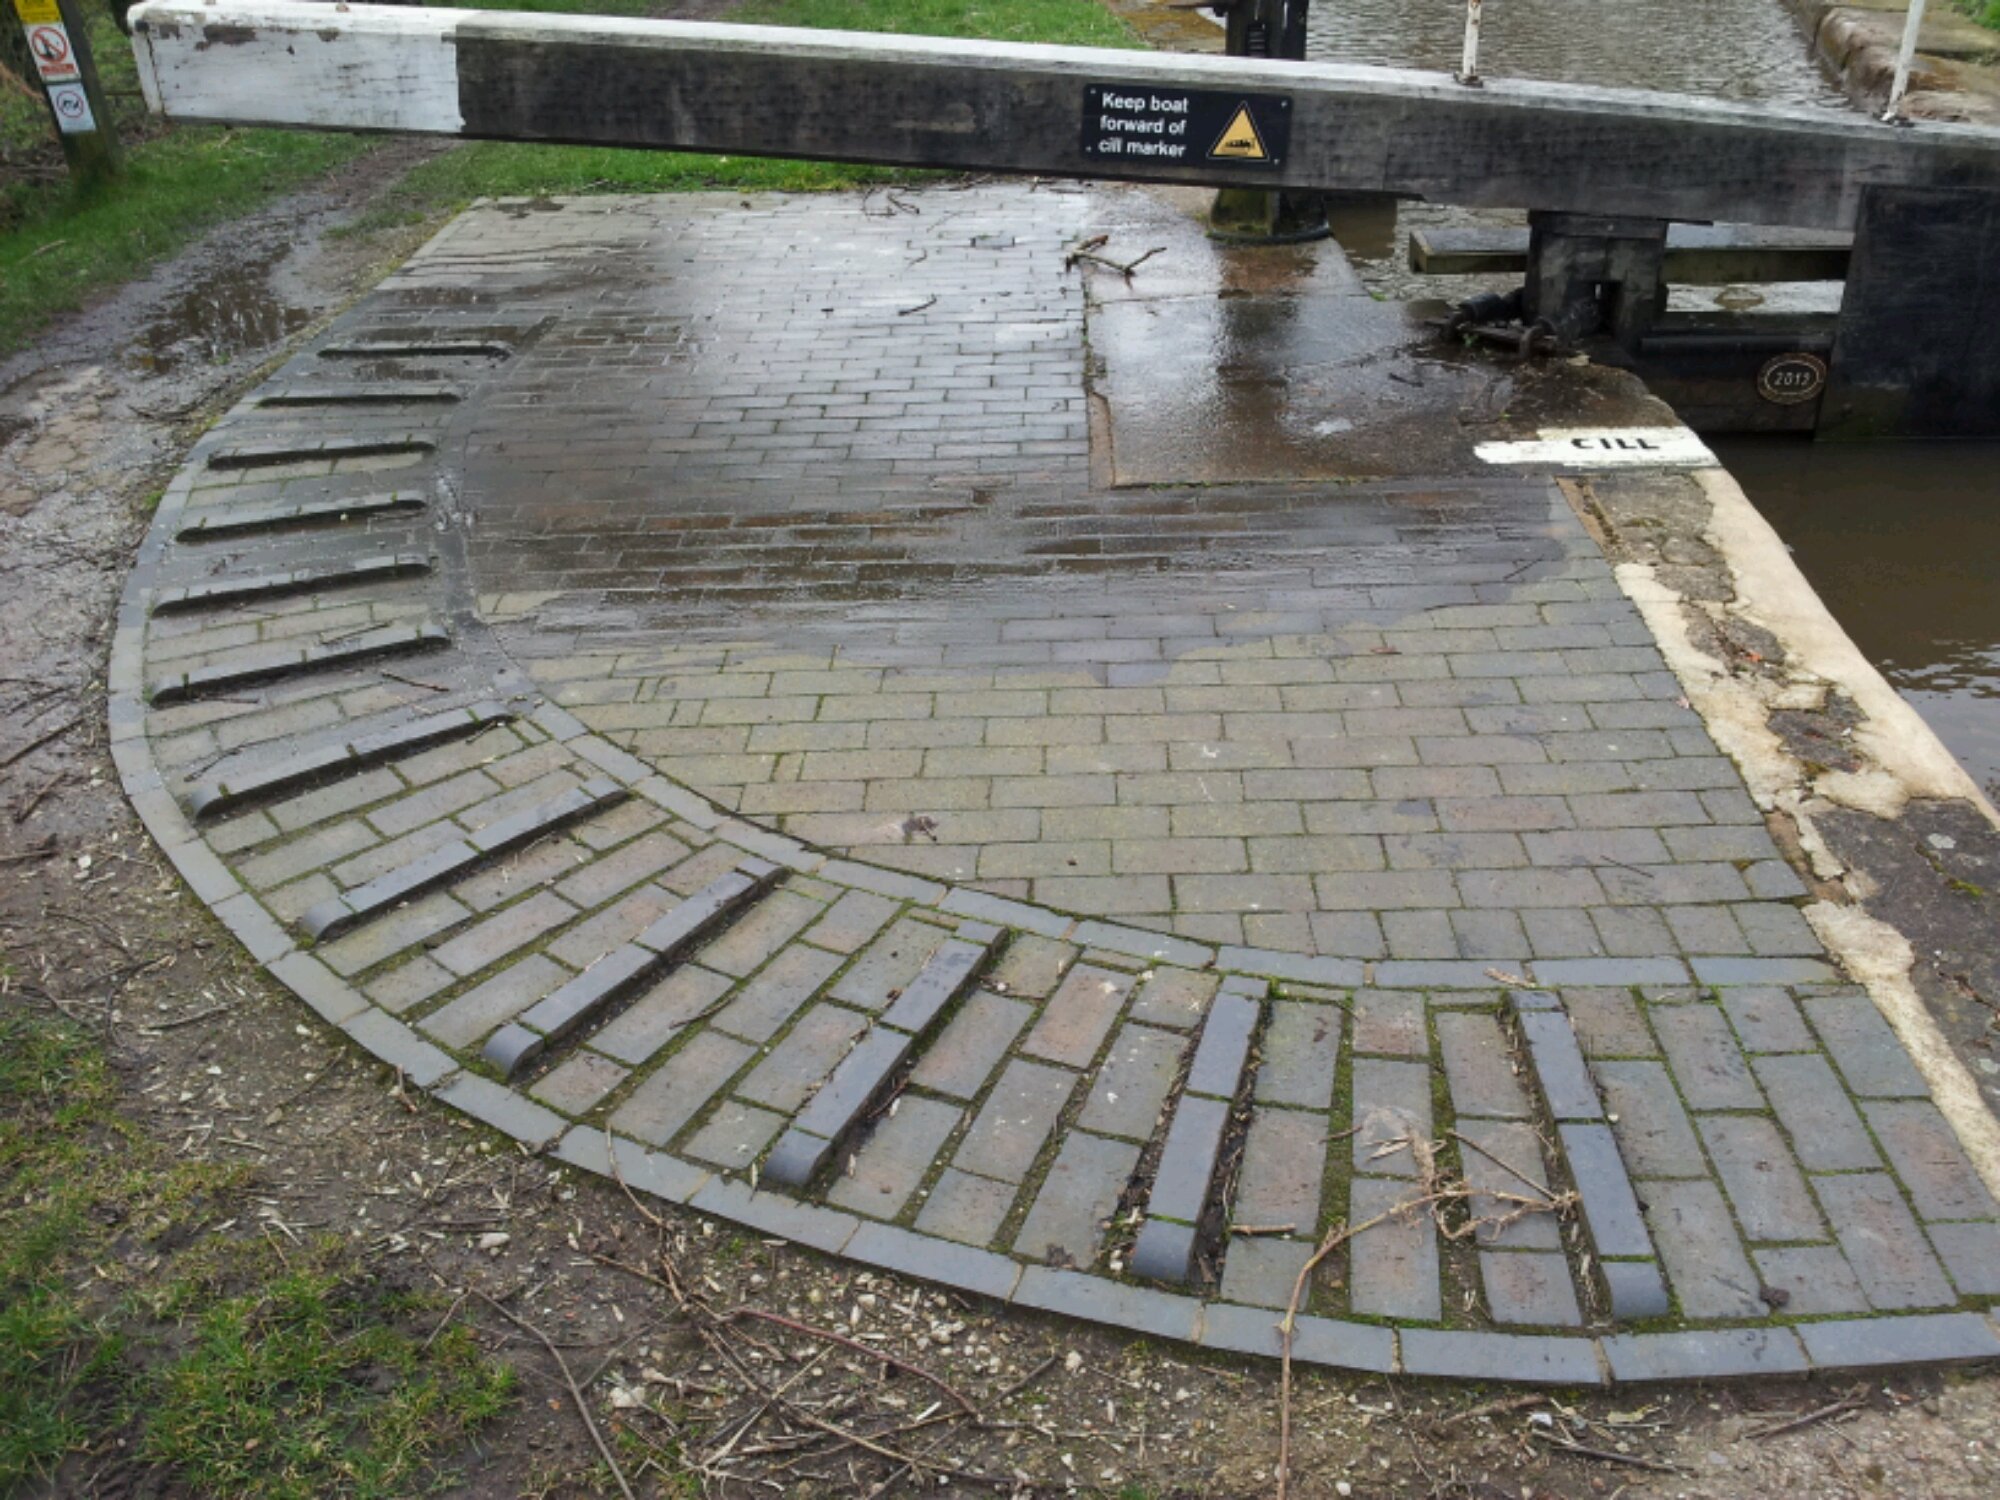
Extension: Look at this picture. What is the angle between the foot supports?
image

237. Quick Starter

Don’t you just hate it when students forget basic key skills? Especially those at the higher end of Year 11 or studying A-Level, who should have a better core knowledge. What if there was a magic tool which began to address this issue?

Skills required

  • Comparing fractions
  • Trigonometric ratios
  • Simplifying surds
  • Rationalising surds
  • Pythagoras

Equipment

You will not need:

  • Worksheet
  • Powerpoint
  • Printer
  • Laminator
  • Calculator

Magic Tool

  • One board, with pen

Activity

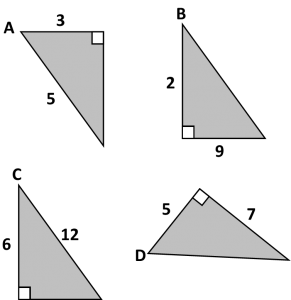
Quite simply draw the four diagrams below on the board and ask the following questions:

Triangle Problems

  1. Which has the largest sine ratio: A or B?
  2. Which has the largest cosine ratio: C or D?
  3. Which has the smallest tangent ratio: A, B, C or D?
  4. Extension: Calculate the missing angles and areas (Calculator allowed)

It takes moments to draw the questions on the board, but the discussion can take some time and addresses several basic skills. You can change the numbers to adjust the level of challenge.