Category Archives: Problem Solving

299. Is it good value for money?

Those ‘value for money’ or ‘best buy’ questions always put some students into a muddle. The usual response is ‘The bigger pack is always better value for money, so why have I got to do working out?’

Really? Is that always true?

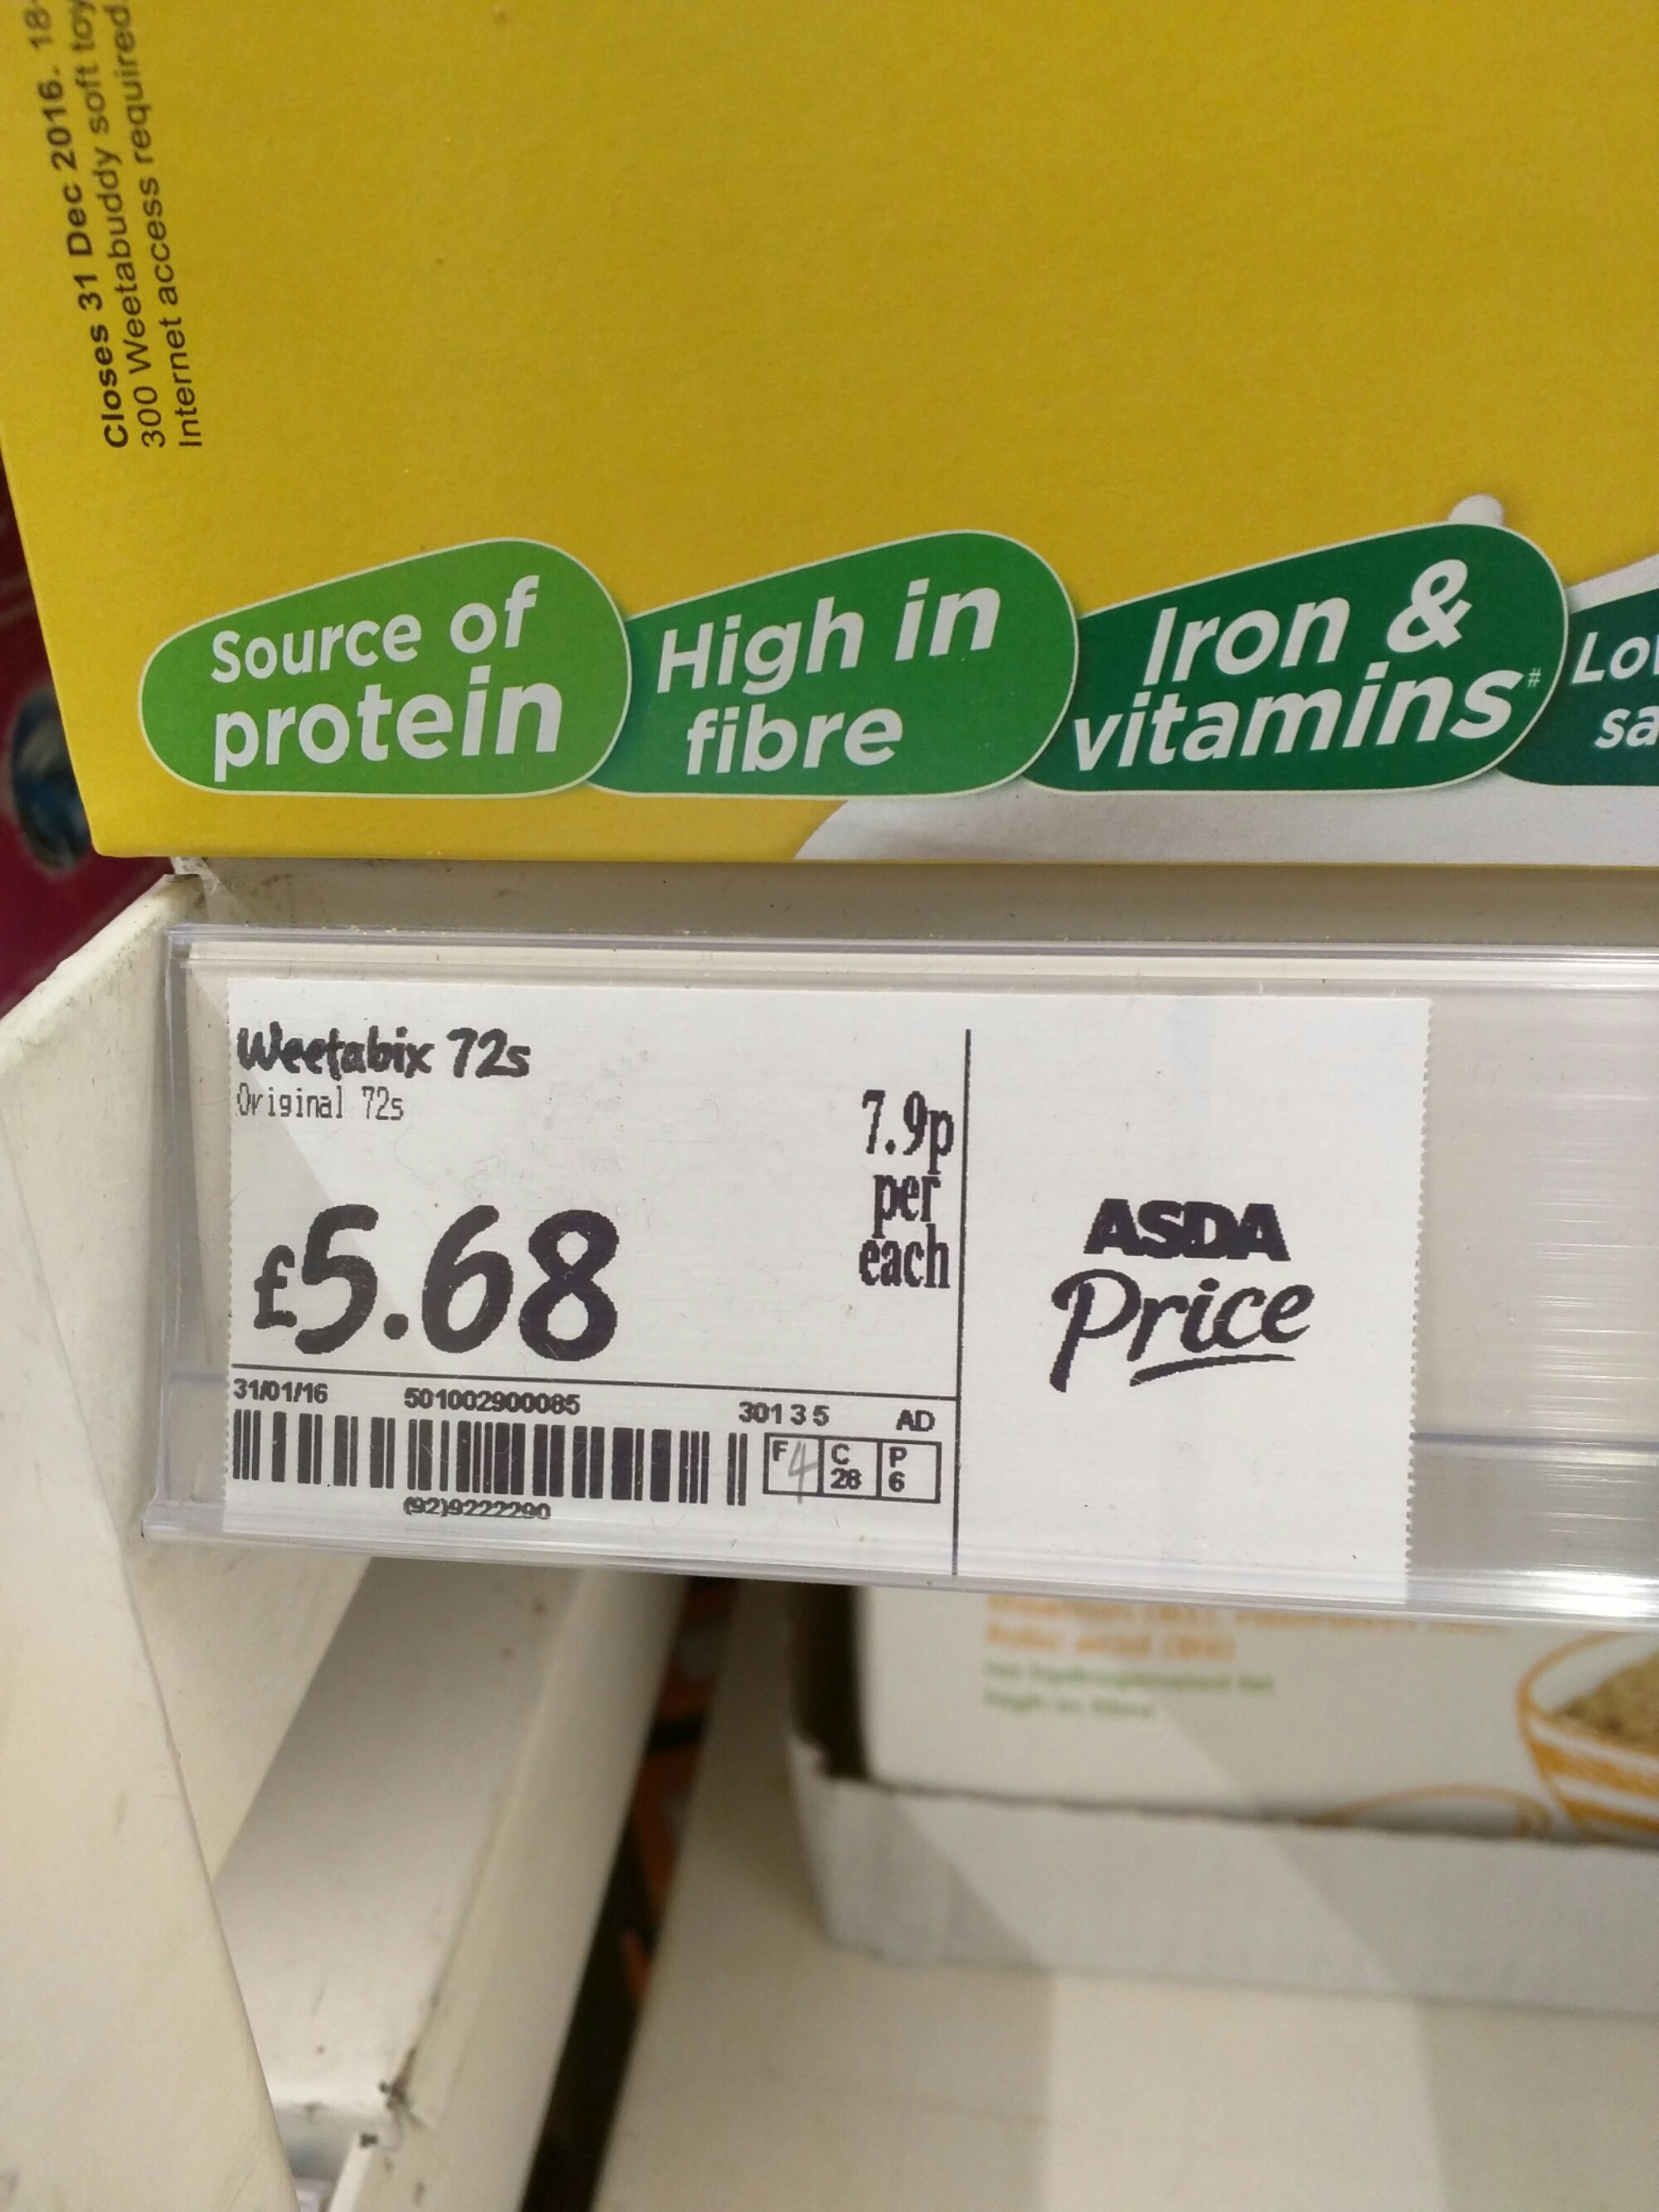
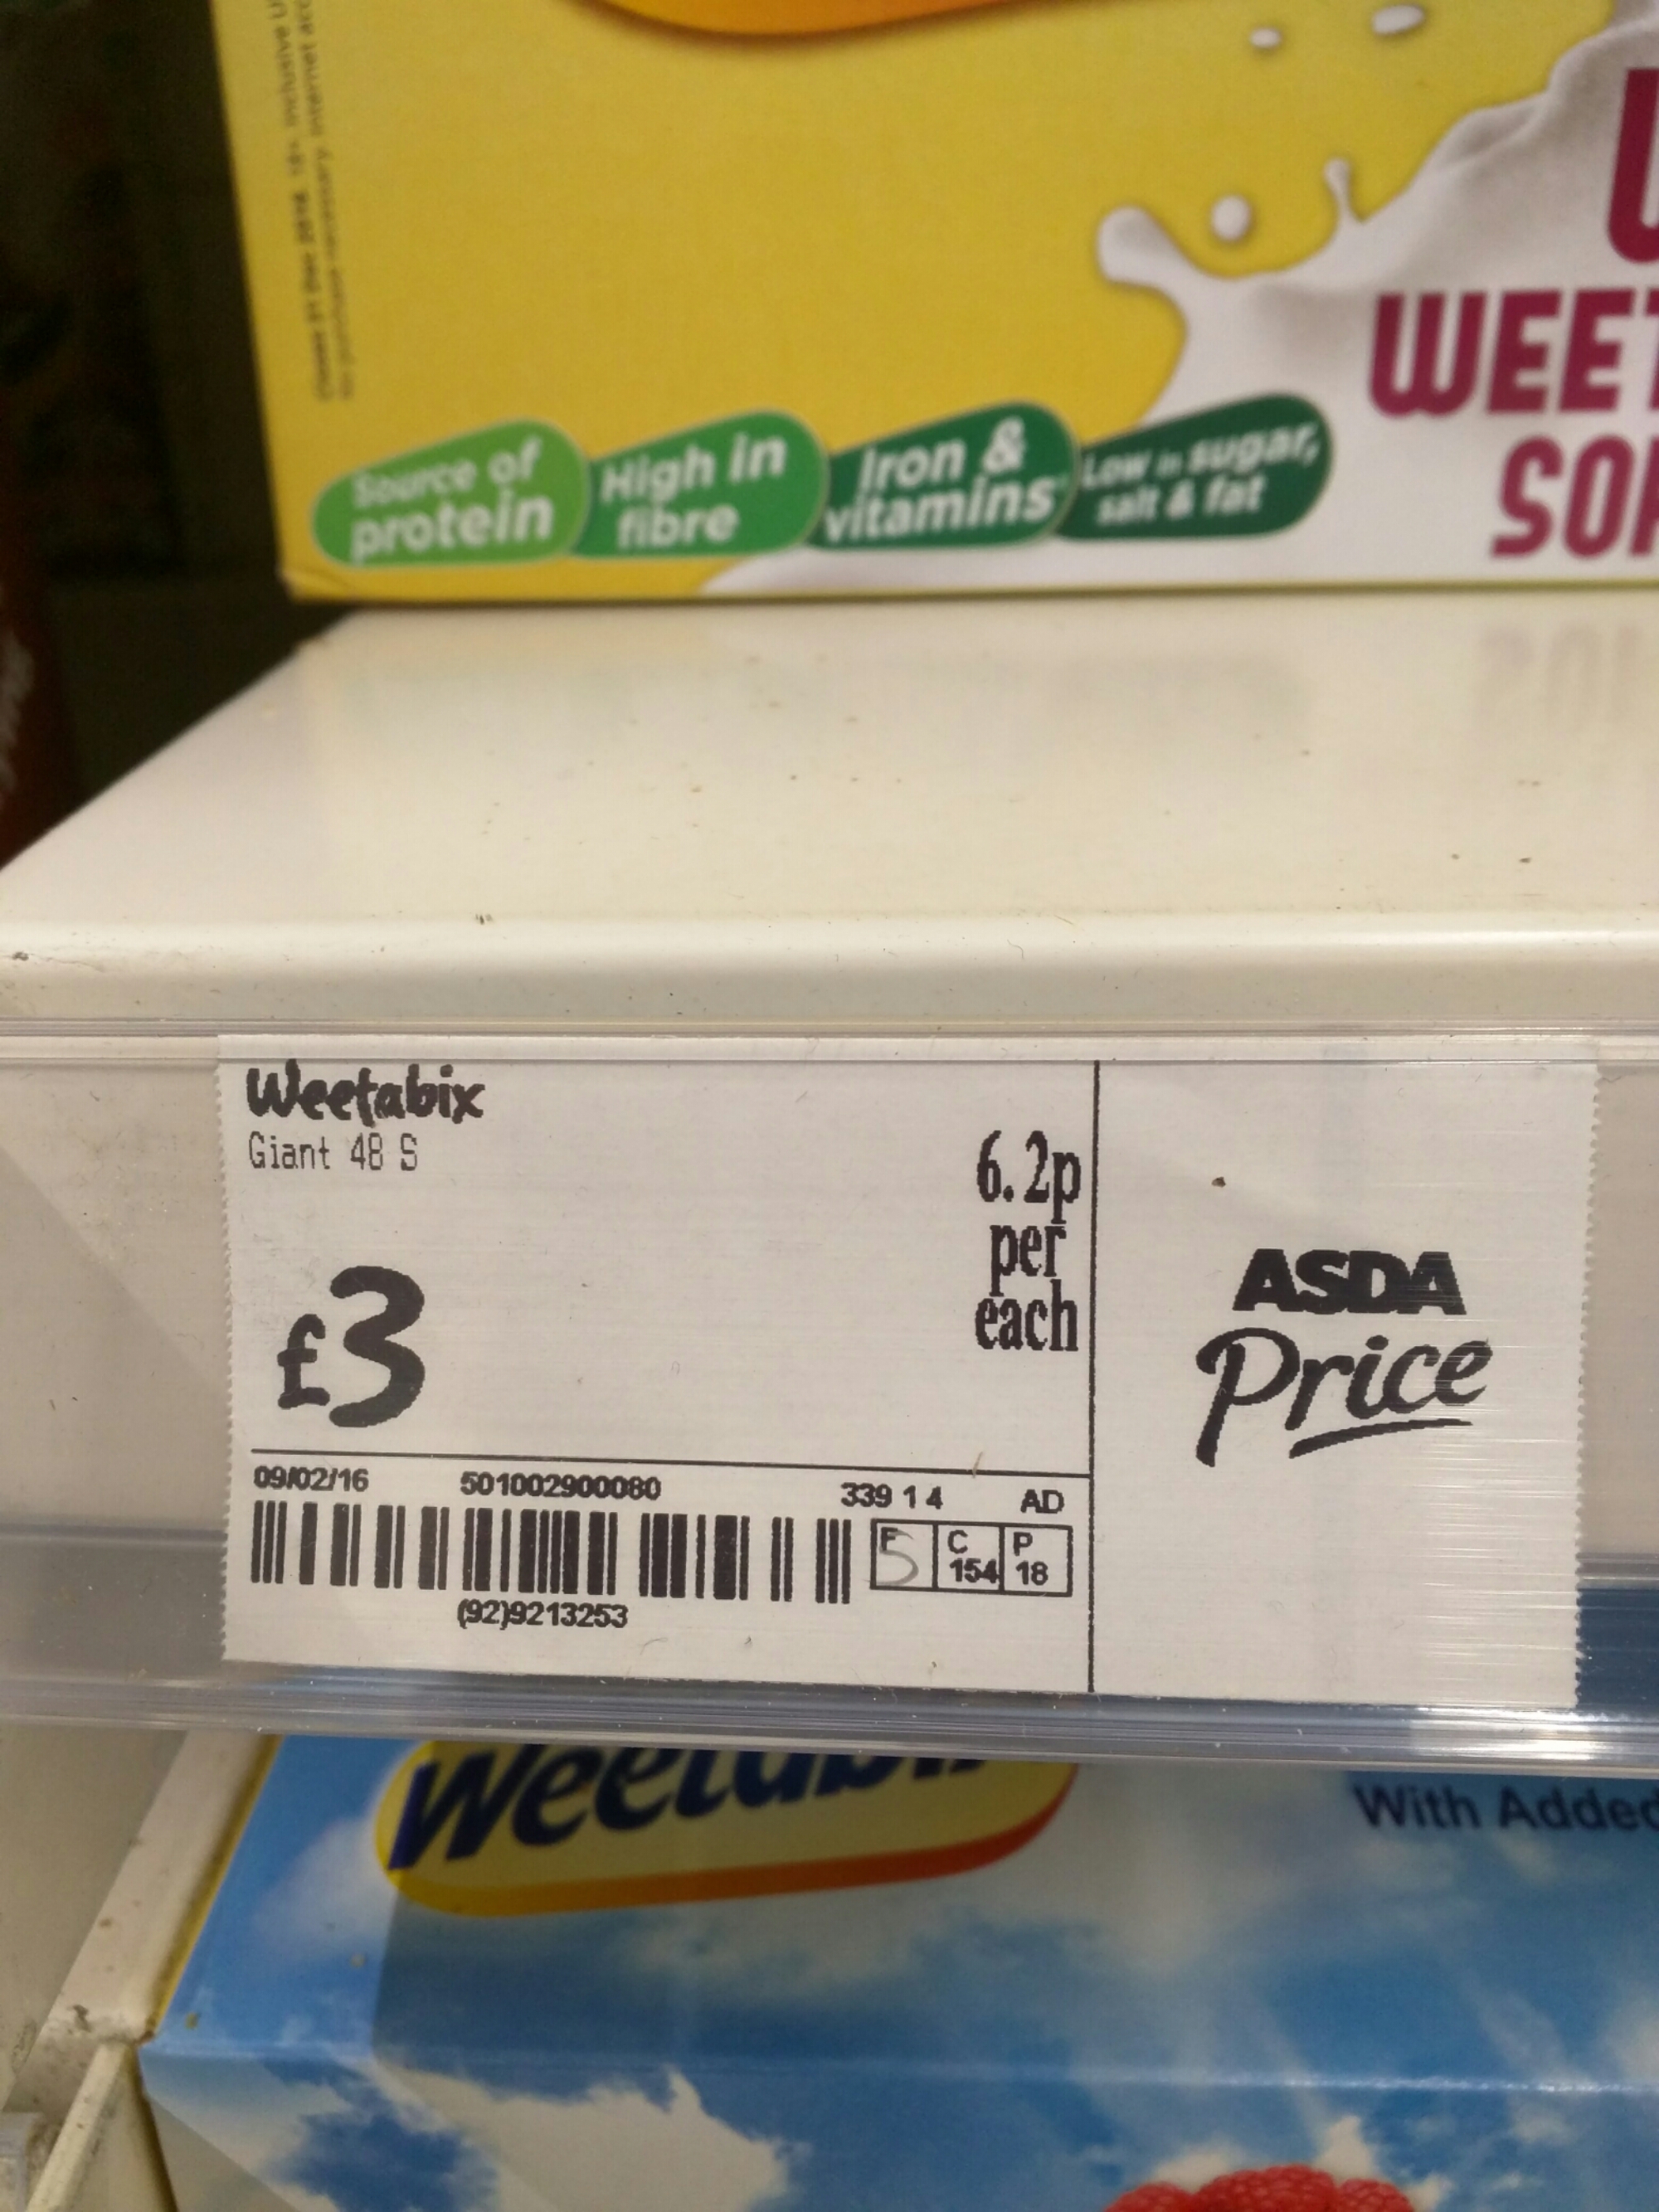
Try these packets of cereal (Weetabix) from Asda:
image

The first one says 72 biscuits for £5.68

image

The second one says £3 for 48 biscuits.

Put the price and number of biscuits per pack on the board and ask students what they think. Once they’ve discussed it you could ask whether they thought that kind of pricing happened in real life.  Then you can pull the starter together by projecting these pictures onto the screen/board.

298. The Mensuration Challenge

Here is a fun little activity, including task sheet, for recapping measuring distance, time and angles.

Image credit: freepik.com

It’s simply a set of mini-challenges designed to familiarise students with practical equipment and get them out of their seats. We had lots of fun measuring all sorts of things – width of a smile, length of a tongue, angle of a nose, time spent on one leg – the limit was their creativity!

Mensuration Challenges (pdf)

Mensuration Challenges (docx – editable)

296. Jellybean Trees

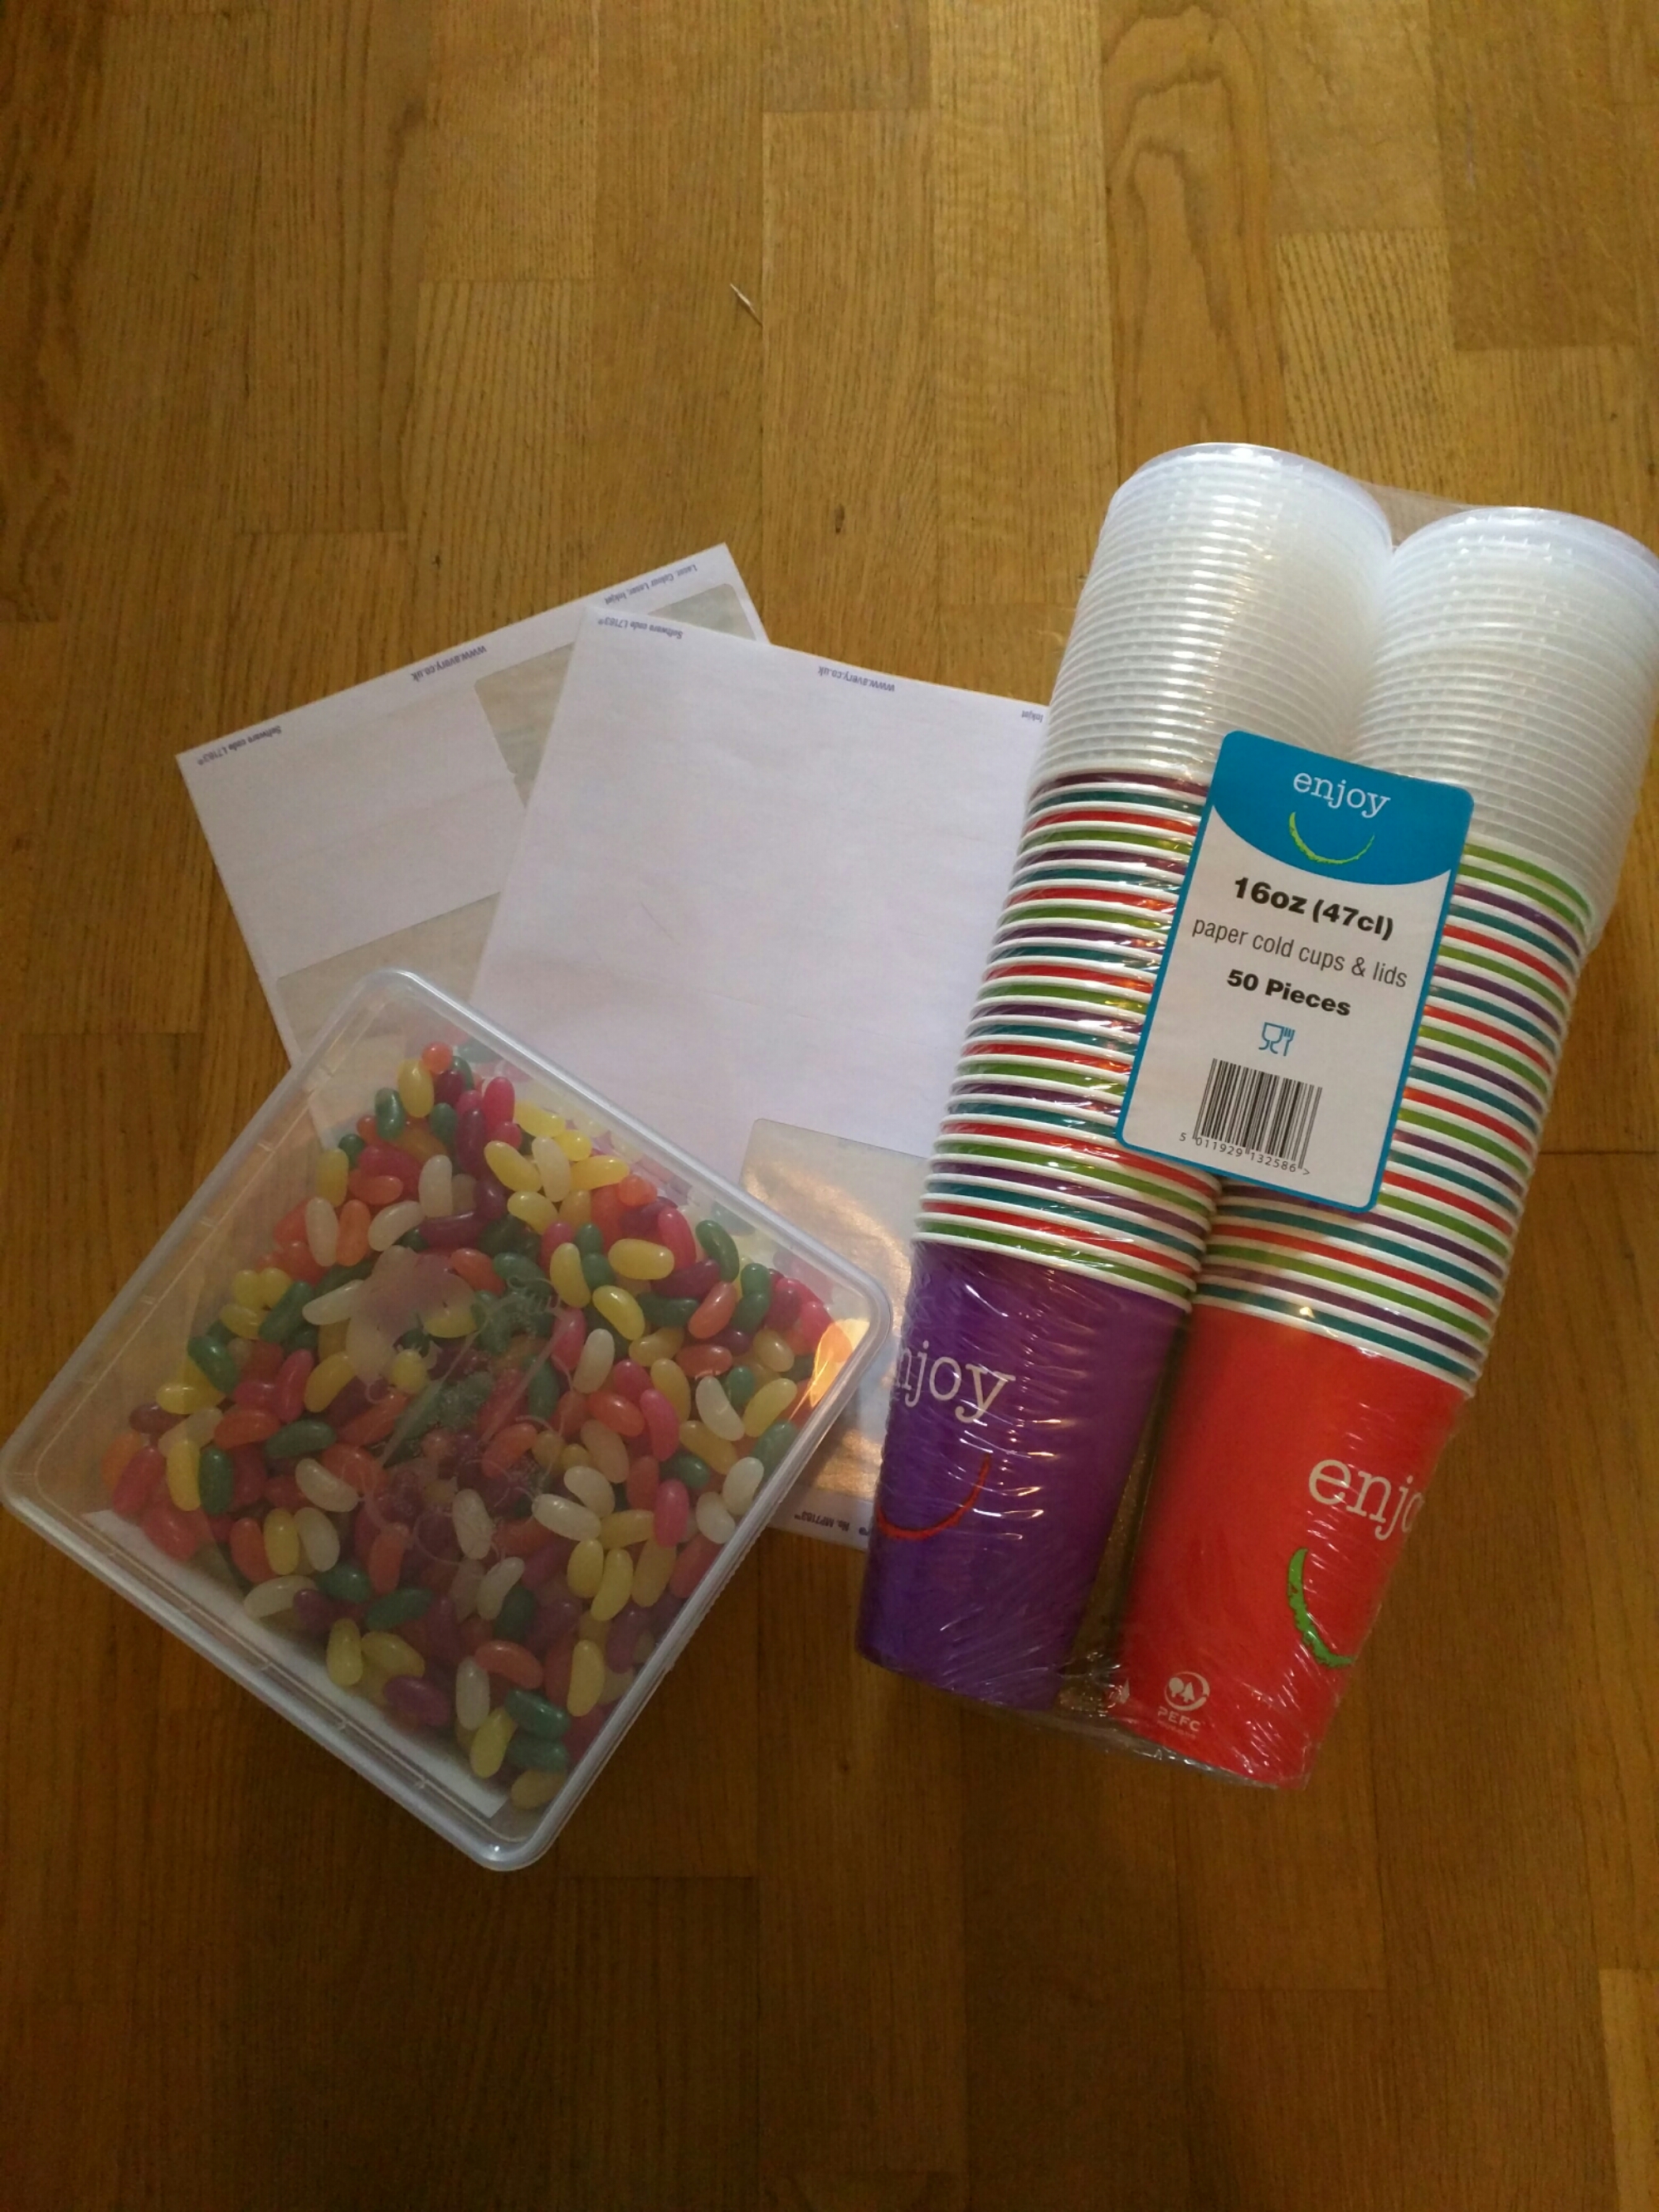
How on earth can you create a maths lesson using these items?
image

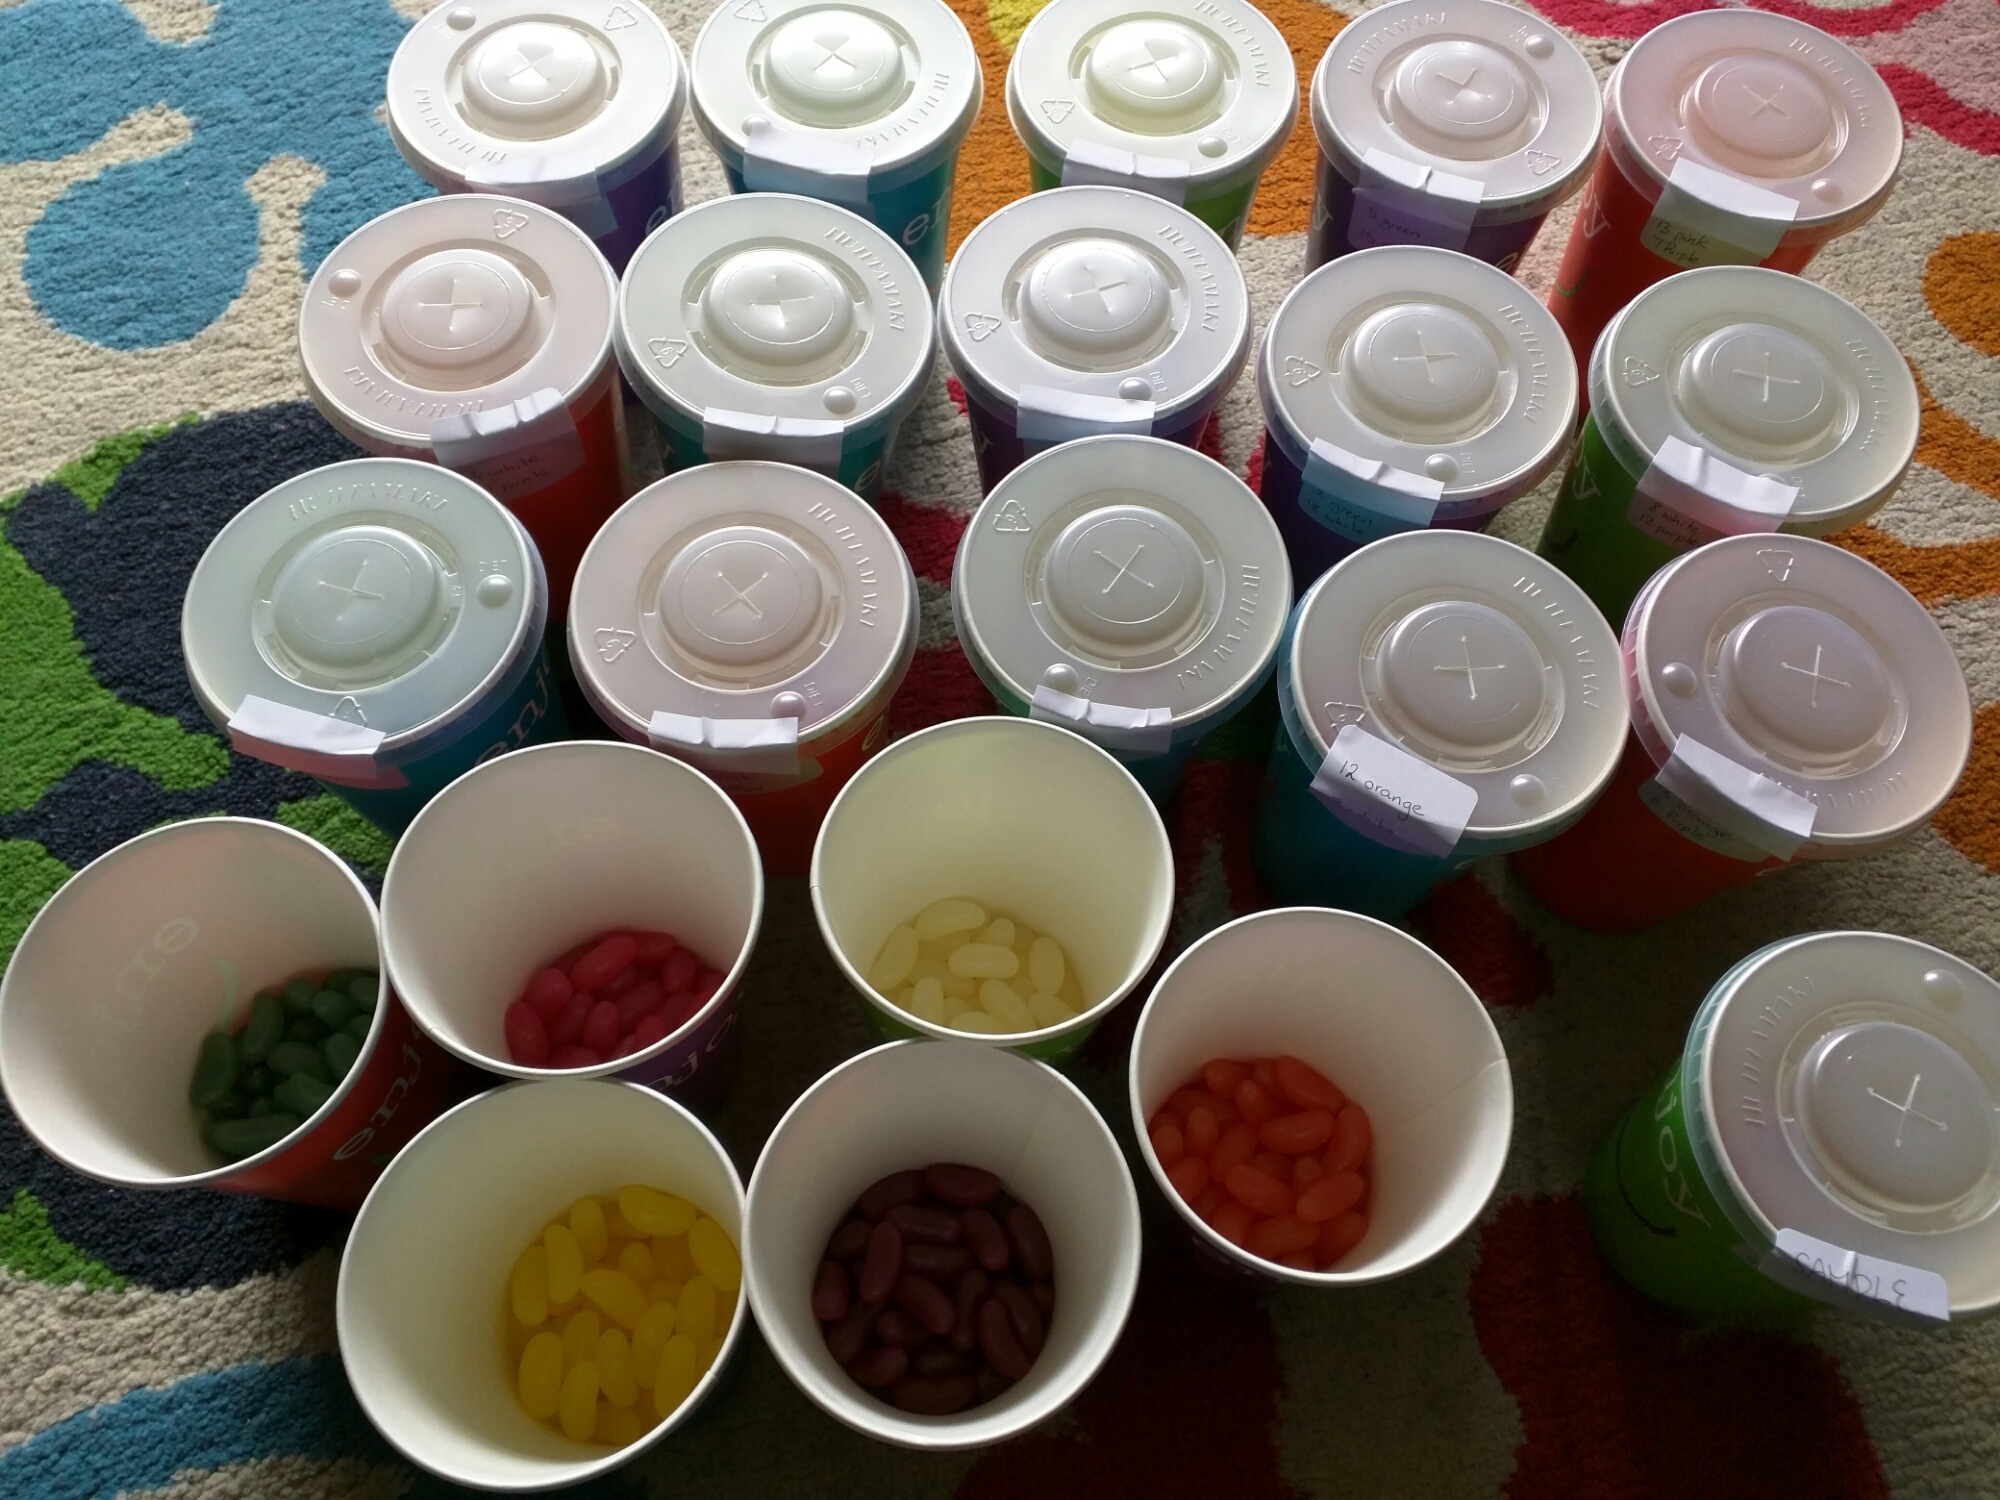
Well, first sort them into colours, then put twenty jelly beans into each cup. Make sure there are only two colours in each cup, write the contents on a sticky label and use that to seal the cup. Each cup should have slightly different numbers or colours – it prevents copying.

Note: Eat all the orange jelly beans – you’ll be doing your dignity a favour!
image

Have you figured it out yet? No? We’re doing probability tree diagrams without replacement. Now I know you could do this with one experiment at the front of the class, but getting everyone involved means it’s more hands-on and memorable.

The Experiment
I did a demonstration of this on the board first, before handing out the cups and worksheets. I told the class what was in my cup and picked out a jellybean. It was orange. I drew the first stage of the worksheet (see below) on the board: What was the experiment? How many of each colour do we have? What is the probability of each colour? Then we filled in the first stage of the tree diagram.

I ate the jellybean.

But you can’t do that – it messes up the experiment! I asked what would be the probabilities for a second jellybean now. They figured out the slight change to the probabilities. Then we went back and thought about what would have happened if my first jellybean had been lemon.

I always encourage students to work out all the possible outcomes before they even look at the rest of the questions. And this is why you need to eat all the orange – the list on the board was:

  • P(LL) =
  • P(LO) =
  • P(OL) =

Do I really need to put the last one?

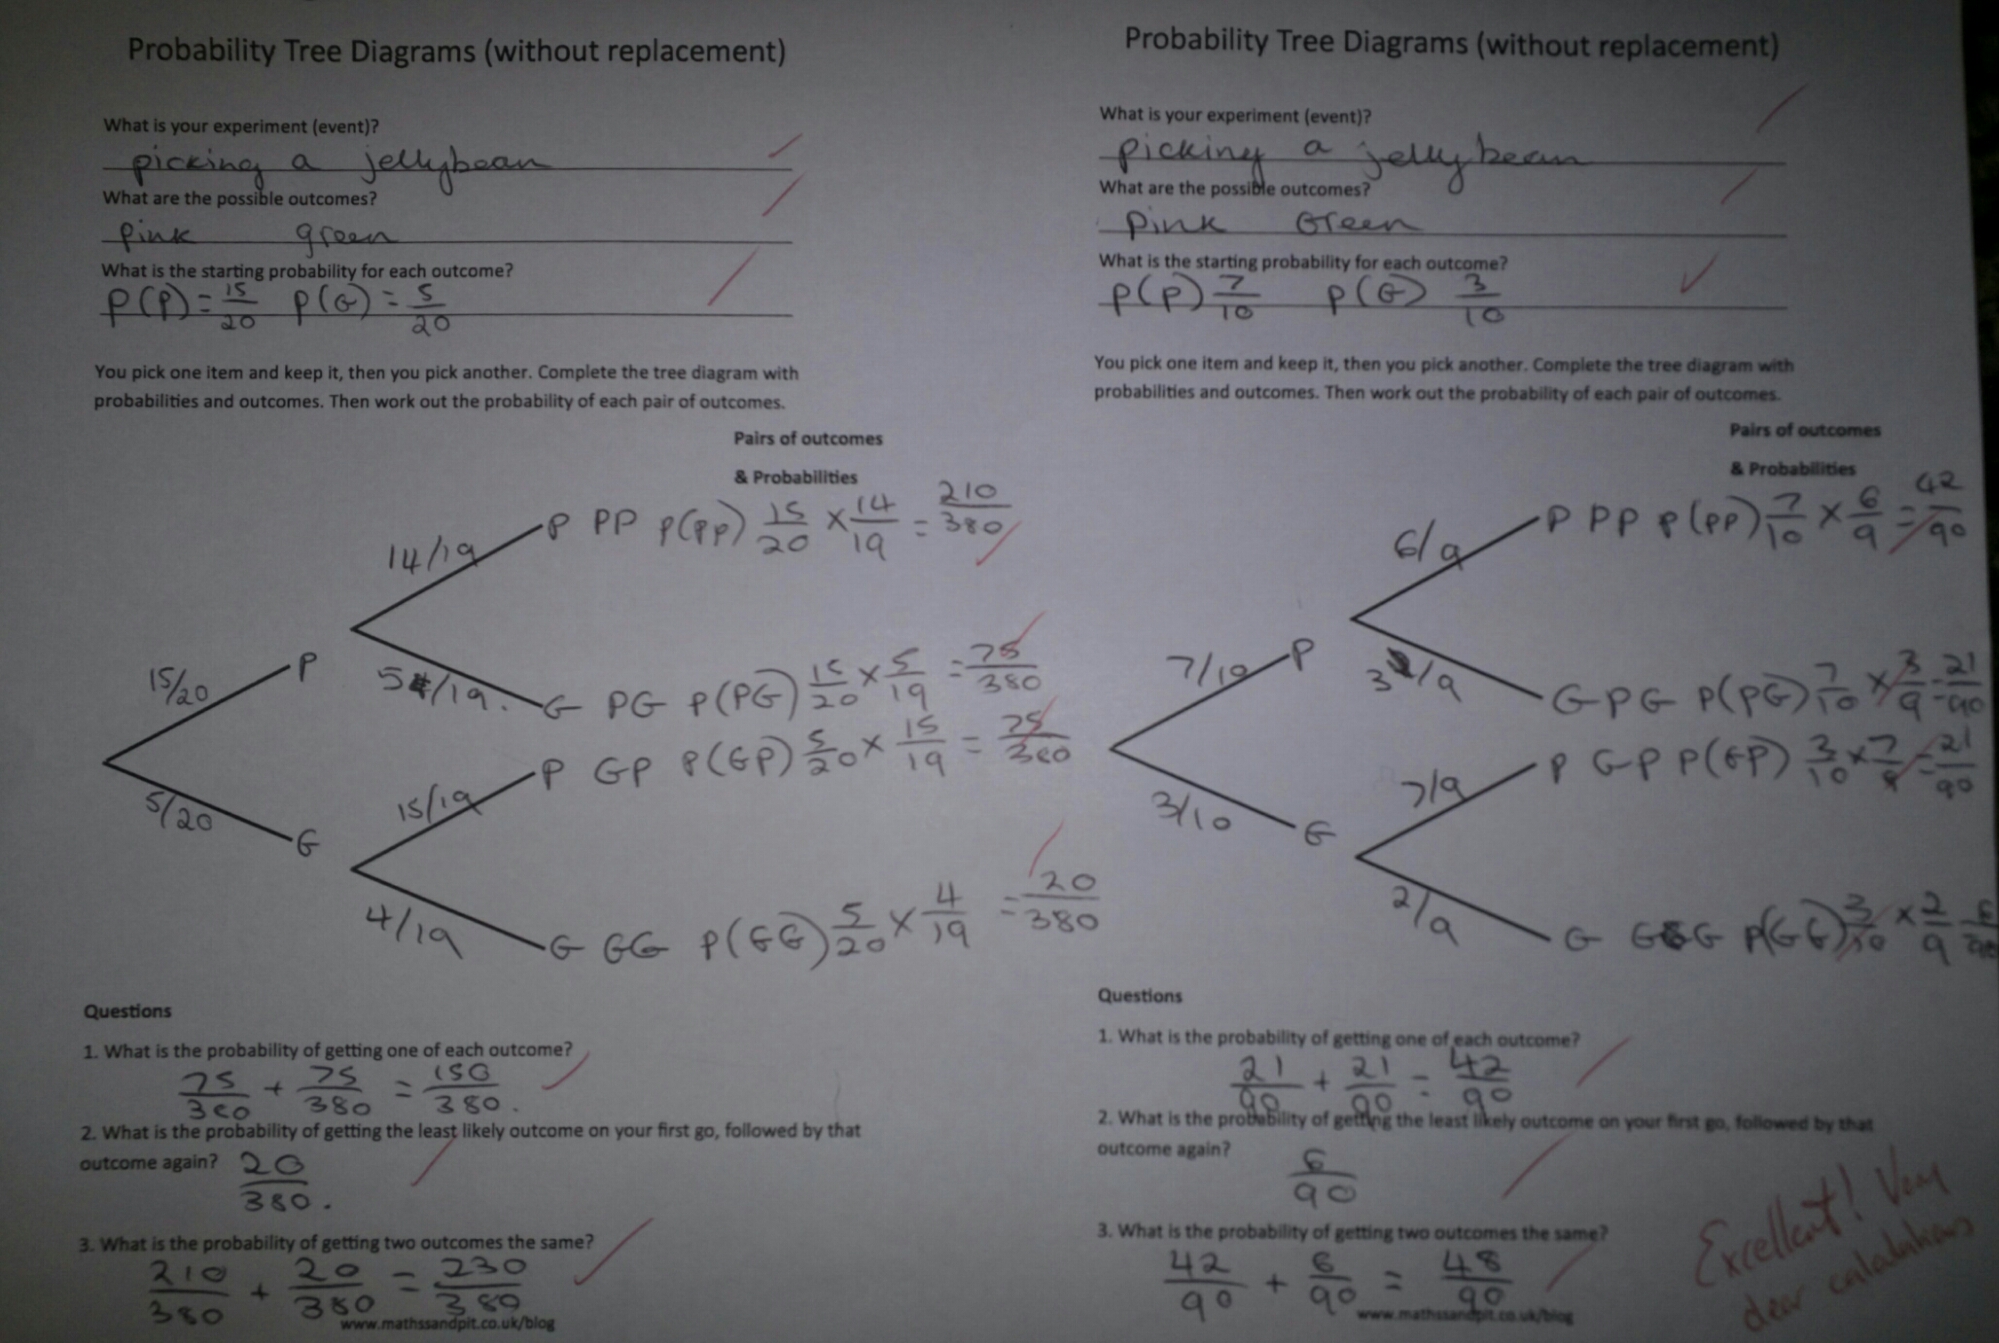
After much giggling, the class were let loose with their own cups. They did the experiment once with their standard cups and then had their work checked. They could then alter (eat) the contents of their cup so that a minimum of five beans of two colours remained. You can see an example of a student’s work here:
image

I summarised the lesson by looking at different types of probability problem where items are not replaced. I now have a nice ‘hook’ to refer to when discussing probability tree diagrams without replacement.

Download the worksheet here:
Tree diagram without replacement (pdf)
I printed out two per page as it fitted nicely in their books. The descriptions are deliberately vague to allow it to be used in different experiments.

(The usual warning regarding food allergies and beliefs stands. Some jellybeans have animal derivative gelatine – please check, you don’t want to accidentally upset a student)

295. I know how to integrate, but which rule to use?

You know that point when you’ve covered the Integration content in A2, the class can do all the different forms and then you set mixed questions … it’s like it’s in a different language. All that wonderful knowledge seeps out like water in a sieve. There must be a help sheet or tool that gives students a starting point, until their confidence and experience grows?

core 4 integration flowchart

Rewind to proving an integration rule. I was discussing a textbook proof of an integration rule with a student and I just didn’t like it. It niggled in my head that I’d been shown a better method when I was first learning this stuff. After a quick dash to the stockroom and a climb up a step ladder, I found a later edition of the textbook I’d used at A-Level. I was right – the Bostock & Chandler proof was far more elegant and comprehensible. Problem solved!

While I had this book out I had a flick through the pages. A flowchart caught my eye – not a fancy infographic, a proper ‘get the flowchart stencil out’ chart. It basically talks students through how to choose an integration strategy. I could have photocopied the page, but it was rubbish quality when I tried. I believe the book is now out of print, so I have recreated the flowchart page with full credit to it’s source. I hope it helps your students as much as it has mine.

C4 Integration flowchart (pdf)

293. Boxing Bounds

I thought this would make a nice little starter – address a few different topics, bit of problem solving, all over in 15 minutes. How wrong I was!

The Question: A company packs toys into boxes which measure 12cm by 8cm by 10cm (to the nearest centimetre). The boxes are packed into crates which measure 1m by 0.75m by 0.8m (to the nearest centimetre).
(a) Basic question – How many boxes fit into the crate?
(b) What is the maximum volume of a toy box?
(c) What is the minimum volume of the crate?
(d) Look at your answers to (b) and (c) – do they affect your answer to (a)?

It was a simple question about fitting toy boxes into a shipping crate. It extended to looking at upper and lower bounds, then recalculating given this extra information. Simple? No chance!

Problem One
Not changing to the same units

Problem Two
Working out the two volumes and dividing to find the number of toys. When challenged on this, it took a while to get through to the basics of how many toys actually fit – mangled toys and split up boxes don’t sell well.

Problem Three
Maximising the arrangement of boxes – remainders mean empty space

Problem Four
Using the information from Problem Three to find the total number of toys

Problem Five
Working out the dimensions and volume of the empty space in the box

Problem Six
Trying to convert centimetres cubed into metres cubed. I don’t even know why they wanted too!

Problem Seven/Eight
What’s an upper/lower bound?

Problem Nine
What do you mean that the original answer changes when the box size alters?

Problem Ten
All those who weren’t paying attention when you went over Problem Two and don’t ‘get’ why the answer isn’t 625!

291. Elves and Trees

elf-clip-art-elf1

Image credit: www.clipartpanda.com


Here is a quick festive probability resource for you covering elves, outcomes and tree diagrams. The task starts with logically listing outcomes, before looking at working with tree diagrams in the extension.

Elves outfits tree diagrams (pdf)

290. Alcoholic Percentages

The season of gratuitous excess is upon us and the reminders about safely consuming alcohol are popping up in supermarkets … usually next to the massive bottle of brandy, which are on special offer! We educators are counting the days to the holiday break.

But wait!

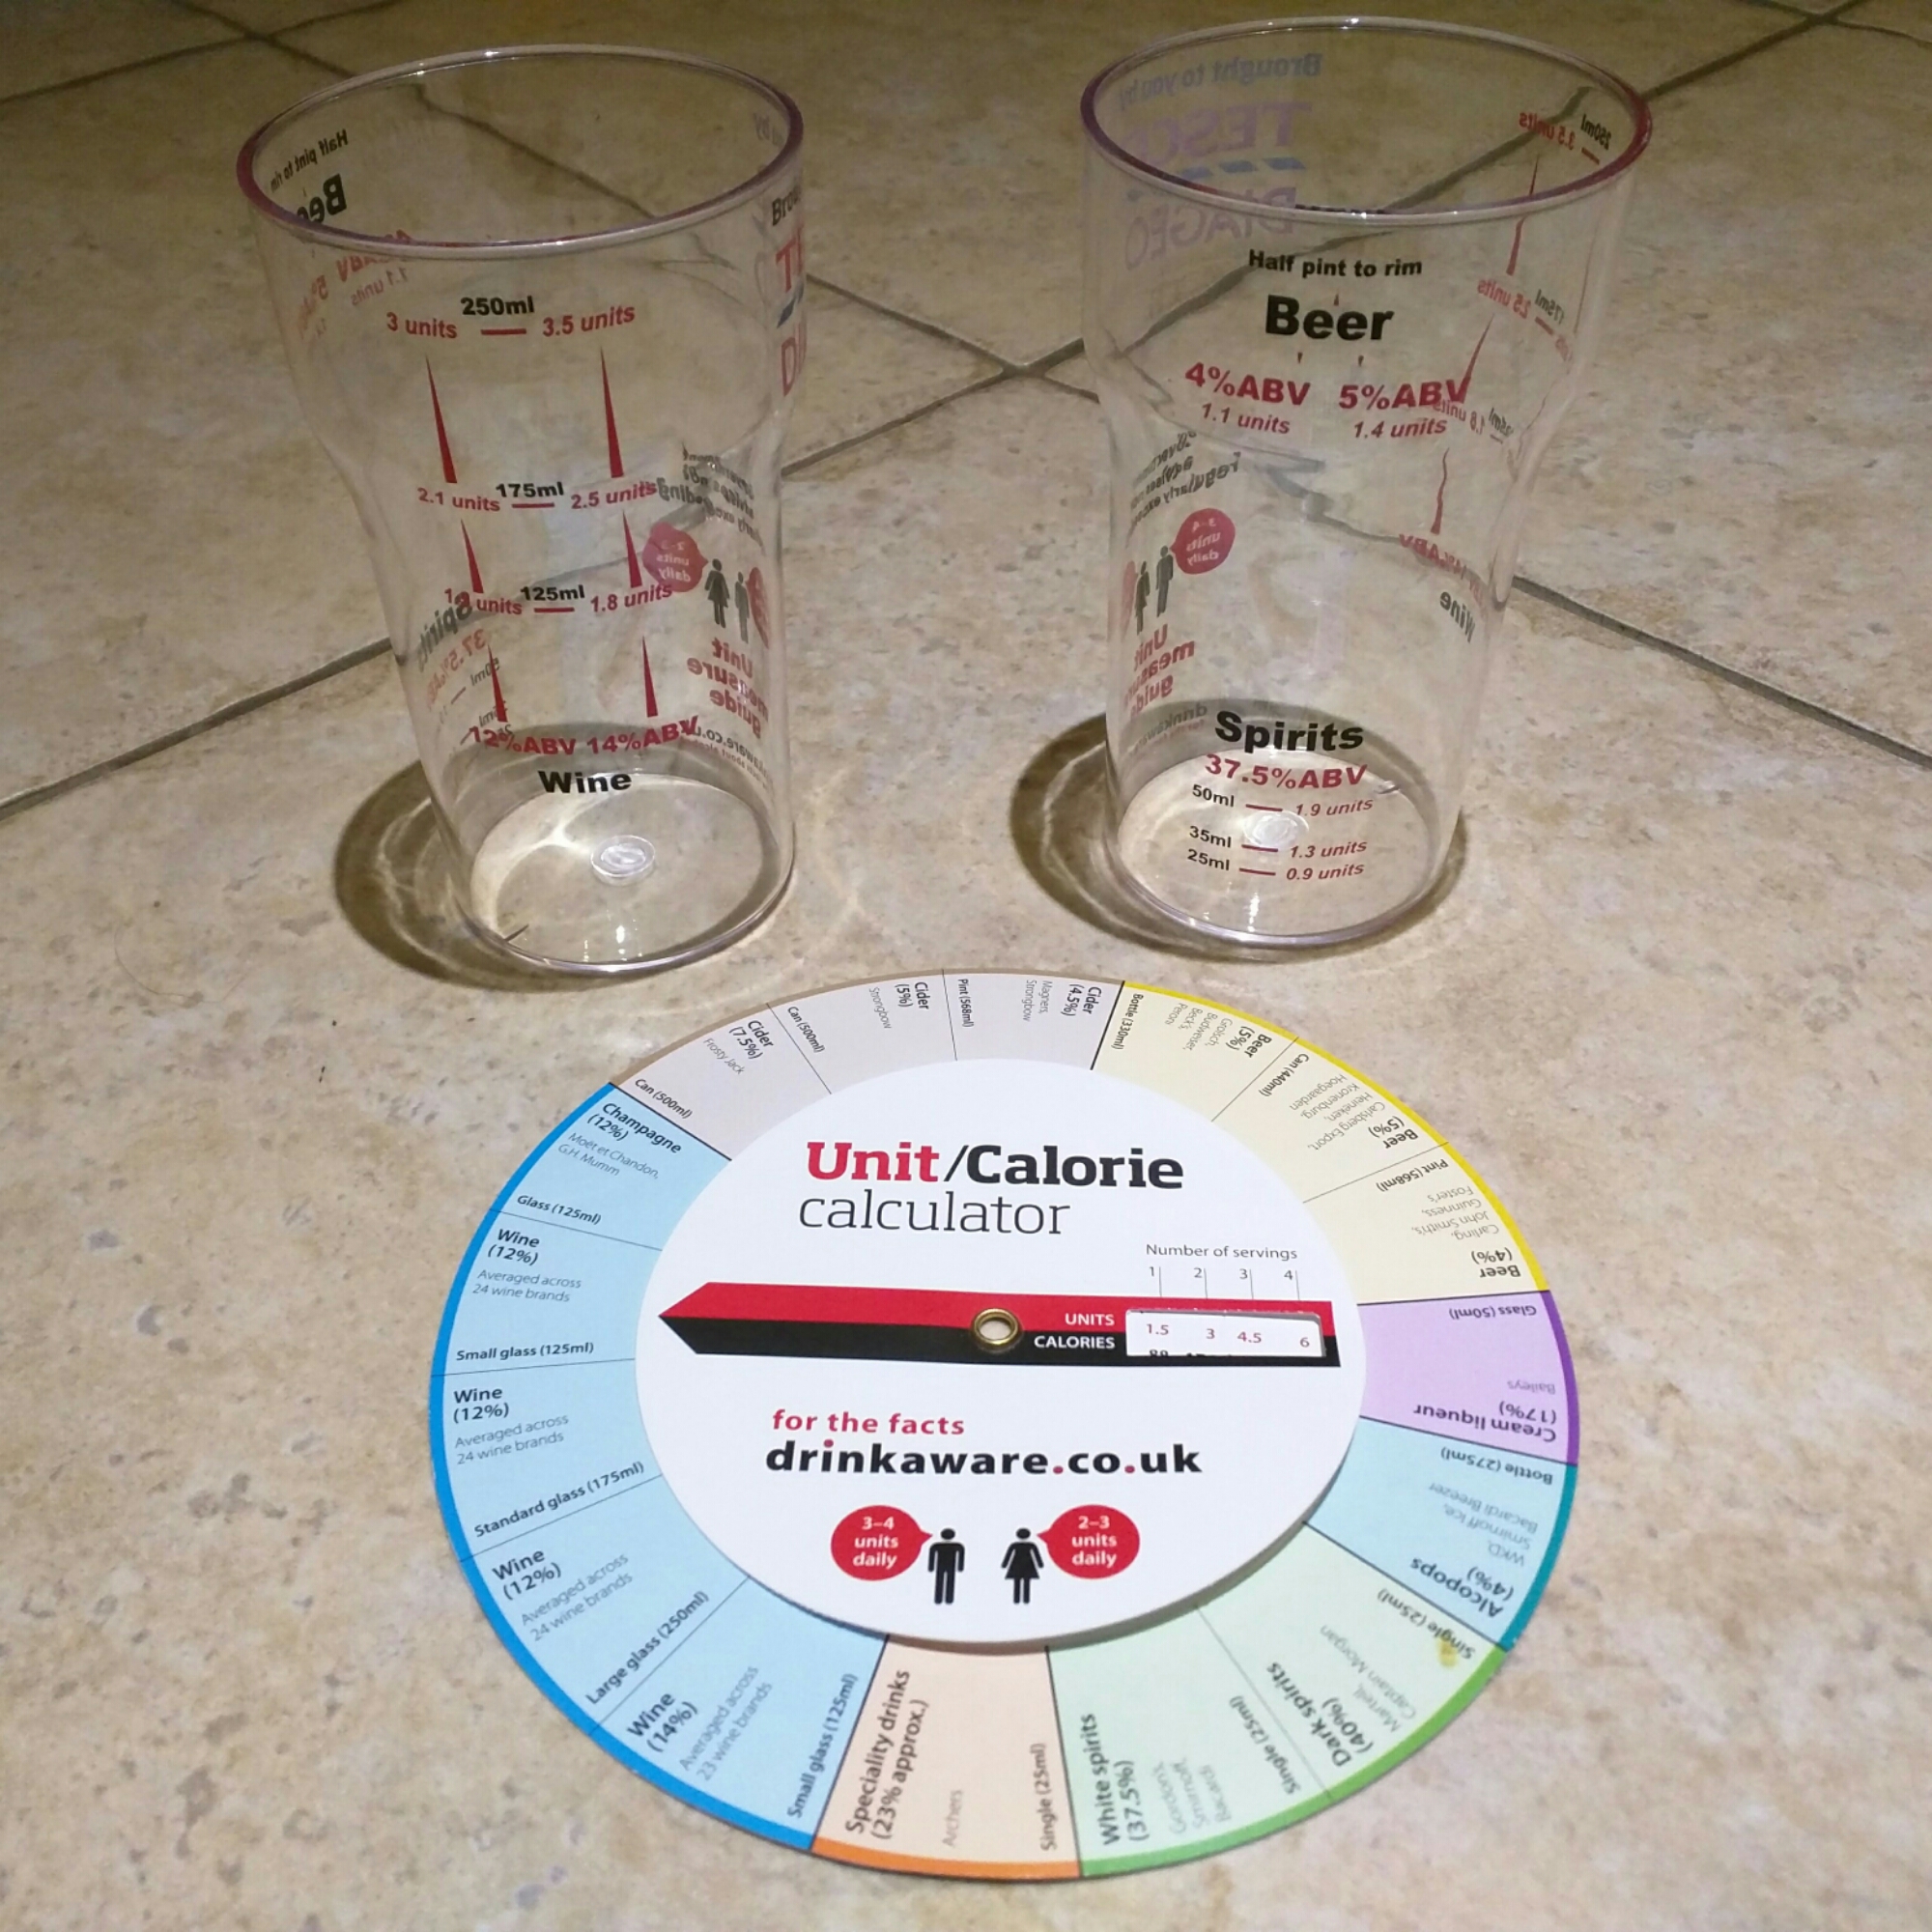
Keep your eyes peeled for all the alcohol awareness promotions. My local supermarket had information leaflets and these goodies:

image

Forget doing percentages about sale prices. How about working out the volume of alcohol in different beverages? Finding out how easy it could be to exceed the recommended intake? A bit of education of the effects of alcohol in a cross curricular lesson?

Now how much brandy soaked Christmas cake is equivalent to one unit of alcohol?