Category Archives: Download

257. Making the absurd Rational

Here’s a nifty little resource for you, once again inspired by @MrReddyMaths

mathsheart

Image Credit: http://blog.spaldingacademy.k12.ne.us/sa/files/2010/09/math-3.gif

This worksheet takes you through the process of rationalising fractions where the denominator is a surd. All of the numerators are integers to make the focus the denominator.

Updated version of (pdf)

This new version is A4 sized to allow more space for working out.

If you like this, why not try out these:

232. Steps in Volume

241. Histogram Hysteria


255. Resource of the Week

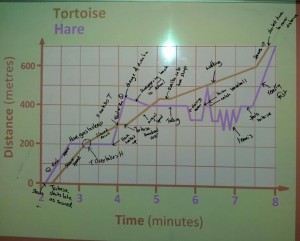
I can’t wait to share the resource I stumbled across this week. I had planned a lesson on distance-time graphs, for my Foundation GCSE class, at home and went into school to print out my resources, only to discover the photocopier was broken!  I went to the TES website and found this brilliant set of resources on distance-time graphs. They required a small amount of printing, but engaged a ‘bouncy’ class very effectively!

Hare-and-The-Tortoise-Distance-time-graphs by lttmaths.

  • The PowerPoint presentation takes you through interpreting graphs. It also supports my teaching method of ‘every graph tells a story’.
  • The Disney cartoon (from 1934) entertained the class and introduced the idea that graphs are not just A to B in the fastest time. Although they were a little concerned about the age gap between the Hare and the schoolgirl bunnies he was flirting with.
  • My usually less than enthusiastic class did an outstanding job explaining what the graphs showed, as shown by all these annotations:

distance time graphs

  • The activities and plenaries are a perfect fit.

Go and try out these resources next time you are working with distance-time graphs!

251. Safe as trees

Here’s a two in one post for you, with a wooden theme:

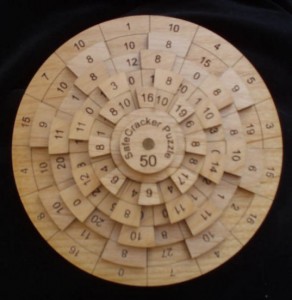
safecracker

Tree 1

This fascinating wooden puzzle is available on Etsy. Each line has to add up to 50 – simple? Not as easy as you’d think. A perfect classroom extension puzzle or gift for a puzzle fanatic!

Tree 2

A little starter on logarithms, with a touch of safecracking too!

Crack the safe Logarithms

The questions are sourced from an A-Level textbook – why not make your own textbook tasks more interesting by creating your own safecrackers on the board? Five minutes prep = puzzle fun!

250. Crack the Circle

Here’s a quick resource for consolidating and revising the area and perimeter of circles and semi-circles.

Circles Crack the Safe (pdf)

Pupils complete the worksheet then work out the code. I personally like having a clear glass Kilner-style jar with a combination padlock at the front of the class … with a little treat for the class to aim for securely locked inside!

247. The Elf Challenge

It was the month before Christmas and all through the house not a creature was stirring – except for the senior elves who were on the brink of all out war. Father Christmas had picked up some leadership strategies on his travels and decided to send his management elves on a team building day … paintballing!

Don’t be fooled – this is no simple Christmas time-filler. This task requires problem solving strategies, two-way tables, averages, data analysis and logic. In fact, you might want to have a go yourself. There is a task sheet, support sheet and solution.

The Elf Challenge (pdf)

Enjoy the puzzled faces and watch the arguments when students try to justify their answers.

246. ChrisMaths Cheer

Hey … it’s that time of year again! Baubles and cheesy jumpers are creeping into the most mundane of places. How about a more mathematical festive season?

tb-piornaments

Image credit: http://technabob.com/blog/

Here is a round up of the Sandpit’s Christmas resources:

Twelve Days of ChrisMaths

243. Messy Means

I have recently been teaching lower ability Year 9 students how to calculate the mean from grouped and ungrouped data tables. I didn’t want to teach them a method to learn by rote, so I used a more investigative approach.

mr-messy-mykea

Image Credit: http://www.thisismykea.com/designs/mr-messy

Grouped Frequency tables discussion

Estimated messy mean A (pdf)

I started with a table with all the working shown, but some information blacked out. Each group had an A3 version and they filled in what was missing.

Estimated messy mean B (pdf)

The second table had more information covered up. After a discussion the groups decided there wasn’t enough information and they would have to guess what the missing numbers were.

Estimated messy mean C (pdf)

The third table had minimal information. Each group used their own method to find the missing values. Some chose the largest value in the range, some guessed what the results could have been in each group and one group decided to calculate two means – one using the largest value and one using the smallest.

We collected our results together on the board and discussed their accuracy. The class decided to use the middle of each range to calculate the estimated mean. They had gone from no understanding of estimated mean to formulating their own method.

We followed this up a Splitting the Steps estimated mean worksheet that I wrote after seeing Bruno Reddy’s presentation after #MathsConf2014 (Mr Reddy’s blog).

Follow him on Twitter: @MrReddyMaths